50+ Advertising Statistics: Spend, Platforms & Trends (2026)
Last updated: March 2026
Global advertising spend has surpassed $1 trillion, digital now claims 73% of the total, and the average person is exposed to 4,000-10,000 ads every day. Here are 100+ advertising statistics covering global market size, digital vs. traditional, top platforms, ad blocking, programmatic, CTV, and ROI benchmarks for 2026.
Key Advertising Statistics (2026)
- Global ad spend: $1 trillion+ in 2025 (GroupM)
- Digital advertising: 73% of total ad spend (eMarketer)
- Google ad revenue: $307 billion (Alphabet Annual Report)
- Meta ad revenue: $164 billion (Meta Investor Relations)
- Ad blocking used by 42.7% of internet users (Backlinko)
- Programmatic = 91% of digital display ads (eMarketer)
- Average person sees 4,000-10,000 ads per day (PPC Protect)
- Retail media ad spend: $62 billion (eMarketer)
Global Advertising Market Size
| Metric | Value | Source |
|---|---|---|
| Global ad spend (2025) | $1.04 trillion | GroupM |
| US ad market | $390 billion | eMarketer |
| China ad market | $175 billion | Statista |
| UK ad market | $46 billion | GroupM |
| Global ad industry growth (YoY) | 7.7% | GroupM |
| Digital ad spend | $740+ billion | Statista |
| Traditional ad spend | $280 billion | GroupM |
| Advertising jobs (US) | 500,000+ | BLS |
- Global ad spend crossed the $1 trillion milestone for the first time in 2025 — doubling from $500B in just eight years
- The top 5 advertisers (Amazon, Procter & Gamble, Unilever, L’Oréal, Samsung) spend a combined $50+ billion annually
- Advertising as a share of global GDP: ~1.2%, a ratio that has remained stable for decades despite digital disruption
- 75% of ad market growth comes from digital — traditional channels are flat or declining
- The advertising agency market is worth $600 billion globally, with consolidation accelerating among the Big Six holding companies
Digital vs. Traditional Advertising
| Channel | 2025 Spend | Share of Total |
|---|---|---|
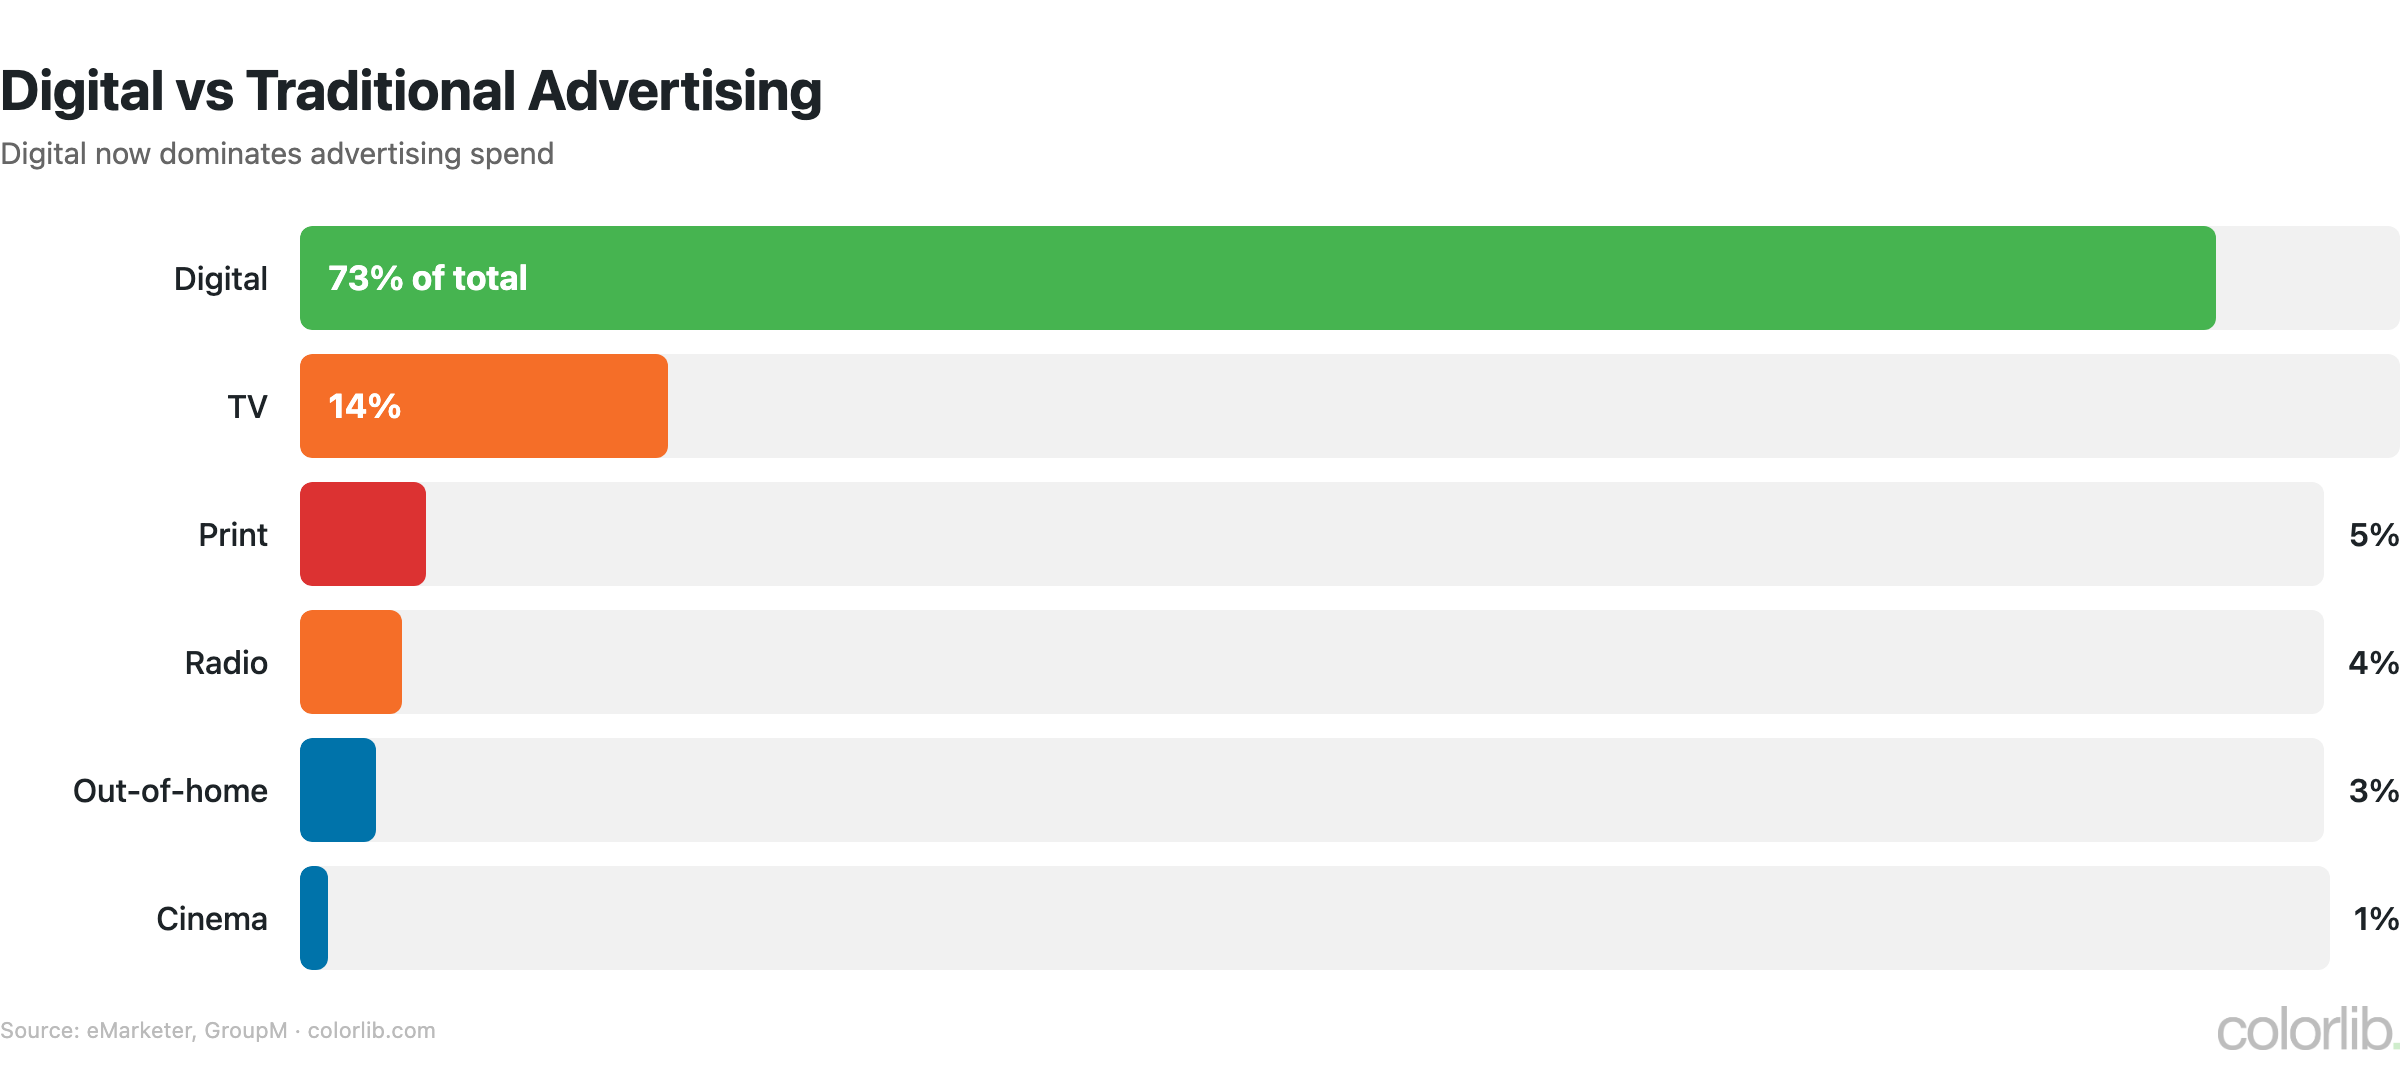
| Digital (total) | $740 billion | 73% |
| TV (linear + CTV) | $160 billion | 15.5% |
| Out-of-home (OOH) | $42 billion | 4.1% |
| Print (newspapers + magazines) | $35 billion | 3.4% |
| Radio / Audio | $30 billion | 2.9% |
| Cinema | $4 billion | 0.4% |
- Digital surpassed traditional advertising in 2019 and has widened the gap every year since
- Linear TV ad spend has declined 4-6% annually since 2020, while CTV grows 20%+ per year
- Print advertising has contracted by 60%+ in the past decade, with newspaper ads hit hardest
- Digital out-of-home (DOOH) is the brightest spot in traditional media, growing 12% annually
- Podcast advertising has grown to $4 billion, bridging the gap between digital and audio
Top Advertising Platforms
| Platform | Ad Revenue (2025) | Key Metric |
|---|---|---|
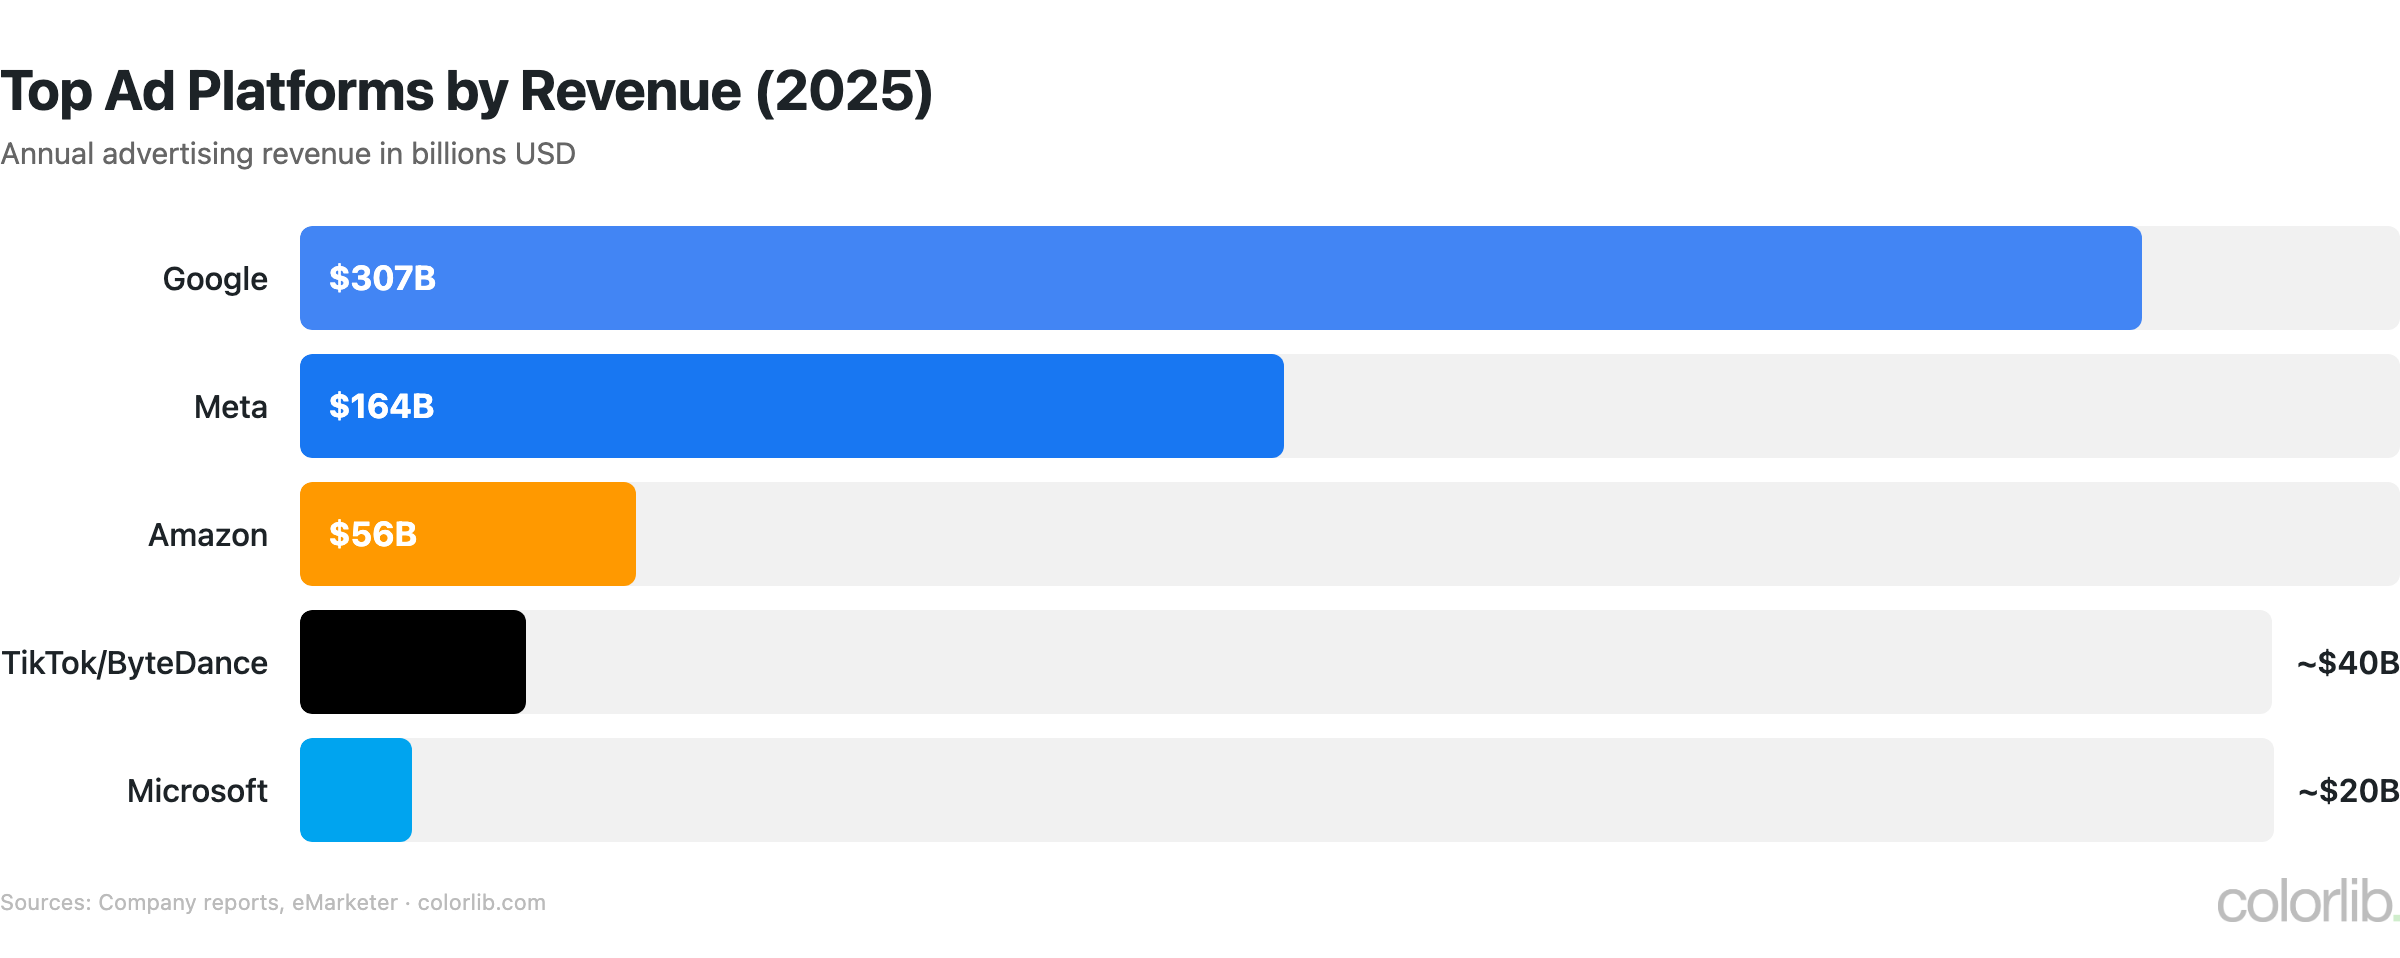
| Google (Search + YouTube) | $307 billion | 28.6% global digital share |
| Meta (Facebook + Instagram) | $164 billion | 3.07B daily active users |
| Amazon Ads | $56 billion | Fastest-growing major platform |
| TikTok / ByteDance | $35 billion | 1.5B monthly active users |
| Microsoft (Bing + LinkedIn) | $20 billion | LinkedIn: 1B members |
| Apple (Search Ads + News) | $9 billion | Growing via App Store + services |
| $3.6 billion | High purchase intent audience | |
| Snap | $4.8 billion | Gen Z focus, AR ads |
- Google and Meta together control 44% of global digital ad spend — down from 54% in 2020 as competitors grow
- Amazon is the 3rd largest ad platform globally, growing 24% year-over-year on the strength of retail media
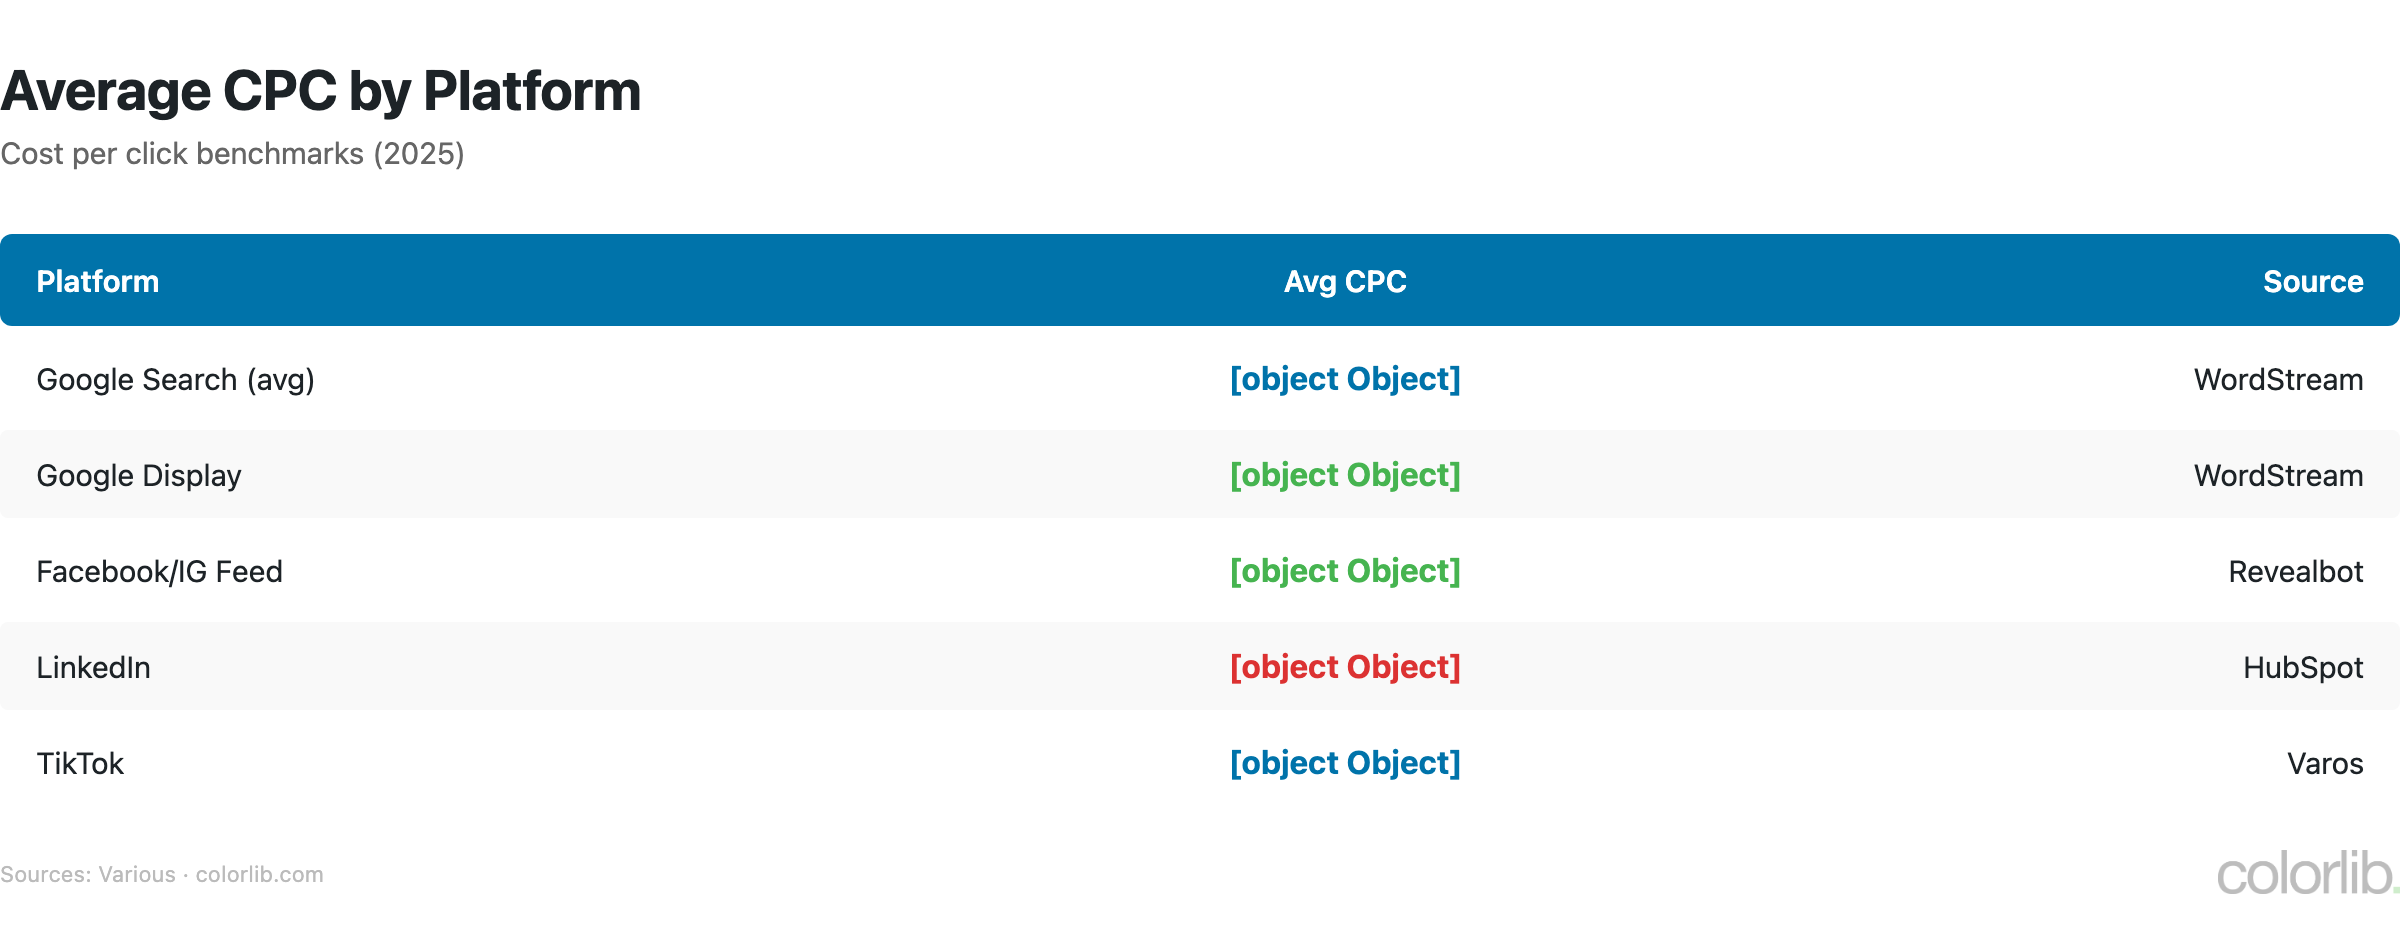
- Average Google Ads CPC: $2.69 for search, $0.63 for display (WordStream)
- TikTok ad revenue has tripled since 2022, with CPMs still 30-40% below Instagram Reels
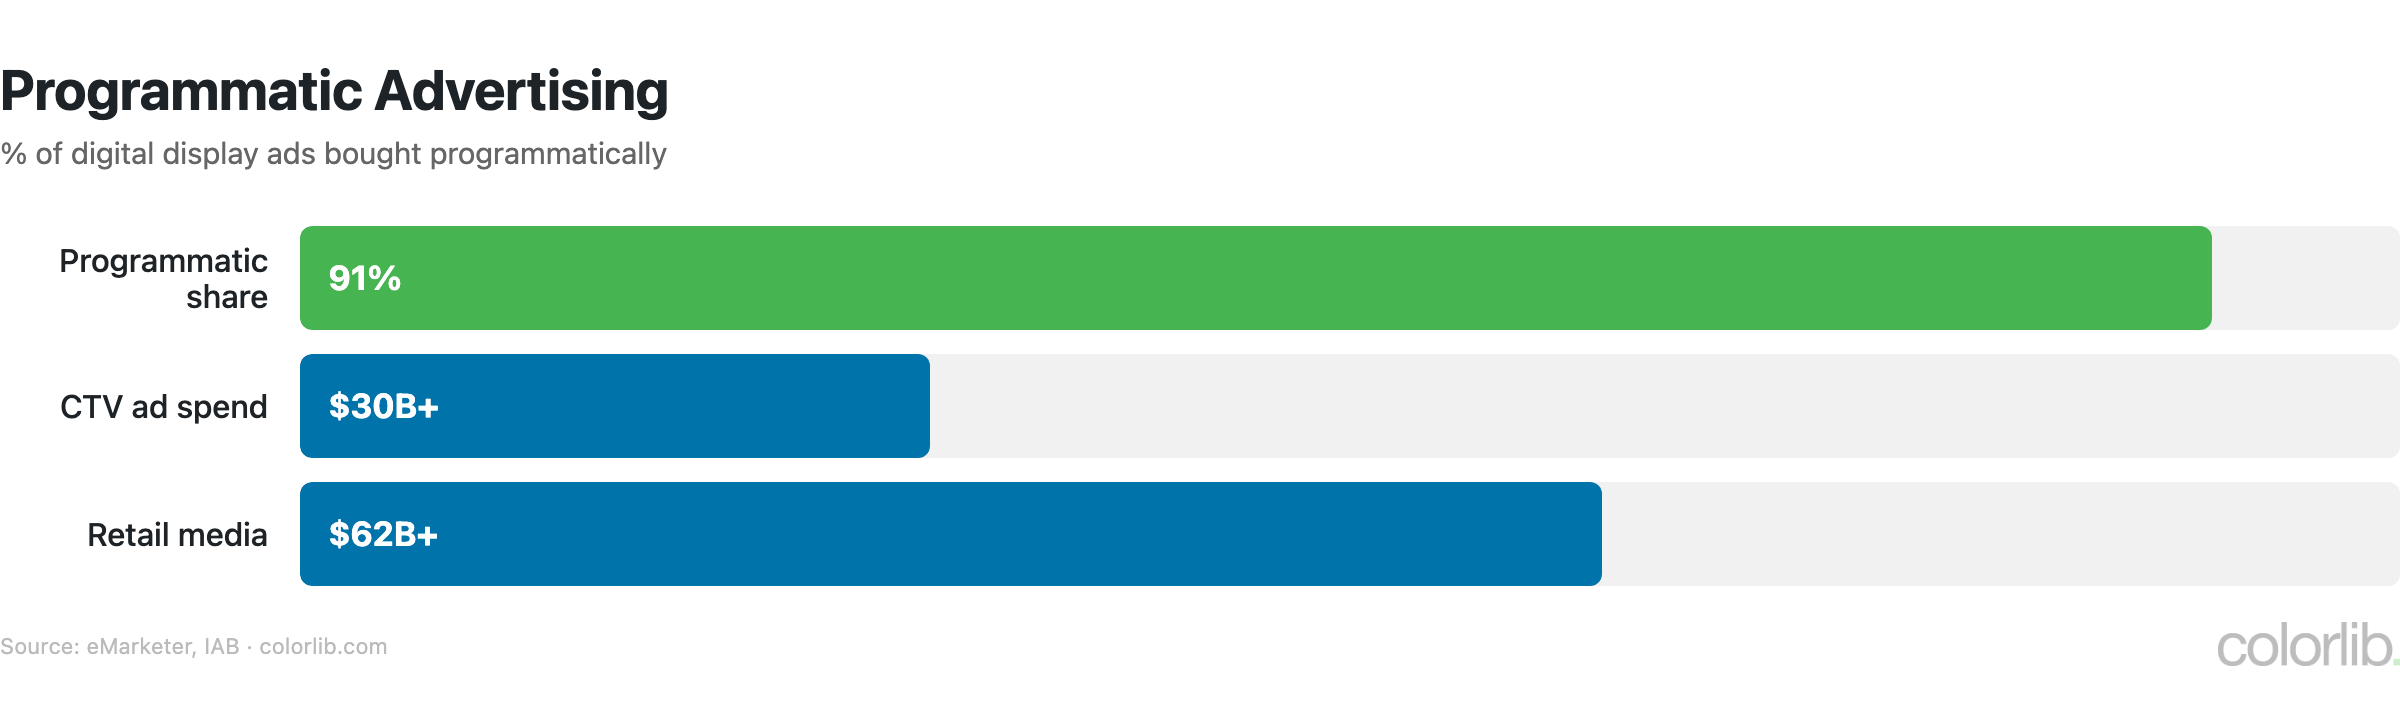
- Retail media networks (Amazon, Walmart, Instacart) collectively generate $62 billion — now the 4th largest ad channel
Ad Blocking Statistics
| Metric | Value | Source |
|---|---|---|
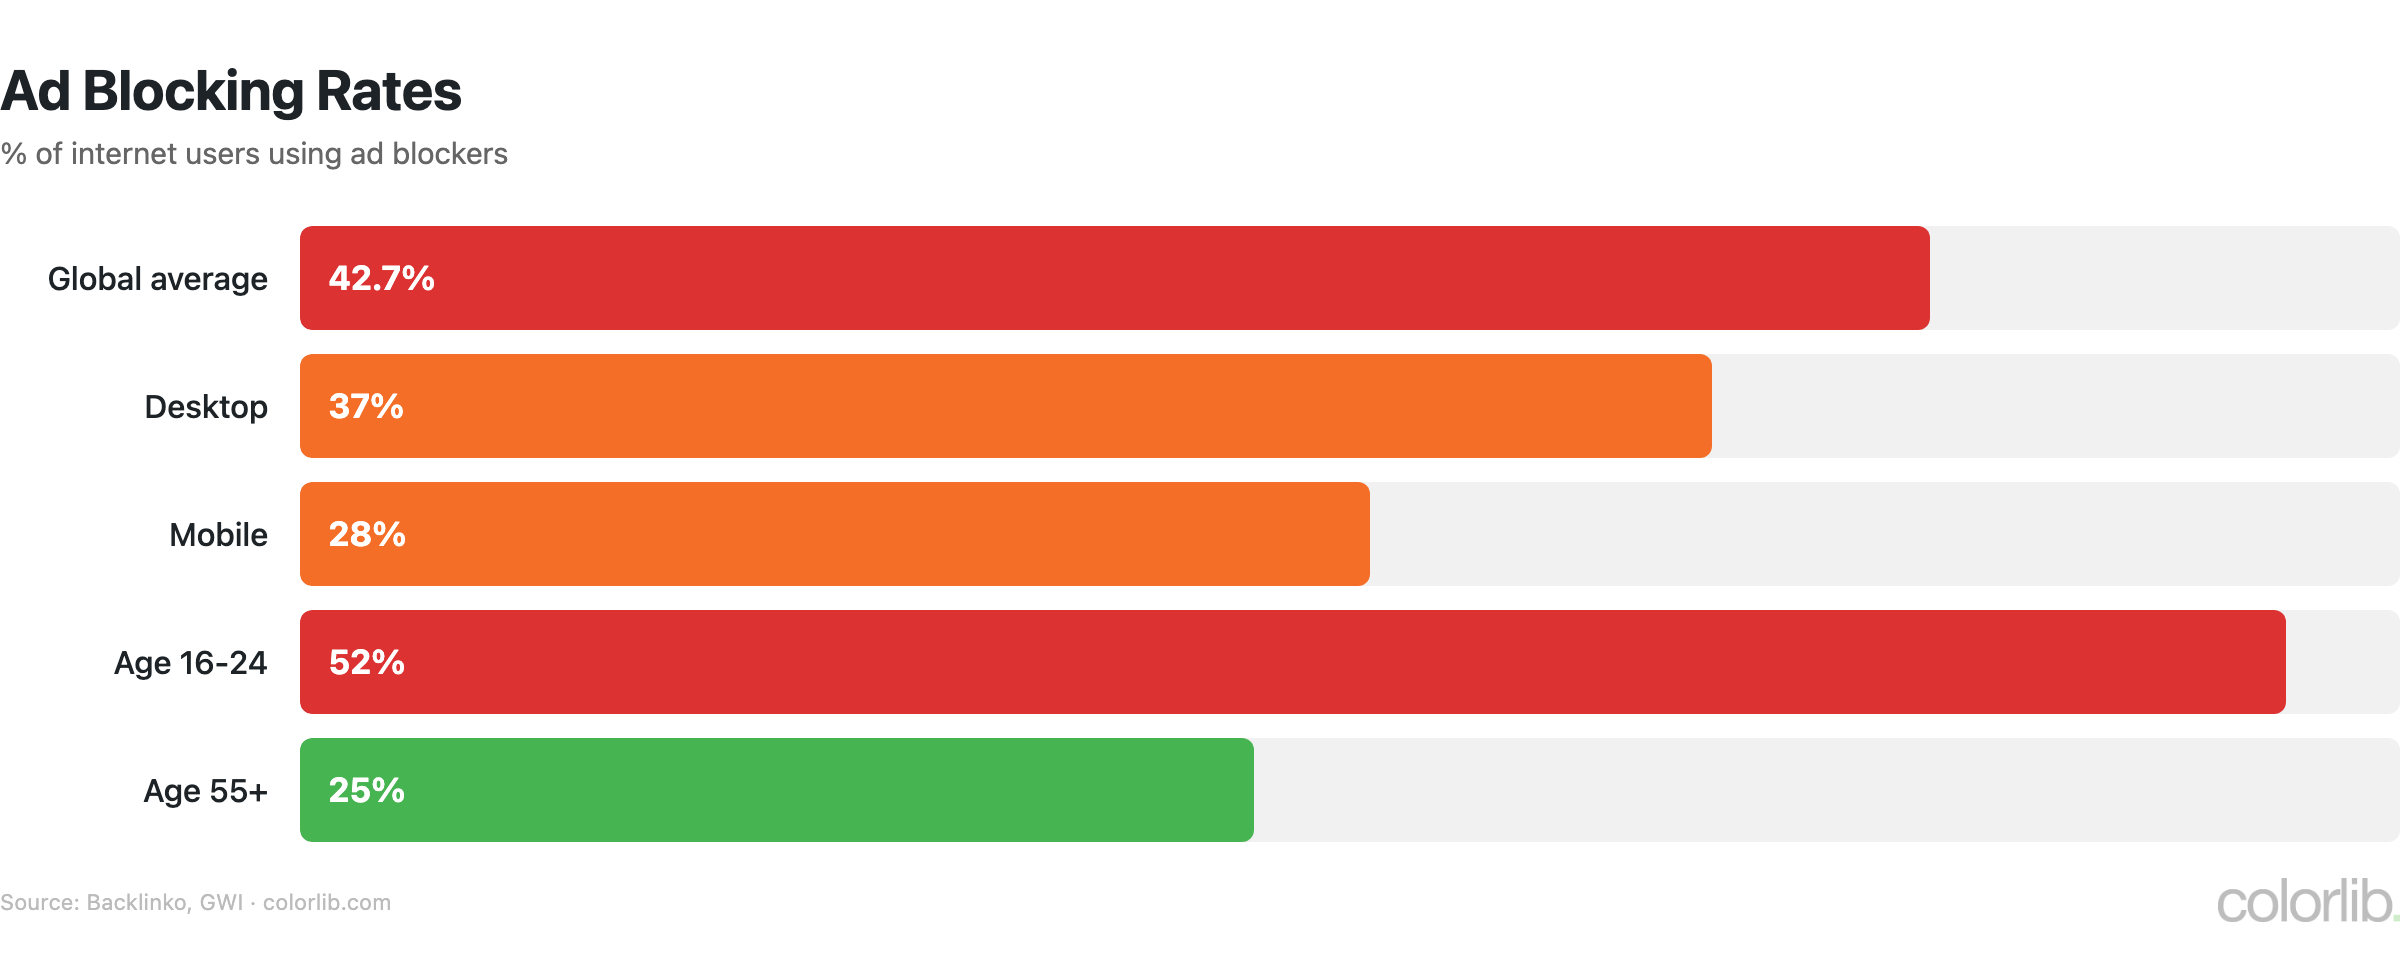
| Global ad blocker usage | 42.7% of internet users | Backlinko |
| Ad blocker users worldwide | 912 million | Statista |
| Revenue lost to ad blocking | $78 billion annually | PageFair |
| Desktop ad blocking rate | 31% | Statista |
| Mobile ad blocking rate | 28% | PageFair |
| Top reason for ad blocking | Too many ads (48%) | GWI |
| Gen Z ad blocker usage | 52% | GWI |
- Ad blocking has grown 8% annually since 2020, driven by privacy concerns and intrusive ad formats
- 74% of ad blocker users say they would disable their blocker for non-intrusive ads
- YouTube ad blocking has surged since Google’s crackdown — 29% of users have found workarounds
- Publishers who adopt the Acceptable Ads Standard recover 15-25% of blocked revenue
- CTV and in-app ads are largely immune to blocking, contributing to their rapid ad spend growth
Programmatic & CTV Advertising
| Metric | Value | Source |
|---|---|---|
| Programmatic share of display | 91% | eMarketer |
| Programmatic ad spend (US) | $168 billion | eMarketer |
| CTV ad spend (US) | $30+ billion | eMarketer |
| CTV households (US) | 115 million | Leichtman Research |
| CTV ad spend growth (YoY) | 22% | eMarketer |
| Average CTV CPM | $20-35 | Statista |
| Ad-supported streaming viewers | 170 million US adults | eMarketer |
- Programmatic advertising now handles 91% of all digital display ad transactions — up from 70% in 2019
- Netflix, Disney+, and Amazon Prime’s ad tiers have added $8 billion in new CTV ad inventory since 2023
- CTV ad completion rates average 95%+, far exceeding desktop video (70%) and mobile video (80%)
- First-party data strategies have become essential as third-party cookies phase out — 78% of advertisers are investing in first-party data infrastructure
- Supply-path optimization (SPO) has reduced programmatic intermediary fees by 15-20% for major advertisers
ROI Benchmarks by Channel
| Channel | Average CPC / CPM | Average ROAS |
|---|---|---|
| Google Search Ads | CPC: $2.69 | 8:1 |
| Google Display Ads | CPM: $3.12 | 2:1 |
| Facebook / Instagram Ads | CPM: $7.19 | 4:1 |
| TikTok Ads | CPM: $5.03 | 3:1 |
| LinkedIn Ads | CPC: $5.26 | 5:1 (B2B) |
| Amazon Sponsored Products | CPC: $1.20 | 7:1 |
| CTV / OTT | CPM: $25-35 | 3.5:1 |
| Email Marketing | Cost: $0.01-0.05/email | 36:1 |
- Google Search delivers the highest intent-based ROAS at 8:1, but rising CPCs are squeezing margins for competitive keywords
- Social media CPMs average $6-10 across platforms, with TikTok still offering the best value for reach
- Amazon ads achieve 7:1 ROAS because shoppers on the platform already have purchase intent
- The average cost per lead across all industries is $198 — but varies from $35 (ecommerce) to $500+ (legal)
- Omnichannel campaigns deliver 300% higher ROI than single-channel campaigns
Key Takeaways
- The $1 trillion milestone is here. Global ad spend has crossed the symbolic threshold, with digital commanding 73% and growing.
- The duopoly is weakening. Google and Meta dropped from 54% to 44% share. Amazon, TikTok, and retail media are the biggest winners.
- Ad blocking is a $78B problem. 42.7% of users block ads. CTV, in-app, and native formats bypass blockers and are growing fastest.
- CTV is the new battleground. $30B+ in spend, 22% growth, 95% completion rates. Streaming ad tiers are transforming TV advertising.
- Retail media is the dark horse. $62B and rising, Amazon leads but Walmart and Instacart are closing in. Commerce and advertising are merging.
- First-party data is the new currency. Cookie deprecation forces advertisers to build direct relationships. 78% are investing in first-party data now.
Sources
- GroupM — This Year, Next Year: Global Ad Forecast
- eMarketer — Global Digital Ad Spending
- Alphabet — Annual Report & Investor Relations
- Meta — Investor Relations
- Statista — Digital Advertising Outlook
- Backlinko — Ad Blocker Usage Statistics
- WordStream — Google Ads Benchmarks
- Bureau of Labor Statistics — Advertising Managers
- PageFair — Ad Blocking Report
- Leichtman Research — CTV Household Data
Frequently Asked Questions
How much is spent on advertising worldwide?
Global advertising spend surpassed $1 trillion in 2025, with the US accounting for $390 billion and China at $175 billion. Digital channels claim 73% of total spend, leaving traditional media (TV, print, radio, OOH) with the remaining 27%. The industry is growing at 7.7% annually, fueled primarily by digital ad formats.
Which company makes the most money from advertising?
Google (Alphabet) dominates with $307 billion in ad revenue, followed by Meta at $164 billion and Amazon at $56 billion. Combined, these three companies earn more than half of all global digital ad revenue. TikTok’s parent ByteDance is the fastest-growing contender at $35 billion. For broader marketing context, see our digital marketing statistics.
How effective is CTV advertising?
CTV (Connected TV) advertising is booming at $30+ billion in US spend, growing 22% year-over-year. Its main advantage is completion rates of 95%+, far exceeding digital video. With 115 million US CTV households and new ad-supported tiers from Netflix, Disney+, and Amazon Prime, the addressable audience continues to expand. CPMs are higher ($20-35) but the targeting precision and engagement justify the premium.
What percentage of people use ad blockers?
42.7% of internet users — over 912 million people — use ad blockers, costing publishers an estimated $78 billion in lost revenue annually. Gen Z has the highest adoption at 52%. The top reason for blocking is “too many ads” (48%), followed by privacy concerns (32%). Advertisers are responding by shifting to ad-blocker-resistant formats like native content, CTV, and in-app advertising.
For related data, explore our digital marketing statistics, online shopping statistics, and lead generation statistics.
Related Posts


Comments (0)