Mobile Commerce Statistics (How Many Mobile Shoppers Are There?)
These mobile commerce statistics reveal the true potential of m-commerce and why you should work on implementing it into your business.
If you aren’t, you’re likely leaving a ton of money on the table.
With the rise of mobile traffic and mobile payment applications, shopping online for products and services has never been easier.
Did you know that nearly 80% of online shoppers made at least one purchase in the last six months?
Yes, we all like the convenience of using a smartphone (or a tablet) to go online, anytime, anywhere, and do some shopping or even order food online. It’s so simple and so quick.
But find out more about how many mobile shoppers are there, m-commerce market share, shopping apps, etc., by checking the stats below.
This post covers:
- How Many Mobile Shoppers Are There?
- Mobile Commerce Market Share Stats
- Shopping Apps Statistics
- Mobile Commerce Payments & Purchases Statistics
- Other Exciting M-Commerce Statistics
Customer Experience Statistics (Our Top Picks)
- 79% of smartphone users made a purchase on their device in the last 6 months
- The mobile payment market size is expected to hit $12.06 trillion by 2027
- 21% of mobile users access shopping apps more than once daily
- AliPay is the largest mobile payment app worldwide
- Nearly 70% of shopping app users “window shop”
- 85% of shoppers abandon their cart on mobile (desktop still has better conversion rates)
- Online shopping is 5th most popular smartphone internet activity
How Many Mobile Shoppers Are There?
While we don’t have the exact number of how many mobile shoppers are there, research found that at least 79% of smartphone users made a purchase using their device (in the last six months).
If we say there are 6.8 billion smartphone users (subscriptions) out there, that gives us a REALLY ROUGH estimate of 5.3 billion mobile shoppers.
The final number is likely a lot lower because many use two mobile devices, then there are business phones and finally, those who don’t have a subscription but use pre-paid.
According to Business Of Apps, there were 2.1 billion mobile payment app users worldwide, which is 300 million more than the year before.
Luckily, we have a more accurate number of mobile shoppers in the United States.
How Many Mobile Shoppers Are In The US?
According to Statista, around 187+ million people in the US will make at least one purchase using their mobile device in 2024. As a reference, there were 167.8 million mobile shoppers in the US in 2020.
How Many Mobile Shoppers Are Around The World?

Note that the numbers in the table below are estimated calculations from different resources. Meaning they may vary quite a bit compared to the actual mobile shoppers of each country.
| Country | Number of mobile shoppers |
| China | 905 million |
| Brazil | 88.7 million |
| Japan | 78.1 million |
| Mexico | 56.3 million |
| France | 41.8 million |
| Germany | 39.7 million |
| UK | 35.9 million |
| Canada | 29 million |
| Australia | 23.1 million |
| Spain | 18 million |
One of the biggest reasons for deviation may be due to users using two or more mobile devices to shop online.
Source: OuterBox, Statista #1, Statista #2, Business Of Apps
Mobile Commerce Market Share Stats
A projection set for the mobile payment market size is to hit $12.06 trillion by 2027. It’s continuously rising, with a compound annual growth rate of 30.1% from 2020 to 2027.
Two of the reasons for the growth are 1) there are more and more mobile users each year and 2) online payments are becoming increasingly convenient (Paypal, Apple Pay, Amazon Pay, etc.).
In 2023, it’s expected that there will be 1.31 billion users worldwide who will use their smartphones to make online transactions. (Unfortunately, stats on how many mobile shoppers are globally vary significantly.)
Source: Allied Market Research, Statista
Mobile Commerce Around The World
The United States
2022 has seen one of the most significant jumps in mobile spending in the United States compared to 2019 (before the pandemic) – $387+ billion. Surprisingly, desktops and tablets still have better conversion rates compared to smartphones in the US.
Fun fact: Walmart has the largest mobile shopping app in terms of active monthly users (120 million). Amazon’s app is on the second place with 98 million users.
Italy
Italy’s mobile commerce market share was valued at almost 22€ billion in 2021, which is approximately $23.9 billion.
M-commerce accounts for almost 50% of all eCommerce in Italy, being one of the critical factors for retailers nationwide.
United Kingdom
The UK’s m-commerce market share is predicted to grow to over 100 billion British pounds (approx. $123.7 billion) by 2024.
Traffic-wise, 70% of all online traffic to retail websites is mobile. However, desktop traffic is still more profitable due to better conversion rates (like in the US).
One of the main reasons desktop performs better than mobile in conversions is screen size. Just like smartphones with larger screen perform better than those with smaller displays.
Source: Statista #1, Statista #2, Statista #3, Statista #4
Shopping Apps Statistics
21% of mobile users access shopping apps more than once daily
In fact, this percentage of device users access applications multiple times daily (that would be more than twice!). In addition to that, 35% of users access these same shopping apps numerous times a week.
Source: Criteo
49% of Americans use shopping apps to compare prices
If you thought, “Why would I want to access a shopping app so often?” one of the reasons is price comparison. Nearly half of Americans use shopping applications to compare prices before purchasing.
Source: Criteo
Shopping app downloads were on the rise during the peak of the COVID-19 pandemic
With the various global limitations, people tend to pick up their mobile devices more frequently to shop online. In the US alone, 51% of users downloaded at least one shopping application on their smartphone during that period.
Source: Criteo
43+ million American use Apple Pay

Apple Pay is by far the most widespread payment application in the United States, followed by Starbucks in second and Google Pay in third place.
| Mobile payment service | Number of users |
| Apple Pay | 43.9 million |
| Starbucks | 31.2 million |
| Google Pay | 25 million |
| Samsung Pay | 16.3 million |
Source: Business Of Apps
But AliPay is the largest mobile payment app worldwide

With 650 million users, AliPay is the leading mobile payment service globally, followed by WeChat Pay (550 million), Apple Pay (507 million), Google Pay (421 million), PayPal (377 million) and Paytm (333 million).
Samsung Pay is in eighth place with 140 million users.
Source: Business Of Apps
67% of online shoppers downloaded a retailer’s app
Can you guess what the number one reason why more than half of those 67% of consumers downloaded the application is? If you guessed coupons and discounts, you guessed it right.
Luckily, those aren’t lost customers because over half of them use the retailer’s app for purchases.
Source: Synchrony
Nearly 70% of shopping app users “window shop”
Not all shopping application users are buyers. As it turns out, 67% of them use the application for digital window shopping – just for fun (these users tend to spend quite a considerable time on shopping apps).
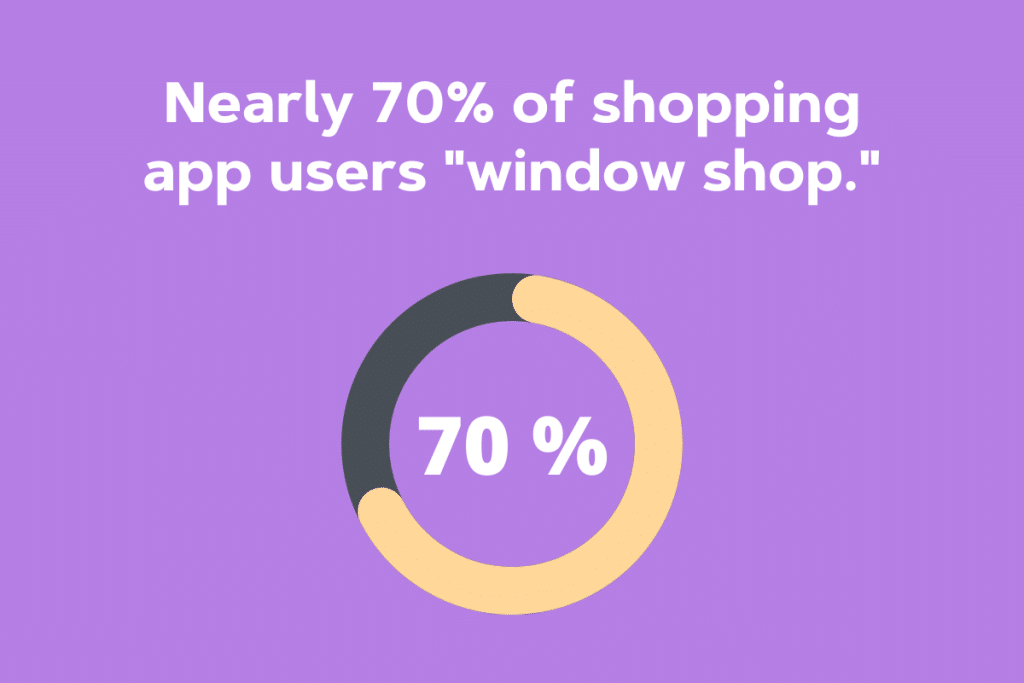
Interestingly, 77% of digital window shoppers perform impulsive purchases when they decide to open their wallets.
Source: Ragtrader
Help them find answers, and 69% will likely make a purchase
Everyone seeking answers wants to find them as fast and easily as possible (mobile users, in particular, are very impatient).
And if a brand meets consumers’ expectations via its mobile website or application, nearly seventy percent of them are inclined to buy.
Additionally, a brand increases its chance of getting more users to purchase from them with instructional video content.
Source: Think With Google
18 billion hours spent in shopping apps globally
If you think the number is huge, that’s just on Android devices. And it’s from 2018 because we couldn’t find any newer stat.
Just try to imagine how many more billions of hours people spend just browsing shopping applications on their devices today.
Source: Insider Intelligence
Mobile Commerce Payments & Purchases Statistics
While we already covered some of the interesting stats above, here are more for you to know about.
58% of mobile phone users favor quick purchases
You don’t want to waste a smartphone user’s time. Consider it law. If your website loads slowly or the checkout process requires too much stuff to fill out, you’re probably losing a lot of customers.
Almost 60% of smartphone users say they’re more prone to buy from a brand with an optimized mobile website or application for quick purchases.
Source: Think With Google
Approx. 4 out 5 Americans shop online, more than half using mobile devices
The percentage of online shoppers is high in the United States. The Pew Research Center found that nearly four out of five Americans are online shoppers. On top of that, more than 50% of them use a mobile device to complete their orders.
Source: Pew Research Center
The mobile payments market size is on a rapid growth
The predicted growth of mobile payments is 29.5% between 2022 and 2027, thanks to the convenience of mobile payment apps, not just the ones available but also all the new ones popping up.
The largest mobile payment market is North America, but the fastest growing in the Asia Pacific.
Source: Mordor Intelligence
85% cart abandonment on mobile
As we’ve already learned, conversion rates are lower on mobile than they are on desktop.
Moreover, on average, mobile experiences a whopping 85.65% cart abandonment rate – these are transactions without a sale. (Desktop has a 73.07% and tablet 80.74% shopping cart abandonment rate.)
Source: Barilliance
56% buy on their mobile device because they are already using it
Who even switches devices anymore when the hype is real and the purchase needs to be done – now? (I do.)
Okay, joke aside, 56% say they completed a purchase on their mobile device solely because they were already using it. A few clicks, and you’re done.
What’s more, 56% report that they prefer to pay for their goods on a mobile device because it’s a lot more convenient – they can do it whenever they want, at home, on the go, at a restaurant, or while watching TV at night.
Source: Facebook IQ
Other Exciting M-Commerce Statistics
Mobile commerce is expected to hit almost $4.5 trillion by 2024
M-commerce is becoming increasingly popular, to the point of expected generated total sales to reach nearly $4.5 trillion by 2024.
What’s even more interesting is that this is nearly 70% of all retail eCommerce sales. This just shows that consumers worldwide prefer using their mobile devices to shop and pay online.
Source: Insider Intelligence
Only 28% plan to use a desktop computer/laptop for shopping
A survey from Marketing Dive found that only 28% of consumers plan to use a desktop device to do shopping, and only 16% use a tablet. Smartphones are the most preferred way of online shopping for 56% (of North Americans).
Source: Marketing Dive
Even when in-store shopping, 61% still use their smartphones
While this isn’t necessarily connected to mobile commerce, we still found it interesting.
The three main reasons why using a mobile device in-store for 61% is researching competitor prices (55%), registering for a discount (46%) and taking a picture for future reference (45%).
Source: Marketing Dive
What about social commerce?
34% of US users made a purchase through social media, while 27% are interested in social shopping. The most popular age group to shop through social media is between 18 and 34. Additionally, women (42%) like to use social networks for shopping nearly twice as more as men (26%).
Note that social commerce is one of the most popular retail techs among US users.
Source: Marketing Dive
48% are OK if a company uses their purchase history for sending recommendations to mobile phone
Are you OK if a company uses your purchase history to send you recommendations based on it directly to your mobile phone?
48% of the US consumers are, for as long as they have complete freedom to opt-in and out when they want.
41% say that they’re fine with those promotions if the offers are relevant to them (or their purchase history).
But 11% are not OK with this type of marketing approach.
Source: Statista
76% of loyalty program members prefer to communicate with their favorite brand via SMS
When someone sign-ups for SMS, they actually want to receive a brand’s messages. In fact, 71% who opt-in want to chat with their fav brand(s) via SMS.
Also, 57% of consumers prefer opting for SMS messages over email because it makes them know about new promotions and updates quicker.
SMS communication and mobile commerce go hand in hand extremely well, so if you’re not yet using SMS, consider testing it.
Source: Yotpo
45% of users said they’d prefer if mobile apps had a voice assistant
Even though this isn’t directly connected to m-commerce, it shows that a large percentage of mobile users would enjoy it if their favorite application had a voice assistant.
If you’re not using it for your mobile shopping app yet, this might just be a huge opportunity for your business.
Source: Voicebot
Online shopping is 5th most popular smartphone internet activity
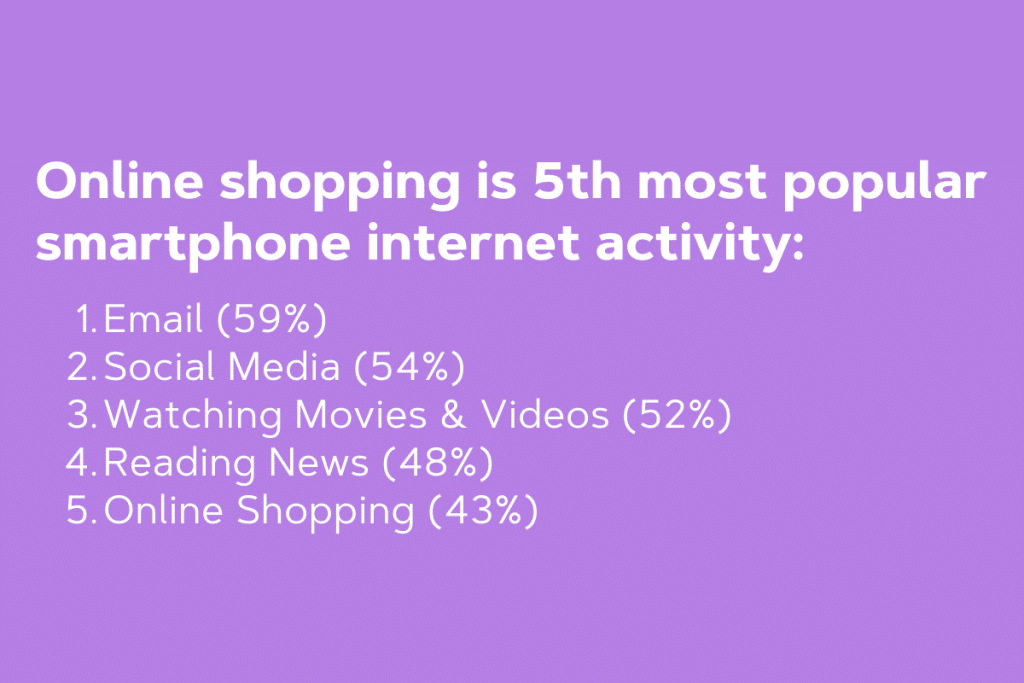
First is email (59%), second is accessing social media (54%), third is watching movies and videos (52%), fourth is reading the news (48%) and fifth is online shopping (43%).
(Users use their smartphones considerably more for online activities than tablets.)
Source: Statista
29%+ global users make weekly purchases using their mobile device
There are nearly one-third of consumers worldwide who use their mobile device to buy at least one thing (product or service) every week. The largest percentage of weekly buyers is in South Korea, more than 44%.
Source: Statista
40% of consumers will leave a page that’s loading 3+ seconds
Page loading speed is especially crucial in mobile commerce because a business loses (a lot of) conversions/sales every second longer its website loads.
40% of consumers will leave a website that takes more than three seconds to load. So if your industry average is 4, 5 or more seconds, there’s a massive opportunity for your business to grow – just by speeding up your website.
Source: Think With Google
But check these interesting site speed stats for more on performance.
Final Words
Businesses worldwide are investing more and more budget in mobile commerce.
Some are joining the bandwagon, some are improving it and some spend figuring out new marketing ways exclusive to mobile commerce.
While there will be more and more mobile device users worldwide each year, it means there will be more online shoppers.
Offer an experience like no other so users find the right products and services and complete payment with as little effort as possible.
And these mobile commerce statistics are great proof that it’s worth paying more attention to mobile shoppers.



This Post Has 0 Comments