

40+ UX Statistics: ROI, Design Impact & Career Data (2026)
Every $1 invested in UX is often said to return $100 (a 9,900% ROI, attributed to Forrester), 88% of users say they are less likely to return after a bad experience, and visitors judge a site’s visual appeal in about 50 milliseconds. With Figma’s revenue passing $1 billion in 2025 and designers using Figma 46 times as often as Sketch for UI work, user experience has evolved from a nice-to-have into a fundamental business requirement. Here are 40+ UX statistics covering ROI, user behavior, design tools, careers, and market trends for 2026.
Key UX Statistics (2026)
- $1 UX investment = $100 return (9,900% ROI), an often-quoted figure (Forrester, 2016)
- 88% of users are less likely to return after a bad UX (UXCam)
- Top-quartile design companies grew revenue 32 points faster than peers over five years (McKinsey, 2018)
- Figma revenue: $1.06 billion in 2025, up 41% (Figma SEC filings)
- 94% of the reasons people gave for mistrusting health websites were design-related (Northumbria University, 2004)
- Designers use Figma 46x as often as Sketch for UI design (UX Tools 2024 survey)
- Users judge visual appeal in about 50 milliseconds (Behaviour & Information Technology, 2006)
UX ROI & Business Impact
| Metric | Value | Source |
|---|---|---|
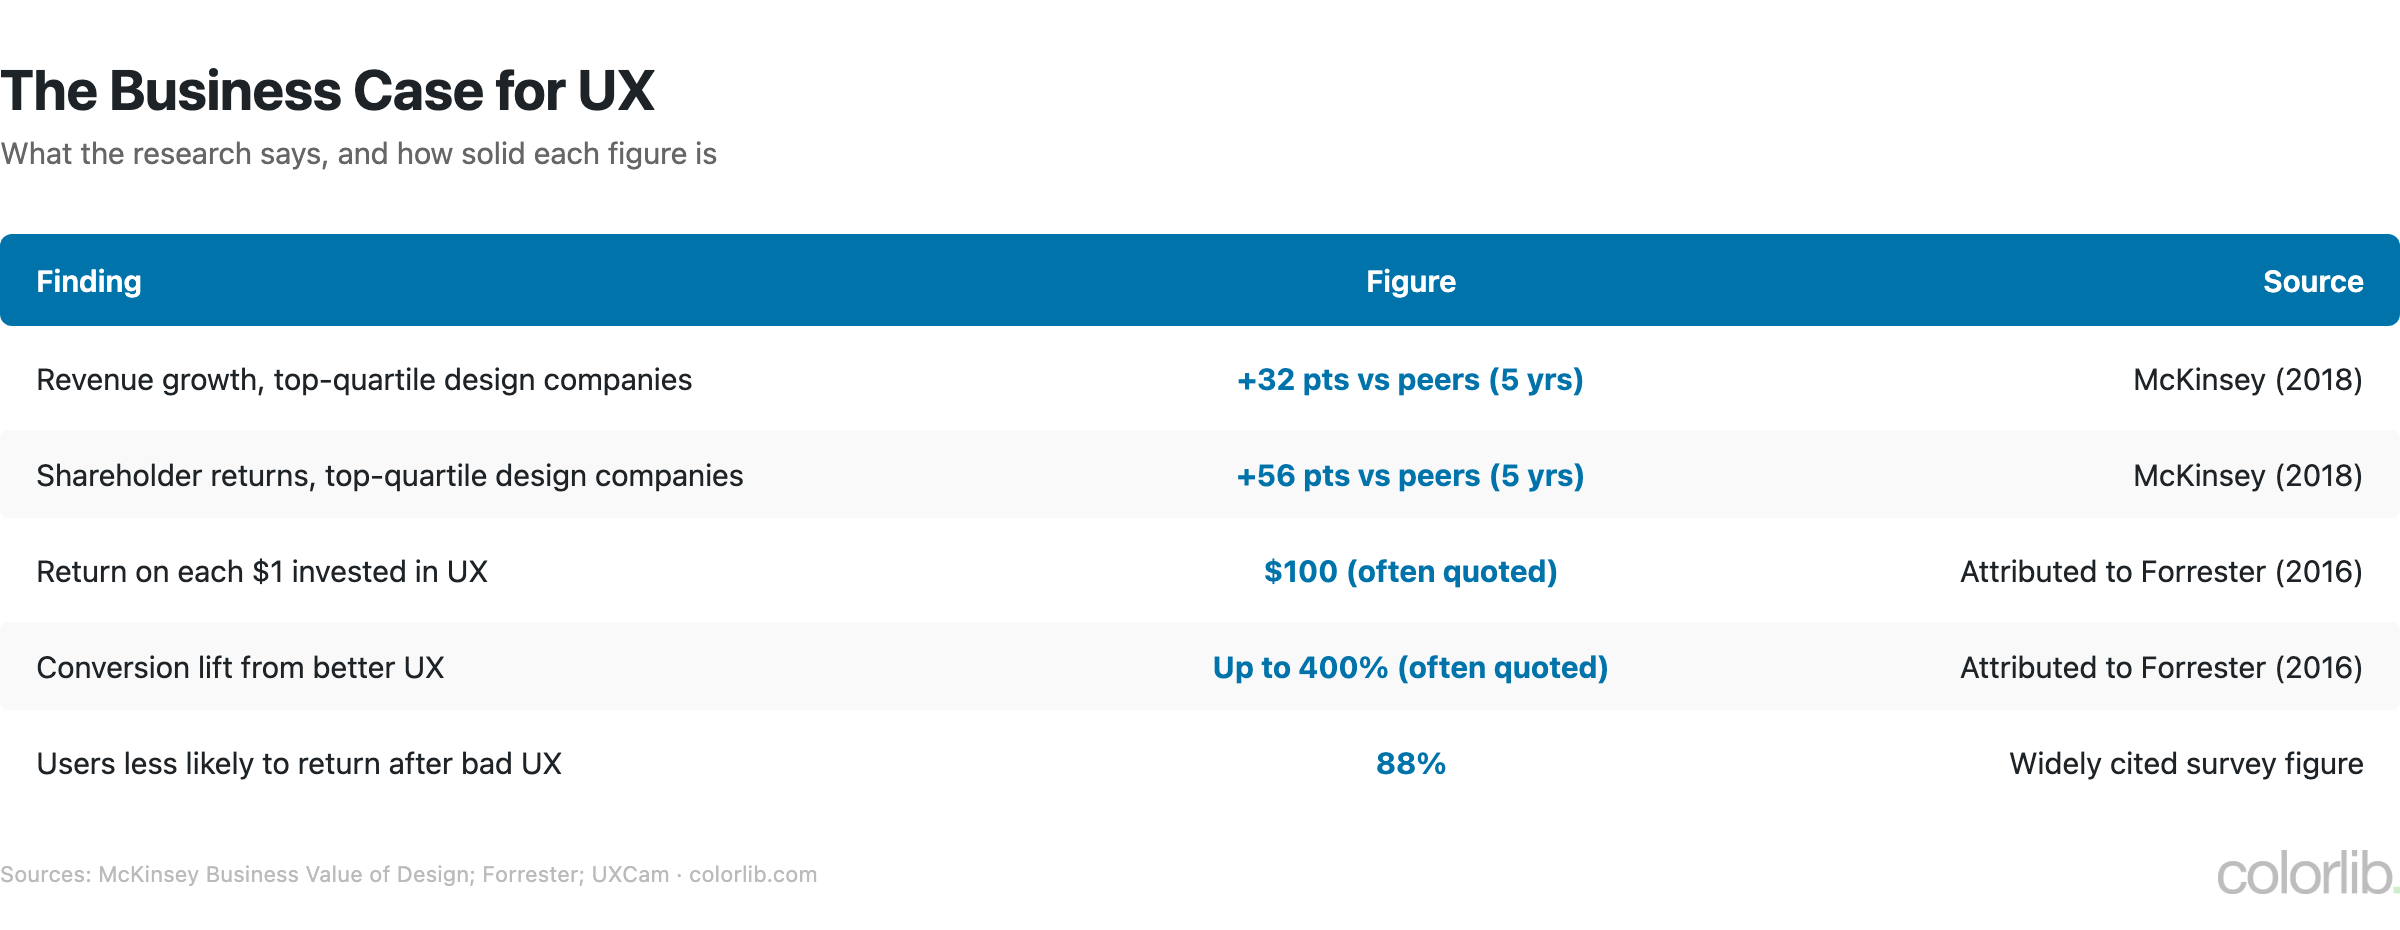
| ROI of UX investment (often quoted) | 9,900% ($1 → $100) | Forrester (2016, attributed) |
| Users less likely to return after bad UX | 88% | UXCam |
| Conversion lift from good UX (often quoted) | Up to 200% (UI) / 400% (UX) | Forrester (2016, attributed) |
| Revenue growth, top-quartile design companies | +32 points vs. peers over 5 years | McKinsey |
| Shareholder returns, top-quartile design companies | +56 points vs. peers over 5 years | McKinsey |
- An often-quoted figure attributed to Forrester’s 2016 report holds that every $1 invested in UX returns $100 — a 9,900% ROI; the full report is paywalled, so treat the number as directional
- McKinsey’s 2018 Business Value of Design study of 300 public companies found top-quartile design performers grew revenue 32 percentage points faster and shareholder returns 56 points faster than industry peers over five years
- The same Forrester research is quoted as saying a better UI can raise conversion rates by up to 200% and better UX by up to 400%, while 88% of users say they are less likely to return after a bad experience
- For how design impacts website performance, see our web design statistics report
UX Design Market Size
| Metric | Value | Source |
|---|---|---|
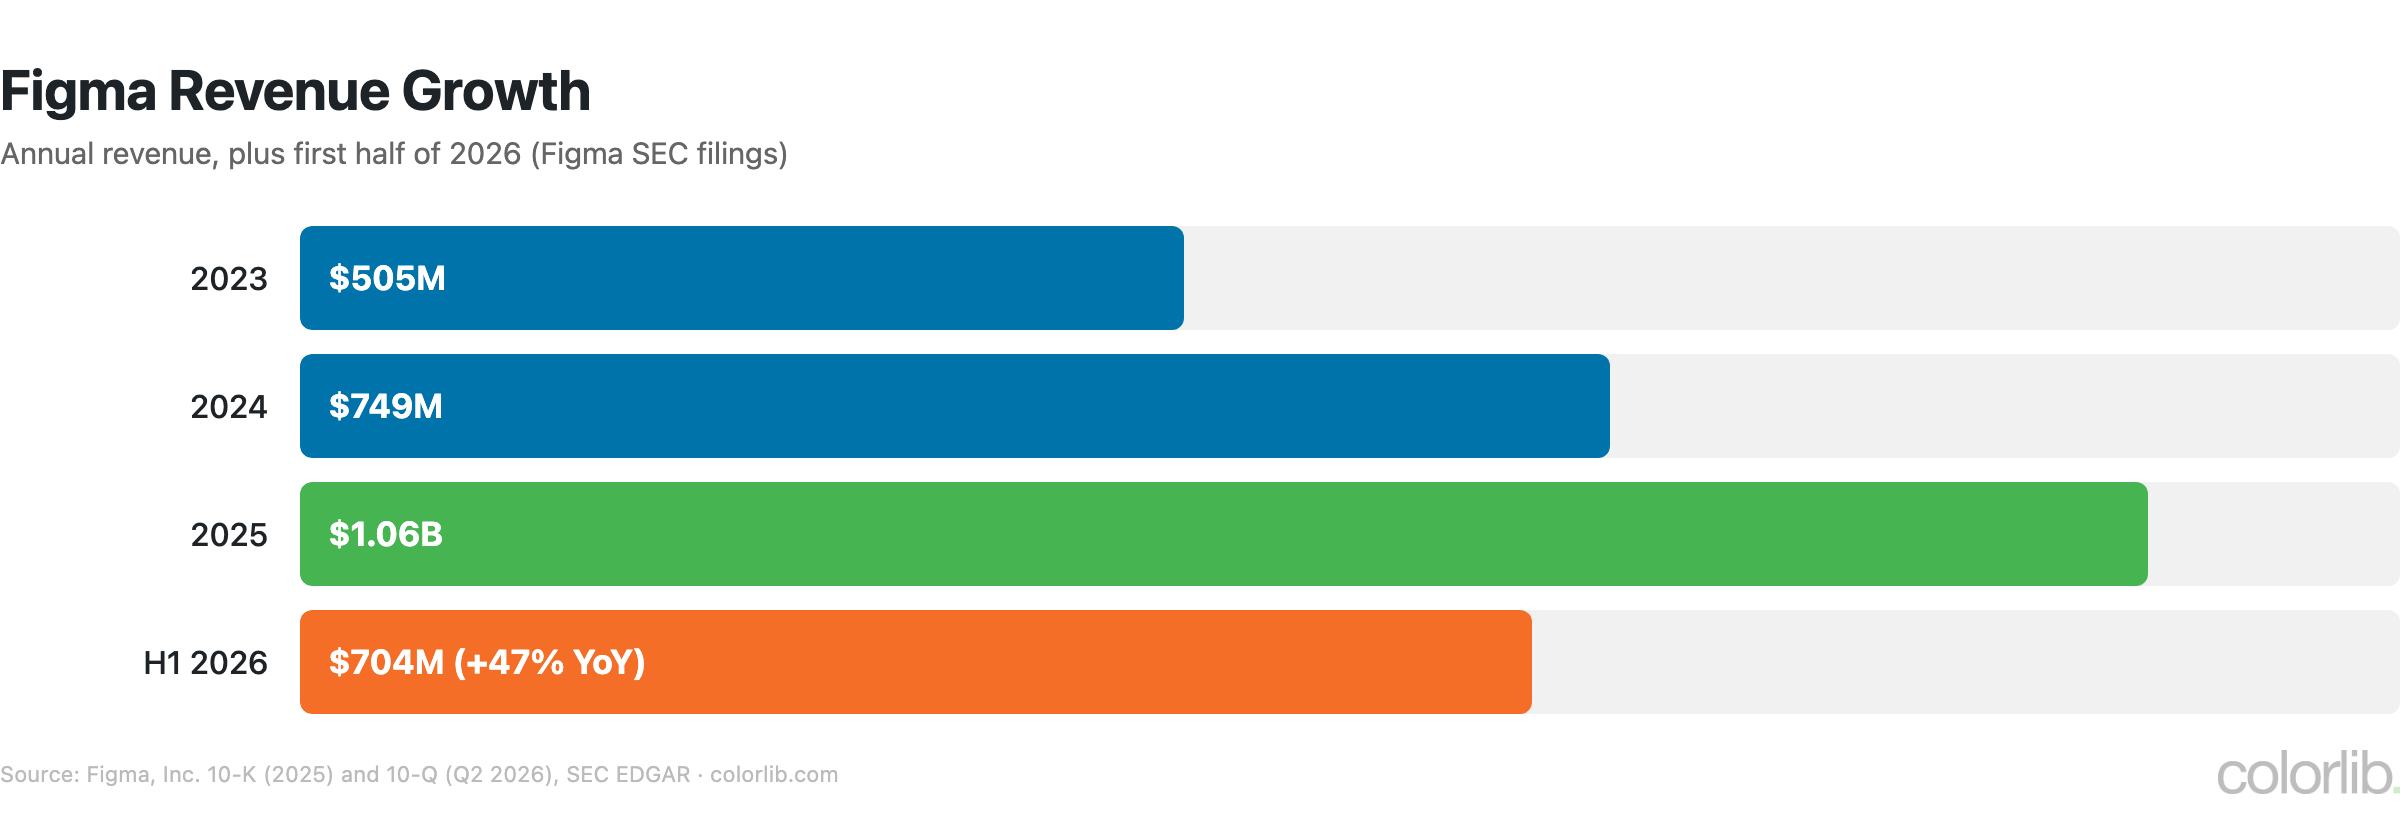
| Figma revenue (2025) | $1.06 billion (+41%) | Figma SEC filings |
| Figma revenue (Q2 2026) | $370.1 million (+48% YoY) | Figma SEC filings |
| Figma revenue (2023) | $504.9 million | Figma SEC filings |
| Figma share of design-system management | 59.2% | UX Tools 2024 |
| Designers changing tools because of their organization | 86.7% report org-driven tool choices | UX Tools 2024 |
- Figma’s revenue grew 41% to $1.06 billion in 2025 and 48% year over year to $370.1 million in Q2 2026, more than doubling from $505 million in 2023
- In design systems, Figma holds a 59.2% share of design-system management in the UX Tools 2024 survey, far ahead of Storybook (2.4%) and Zeroheight (1.6%)
- Tool choice is often not the designer’s: 86.7% of designers in the UX Tools 2024 survey report changing tools because of their organization, which reinforces dominant platforms
User Behavior Statistics
| Metric | Value | Source |
|---|---|---|
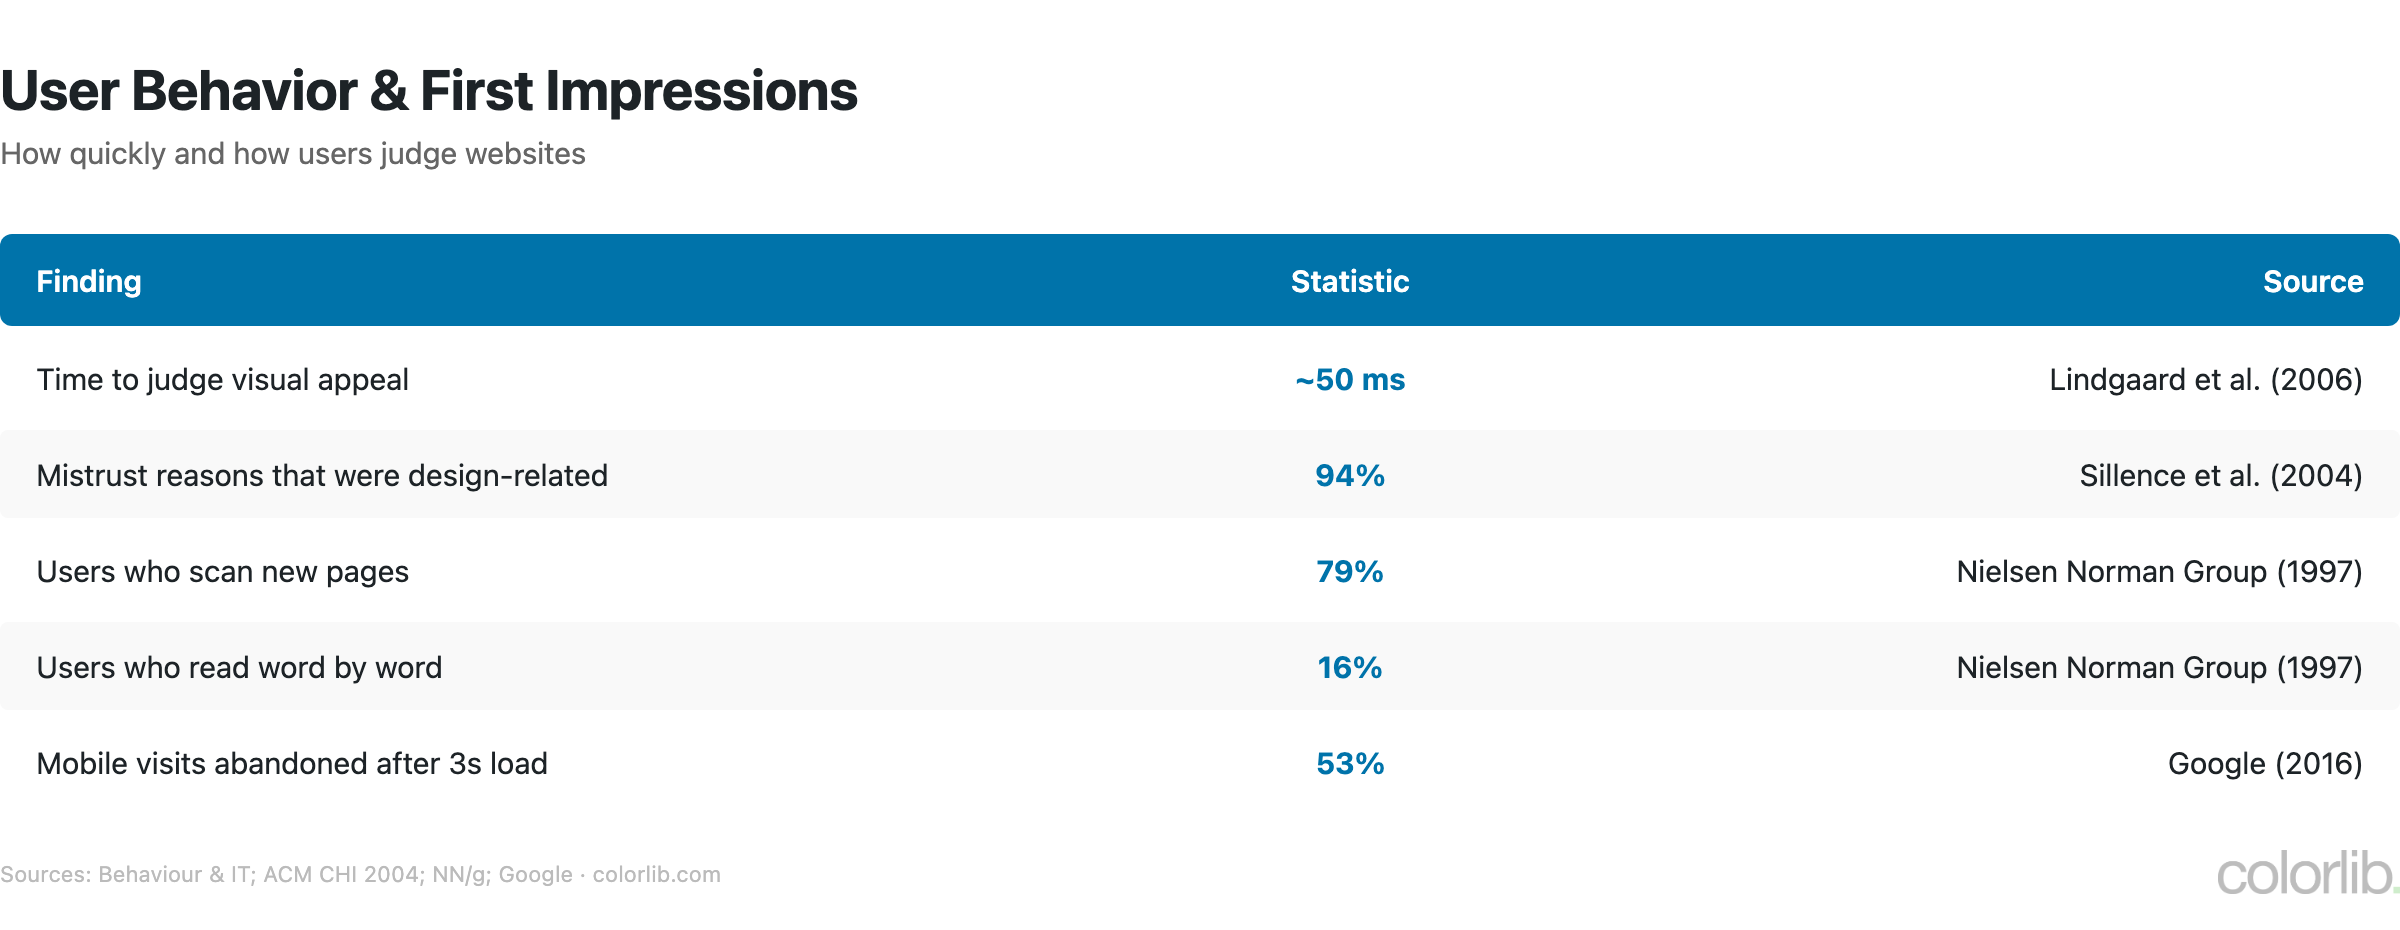
| Time to judge a website’s visual appeal | ~50 milliseconds | Lindgaard et al. (2006) |
| Mistrust reasons that were design-related | 94% | Sillence et al. (2004) |
| Professional design and credibility | Professional-looking sites judged more credible | Stanford-Makovsky (2002) |
| Users who read pages word by word | Only 16% | NNG (1997) |
| Users who scan rather than read | 79% | NNG (1997) |
- Users judge a website’s visual appeal in about 50 milliseconds, and in a Northumbria University study of health websites, 94% of the reasons people gave for rejecting or mistrusting a site were about design rather than content
- In the Stanford-Makovsky Web Credibility Study (2002), participants said they were more likely to believe websites that looked professionally designed and visually appropriate to their subject — poor design erodes trust before content is even consumed
- 79% of users scanned web pages rather than reading word by word in Nielsen Norman Group’s classic 1997 study, and only 16% read word by word — content hierarchy and visual design are critical
UX Design Tools Statistics
| Tool | UX Tools 2024 Survey | Market Position |
|---|---|---|
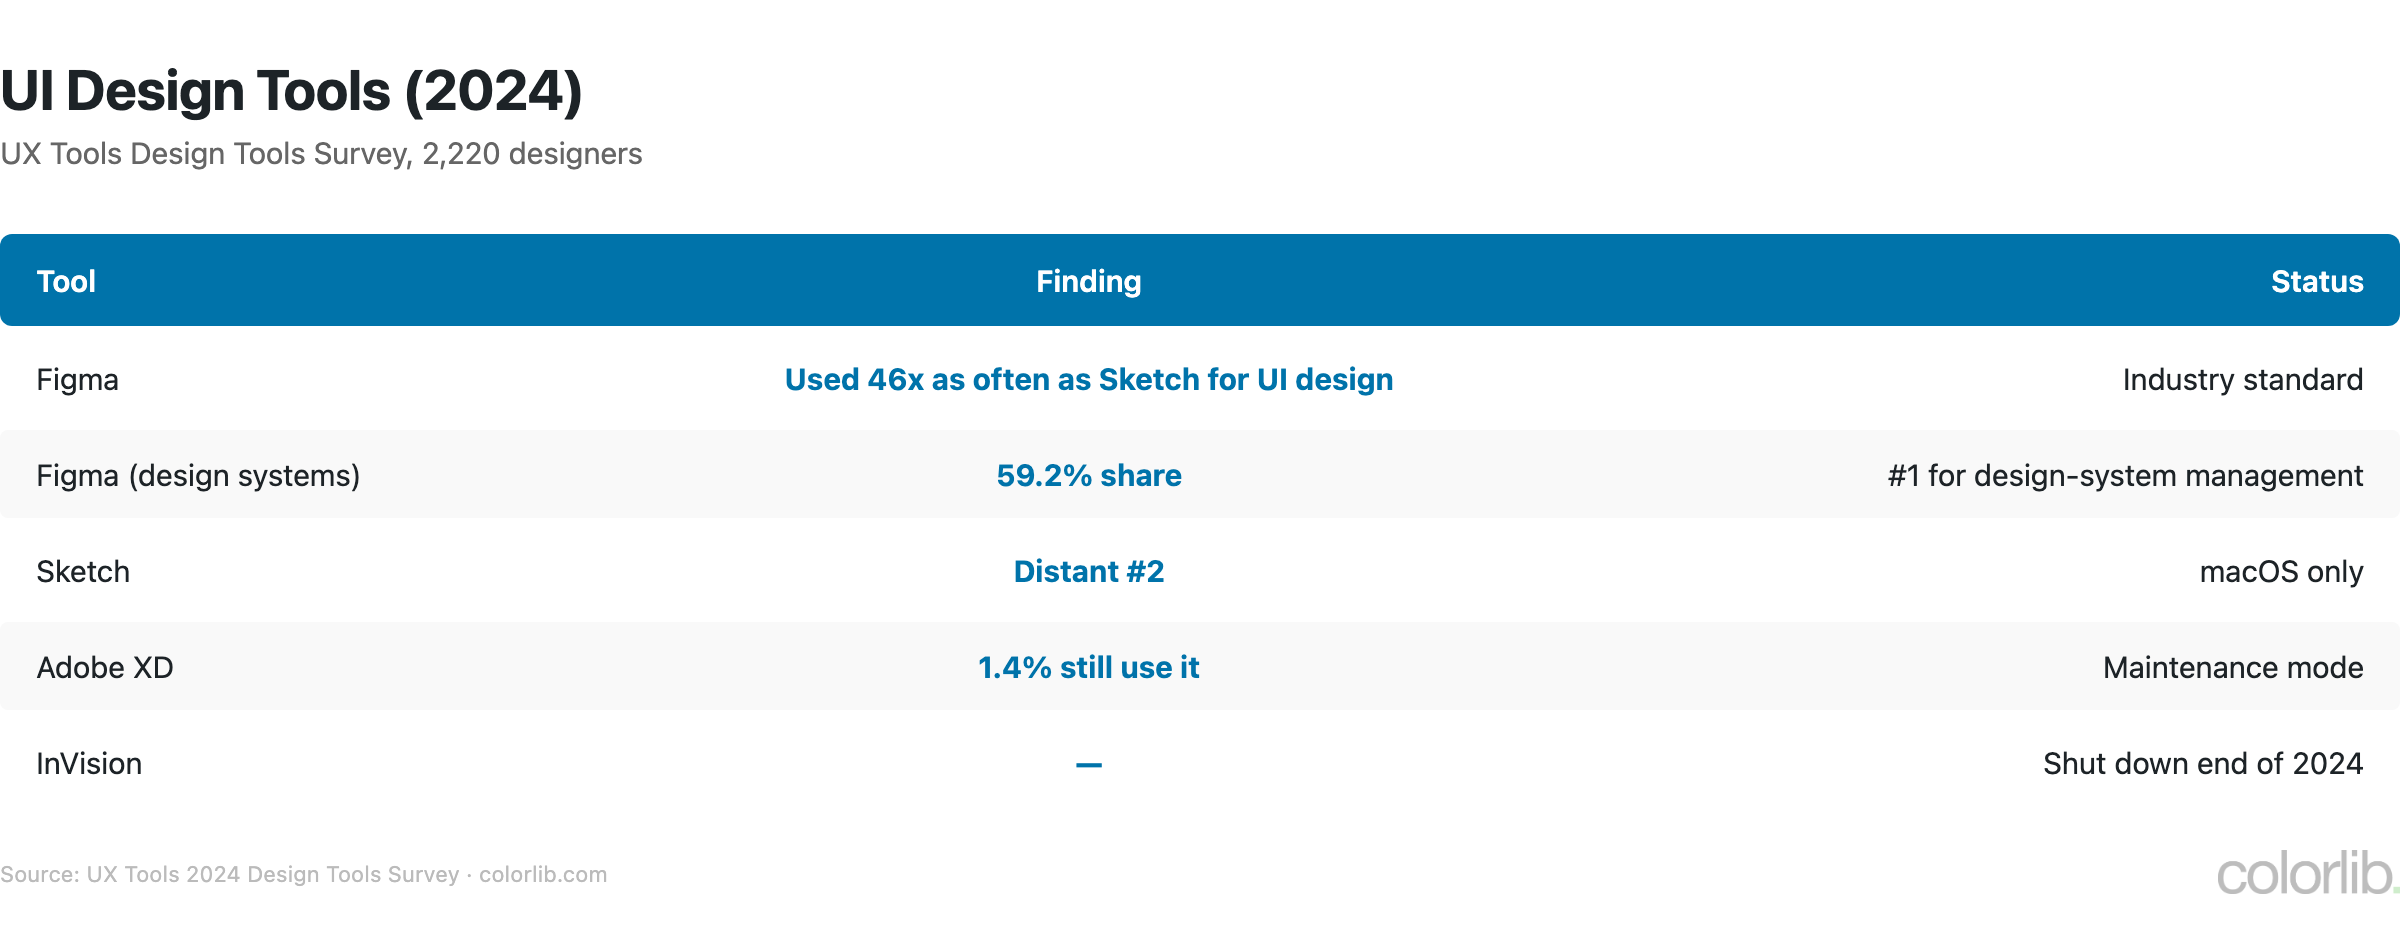
| Figma | 46:1 usage vs. Sketch for UI design | #1 — industry standard |
| Sketch | Distant #2 for UI design | Declining (macOS only) |
| Adobe XD | 1.4% still use it | Maintenance mode, no longer sold standalone |
| Framer | Top 10 UI design tool | Growing — design + code |
| Penpot | Top 10 UI design tool | Open-source alternative |
| InVision | — | Shut down at the end of 2024 |
- Figma is used 46 times as often as Sketch for UI design in the UX Tools 2024 survey, cementing its position as the industry-standard design tool
- Adobe XD is in maintenance mode and no longer sold as a standalone app, and Adobe’s planned $20 billion acquisition of Figma was abandoned in December 2023; only 1.4% of designers still reported using XD
- Sketch has fallen far behind, limited by its macOS-only availability in an increasingly cross-platform industry
- Framer and Webflow are growing as tools that blur the line between design and development, appealing to designers who want to ship
- For broader design industry trends, see our graphic design statistics and website color statistics reports
UX Career Statistics
| Metric | Value | Source |
|---|---|---|
| Median pay, web & digital interface designers (May 2025) | $104,000 | BLS |
| Median pay, web developers (May 2025) | $92,650 | BLS |
| Jobs, web developers & digital designers (2025) | 220,100 | BLS |
| Job growth (2025-2035) | +5% (faster than average) | BLS |
| Annual job openings | ~13,600 | BLS |
| Designers using AI in design tools | 77.6% of ICs, 85.2% of leaders | UX Tools 2024 |
- Web and digital interface designers earned a median of $104,000 in May 2025, above the $92,650 median for web developers (BLS)
- BLS projects employment of web developers and digital designers to grow 5% from 2025 to 2035, faster than the average for all occupations, with about 13,600 openings a year
- AI is augmenting rather than replacing UX roles: 77.6% of individual-contributor designers and 85.2% of design leaders in the UX Tools 2024 survey use AI in their design tools, mostly for text-based tasks
Key Takeaways
- UX pays off. The often-quoted $1-to-$100 return is attributed to Forrester, and McKinsey found top-quartile design companies grew revenue 32 percentage points faster than peers over five years.
- First impressions are design-driven. Users judge visual appeal in about 50 milliseconds, and design drove 94% of the reasons people mistrusted health sites in one study. You have one chance to earn trust.
- Design tooling is booming. Figma’s revenue passed $1 billion in 2025, up 41%, and grew 48% year over year in Q2 2026.
- Figma is the undisputed industry standard. Used 46x as often as Sketch for UI design, Figma has effectively won the design tool war, with Adobe XD in maintenance mode and InVision shut down.
- UX careers pay well. Web and digital interface designers earn a $104,000 median (May 2025), and BLS projects 5% growth for the wider field through 2035.
- Bad UX has compounding costs. 88% of users say they are less likely to return after a bad experience, and most users scan rather than read, so unclear pages lose people fast. Poor UX doesn’t just lose sales — it damages brand reputation.
Sources
- Forrester — The Six Steps For Justifying Better UX (2016)
- Nielsen Norman Group — How Users Read on the Web
- Lindgaard et al. — Attention Web Designers: You Have 50 Milliseconds (2006)
- Sillence et al. — Trust and Mistrust of Online Health Sites (2004)
- McKinsey — The Business Value of Design
- UX Tools — 2024 Design Tools Survey
- Stanford-Makovsky Web Credibility Study (2002)
- Bureau of Labor Statistics — Web Developers and Digital Designers
- Figma, Inc. — SEC Filings
Frequently Asked Questions
What is the ROI of UX design?
An often-quoted figure attributed to Forrester’s 2016 research holds that every $1 invested in UX returns $100, a 9,900% ROI, with a better UI lifting conversion by up to 200% and better UX by up to 400%. The full report is paywalled, so treat these as directional. McKinsey’s 2018 study of 300 public companies is more concrete: top-quartile design performers grew revenue 32 percentage points faster and shareholder returns 56 points faster than industry peers over five years.
How fast do users judge a website?
Users judge a website’s visual appeal in about 50 milliseconds (Lindgaard et al., 2006), and in a 2004 Northumbria University study of health websites, 94% of the reasons people gave for rejecting or mistrusting a site were design-related rather than content-related. The Stanford-Makovsky Web Credibility Study also found people more likely to believe sites that look professionally designed. This means visual design, layout, and branding must be professional and polished before any content strategy can be effective. For design best practices, see our web design statistics and website color statistics reports.
How much do UX designers earn?
US web and digital interface designers earned a median of $104,000 in May 2025, according to the Bureau of Labor Statistics. The BLS projects 5% growth for web developers and digital designers from 2025 to 2035, faster than the average for all occupations. Figma proficiency is close to mandatory: designers use it 46 times as often as Sketch for UI work.
Which UX design tools do designers use most?
Figma, by a wide margin. The UX Tools 2024 survey of 2,220 designers found Figma used 46 times as often as Sketch for UI design, and it holds a 59.2% share of design-system management. Adobe XD is in maintenance mode, and InVision shut down at the end of 2024. Framer and the open-source Penpot round out the top 10 UI design tools. For related design trends, see our graphic design statistics report.

Related Posts






Comments (0)