
60+ Social Media Statistics: Users, Platforms & Trends (2026)
DataReportal counted 5.79 billion social media user identities in April 2026, equal to 69.9% of the global population. The typical user spends about 18 and a half hours a week on social platforms, Meta’s apps reached 3.6 billion daily active people in June 2026, and Statista projects social media ad spending of $339 billion in 2026. From TikTok’s dominance in short-form video to the rise of social commerce, here are 60+ social media statistics for 2026.
Key Social Media Statistics (2026)
- 5.79 billion social media user identities in April 2026, 69.9% of the global population (DataReportal)
- Average time on social media: 18 hours 36 minutes a week, more than 2.5 hours a day (DataReportal)
- Meta’s apps: 3.6 billion daily active people in June 2026, with Facebook, Instagram and WhatsApp each above 3 billion monthly users (Meta)
- Social media ad spend: $339 billion projected for 2026 (Statista)
- US social commerce sales: $85+ billion in 2025, on track to pass $100 billion in 2026 (eMarketer)
- 70% of marketers use Instagram, the most-used platform among marketers (HubSpot)
- Short-form video is the #1 content format for ROI, named by 49% of marketers (HubSpot)
Global Social Media Usage
| Metric | Value | Source |
|---|---|---|
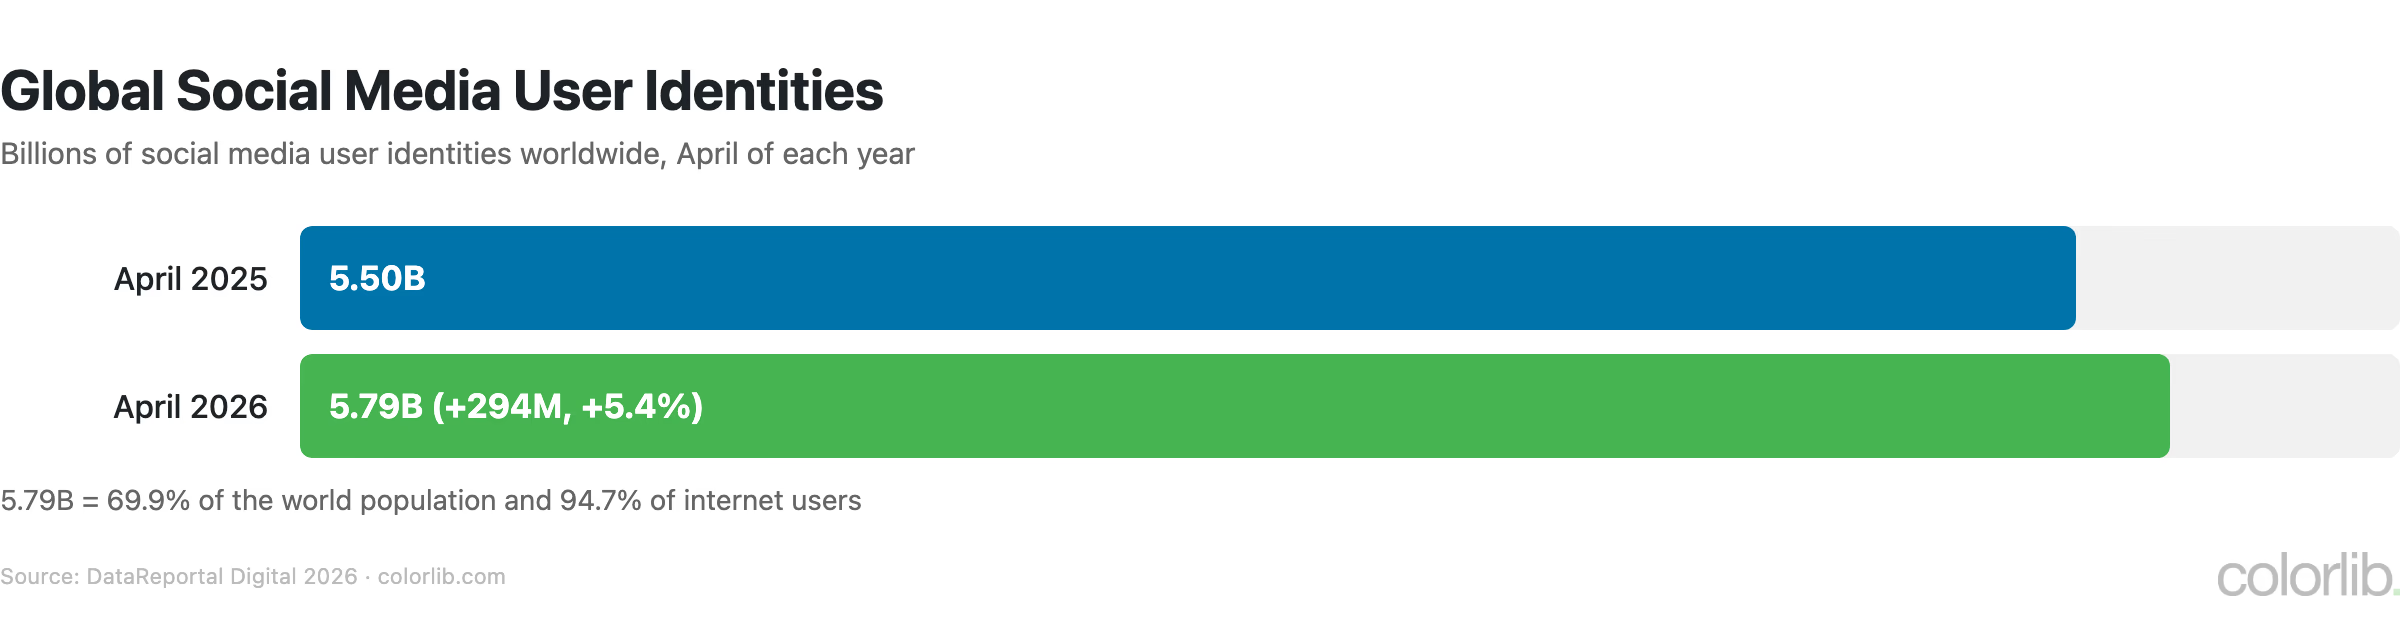
| Social media user identities (April 2026) | 5.79 billion | DataReportal |
| Percentage of world population | 69.9% | DataReportal |
| Internet users who use social media | 94.7% | DataReportal |
| New users per day (average, past 12 months) | 800,000+ | DataReportal |
| Average time on social per week | 18h 36m | DataReportal |
| Average number of platforms used per month | 6.5 | DataReportal |
| YoY growth in social user identities | +5.4% | DataReportal |
- 5.79 billion user identities were active on social media in April 2026, up 294 million in a year. That works out to more than 800,000 new users every day
- The average person uses 6.5 different social platforms per month, reflecting fragmentation rather than loyalty to a single platform
- Social media time averages 18 hours 36 minutes a week, or more than 2.5 hours a day once video platforms are included, and collectively the world spends more than 15 billion hours a day on social content
- Women aged 16 to 24 spend the most time on social media at 25 hours 45 minutes a week (more than 3.5 hours a day), and even users aged 65+ average over an hour a day
Platform Statistics
| Platform | Users (latest reported) | Key Demographic |
|---|---|---|
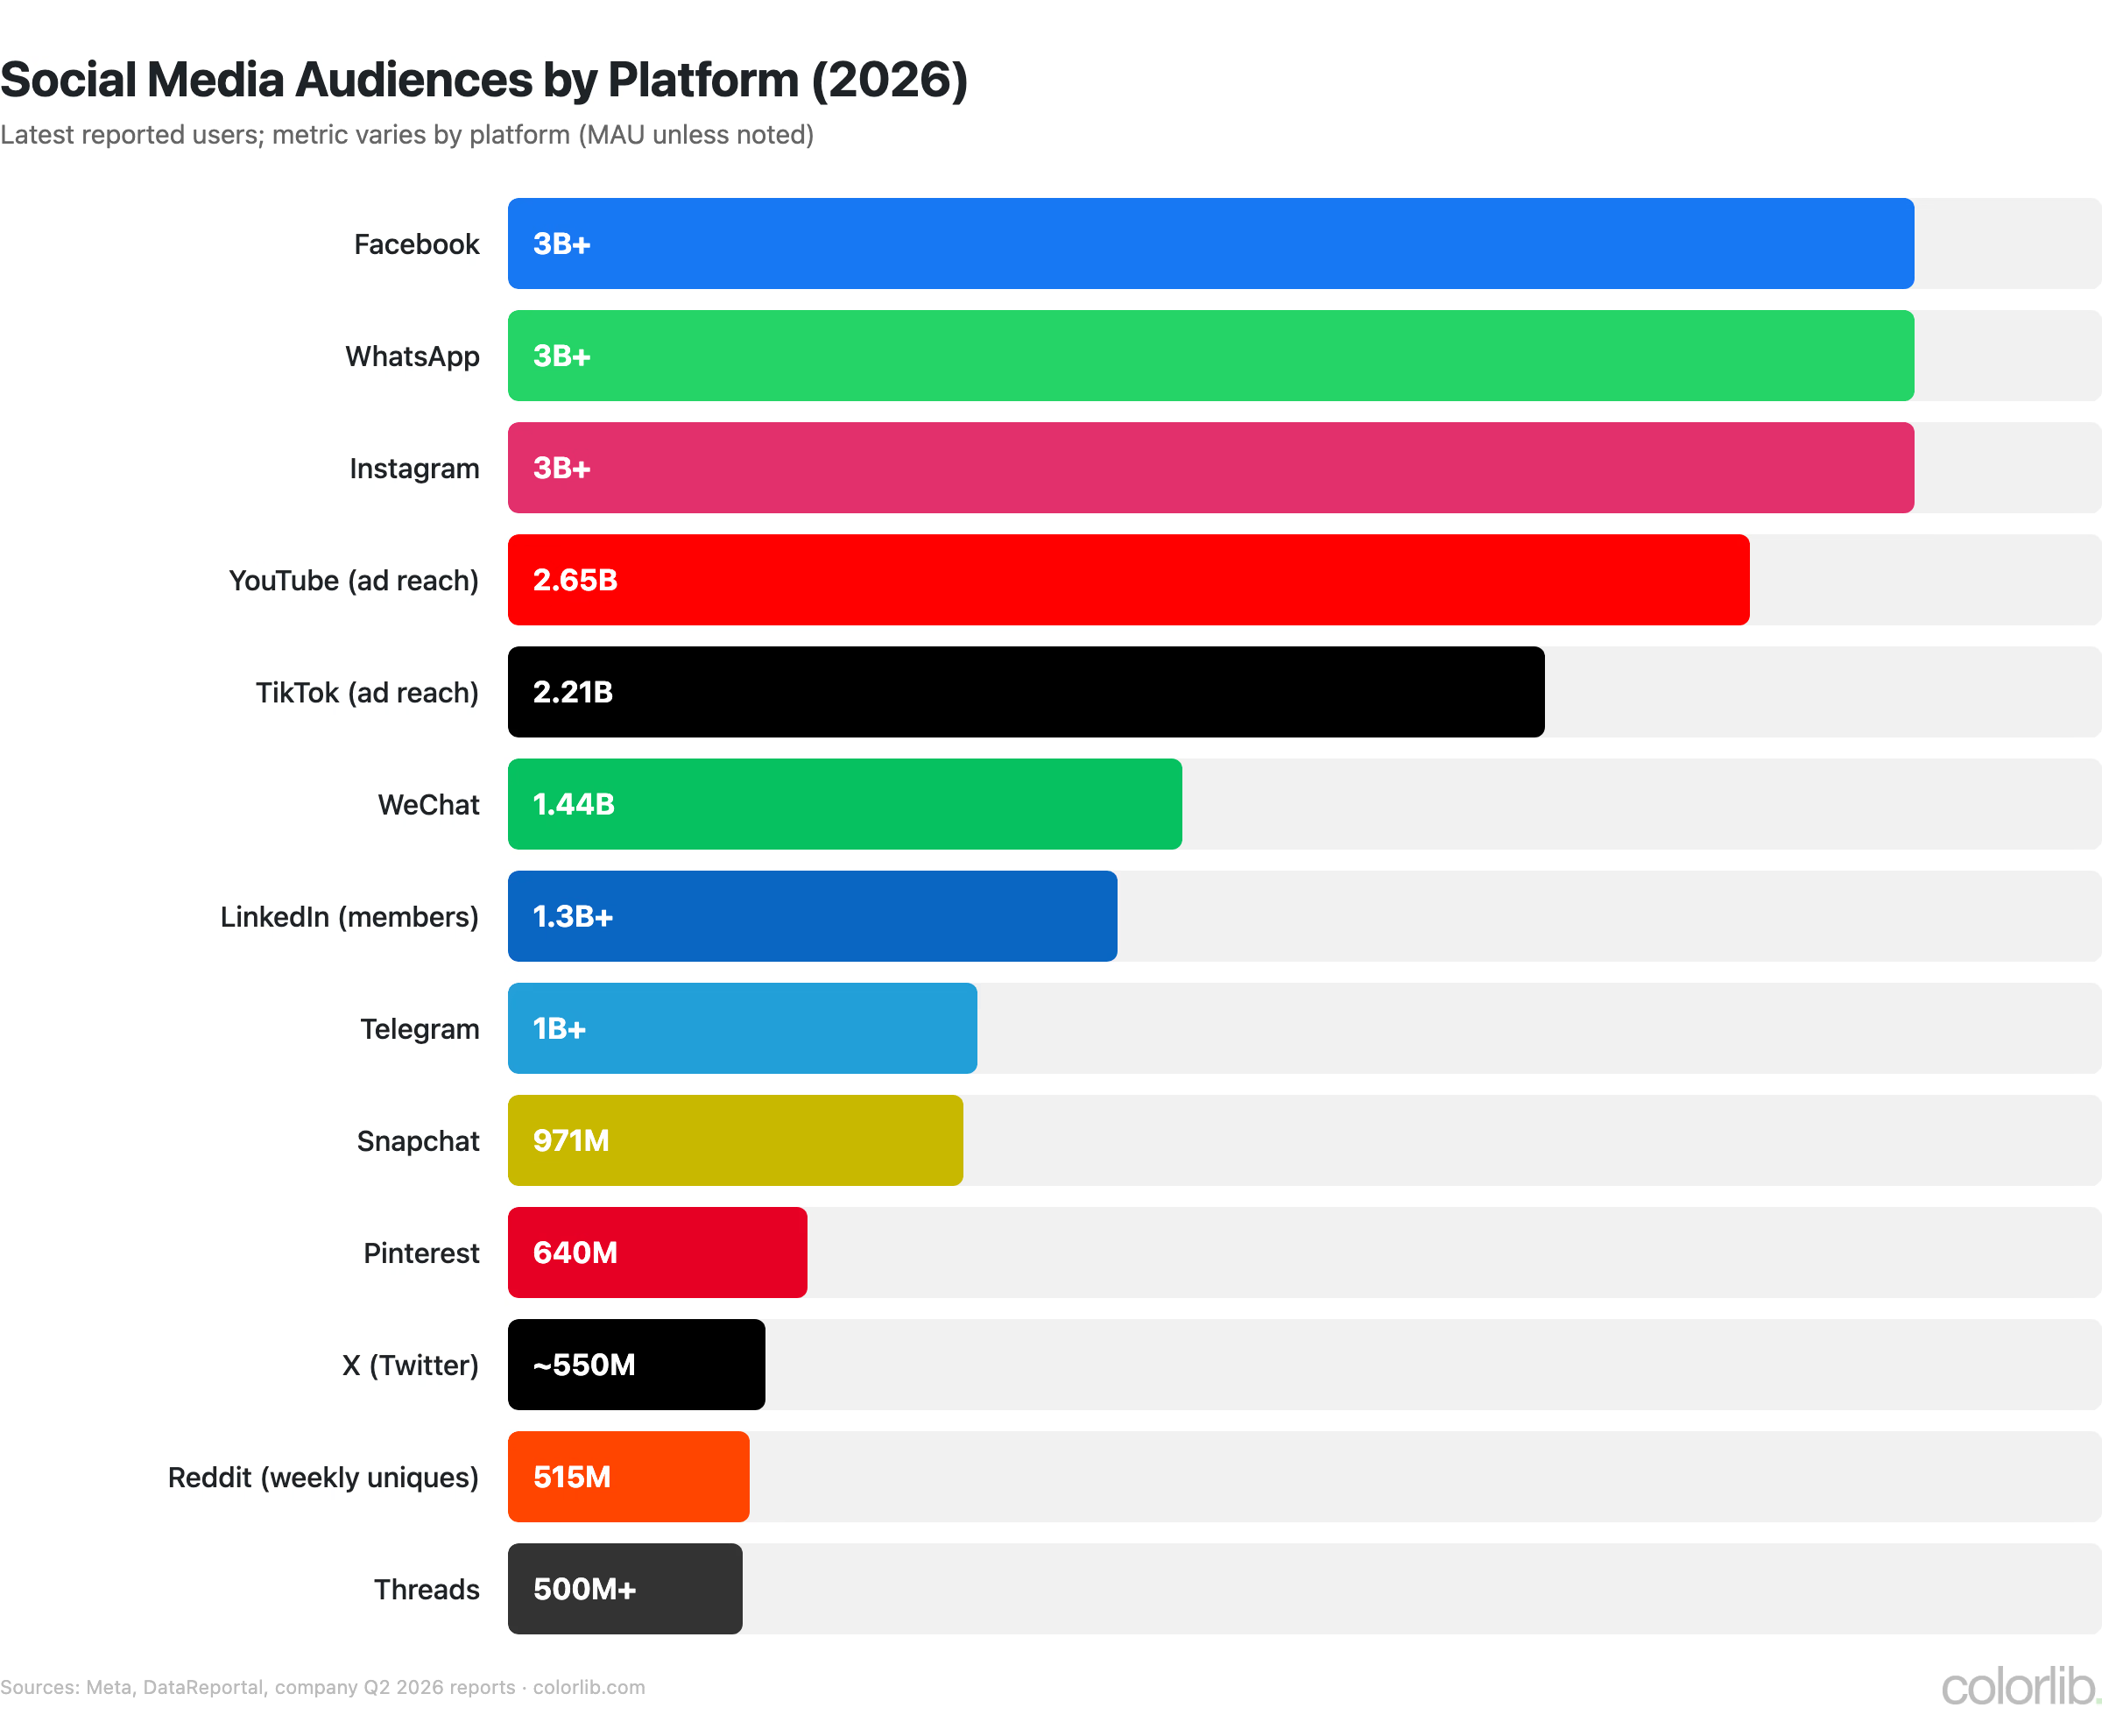
| 3+ billion MAU | 25-44 age group | |
| YouTube | 2.65 billion ad reach | All ages |
| 3+ billion MAU | 25-54 age group | |
| 3+ billion MAU | 18-34 age group | |
| TikTok | 2.21 billion ad reach | 16-24 age group |
| 1.44 billion MAU (Q2 2026) | China-dominant | |
| Telegram | 1+ billion MAU | 18-34 age group |
| Snapchat | 971 million MAU (Q2 2026) | 13-24 age group |
| 1.3 billion+ members | 25-54 professionals | |
| X (Twitter) | ~550 million MAU (March 2026) | 25-49 age group |
| 640 million MAU (Q2 2026) | Women 25-44 | |
| 515 million weekly uniques (Q2 2026) | Men 18-34 | |
| Threads | 500 million+ MAU (Q2 2026) | 25-34 age group |
- Facebook, WhatsApp and Instagram have each passed 3 billion monthly users, and Meta’s family of apps reached 3.6 billion daily active people in June 2026, up 3% year over year
- WhatsApp passed 3 billion monthly users in 2025, and business messaging is now a real revenue line: Meta’s non-ad app revenue reached $1 billion in Q2 2026, driven mainly by WhatsApp paid messaging
- TikTok ads reach 2.21 billion users, and its US business moved into a new joint venture led by Oracle, Silver Lake and MGX in January 2026, ending the ban threat. Its Android users average 1 hour 37 minutes a day in the app
- Telegram crossed 1 billion monthly active users in March 2025, and it is particularly popular in Eastern Europe, the Middle East and India
- Threads (Meta’s X competitor) crossed 500 million monthly actives in Q2 2026, after passing 150 million daily actives in late 2025
Time Spent on Social Media
| Platform (Android app) | Average Daily Time per User | Source |
|---|---|---|
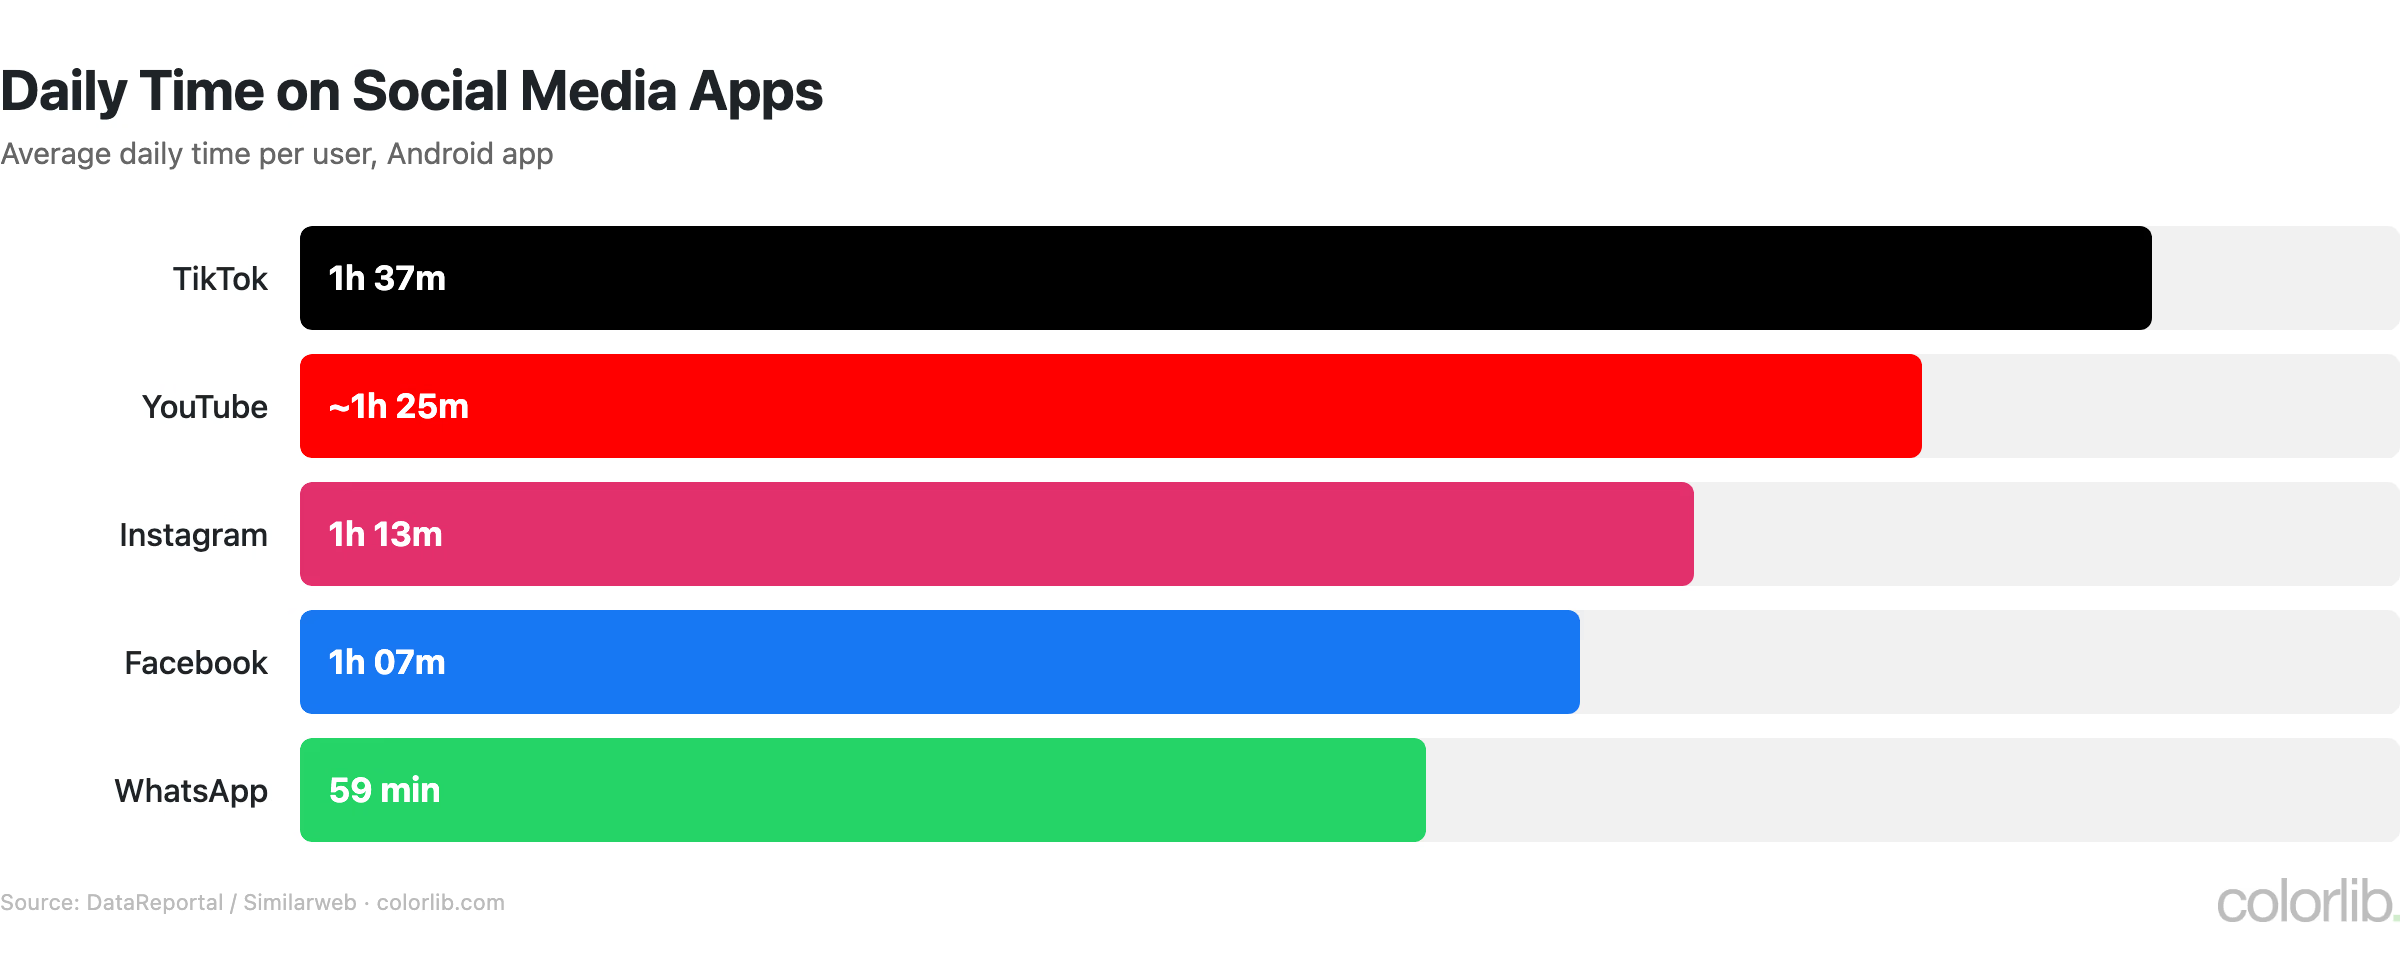
| TikTok | 1h 37m | DataReportal / Similarweb |
| YouTube | ~1h 25m | DataReportal / Similarweb |
| 1h 13m | DataReportal / Similarweb | |
| 1h 07m | DataReportal / Similarweb | |
| 59 minutes | DataReportal / Similarweb |
- TikTok dominates attention: its Android users spend 1 hour 37 minutes a day in the app, roughly 14% longer than the typical YouTube user
- YouTube has the longest sessions at 14 minutes 29 seconds each, and YouTube Shorts (which averages more than 200 billion daily views) competes directly with TikTok
- Instagram time spent grew double digits year over year in Q2 2026, which Meta credits to better Feed and Reels recommendations. Instagram also reached 2 billion daily actives
- Total time spent on social content amounts to more than 15 billion hours per day worldwide, the equivalent of over 1.75 million years of human time every single day
- WhatsApp is the most habitual app: 85.1% of its Android users open it every day, compared with 67.4% for Facebook and 65.4% for Instagram
Social Commerce
| Metric | Value | Source |
|---|---|---|
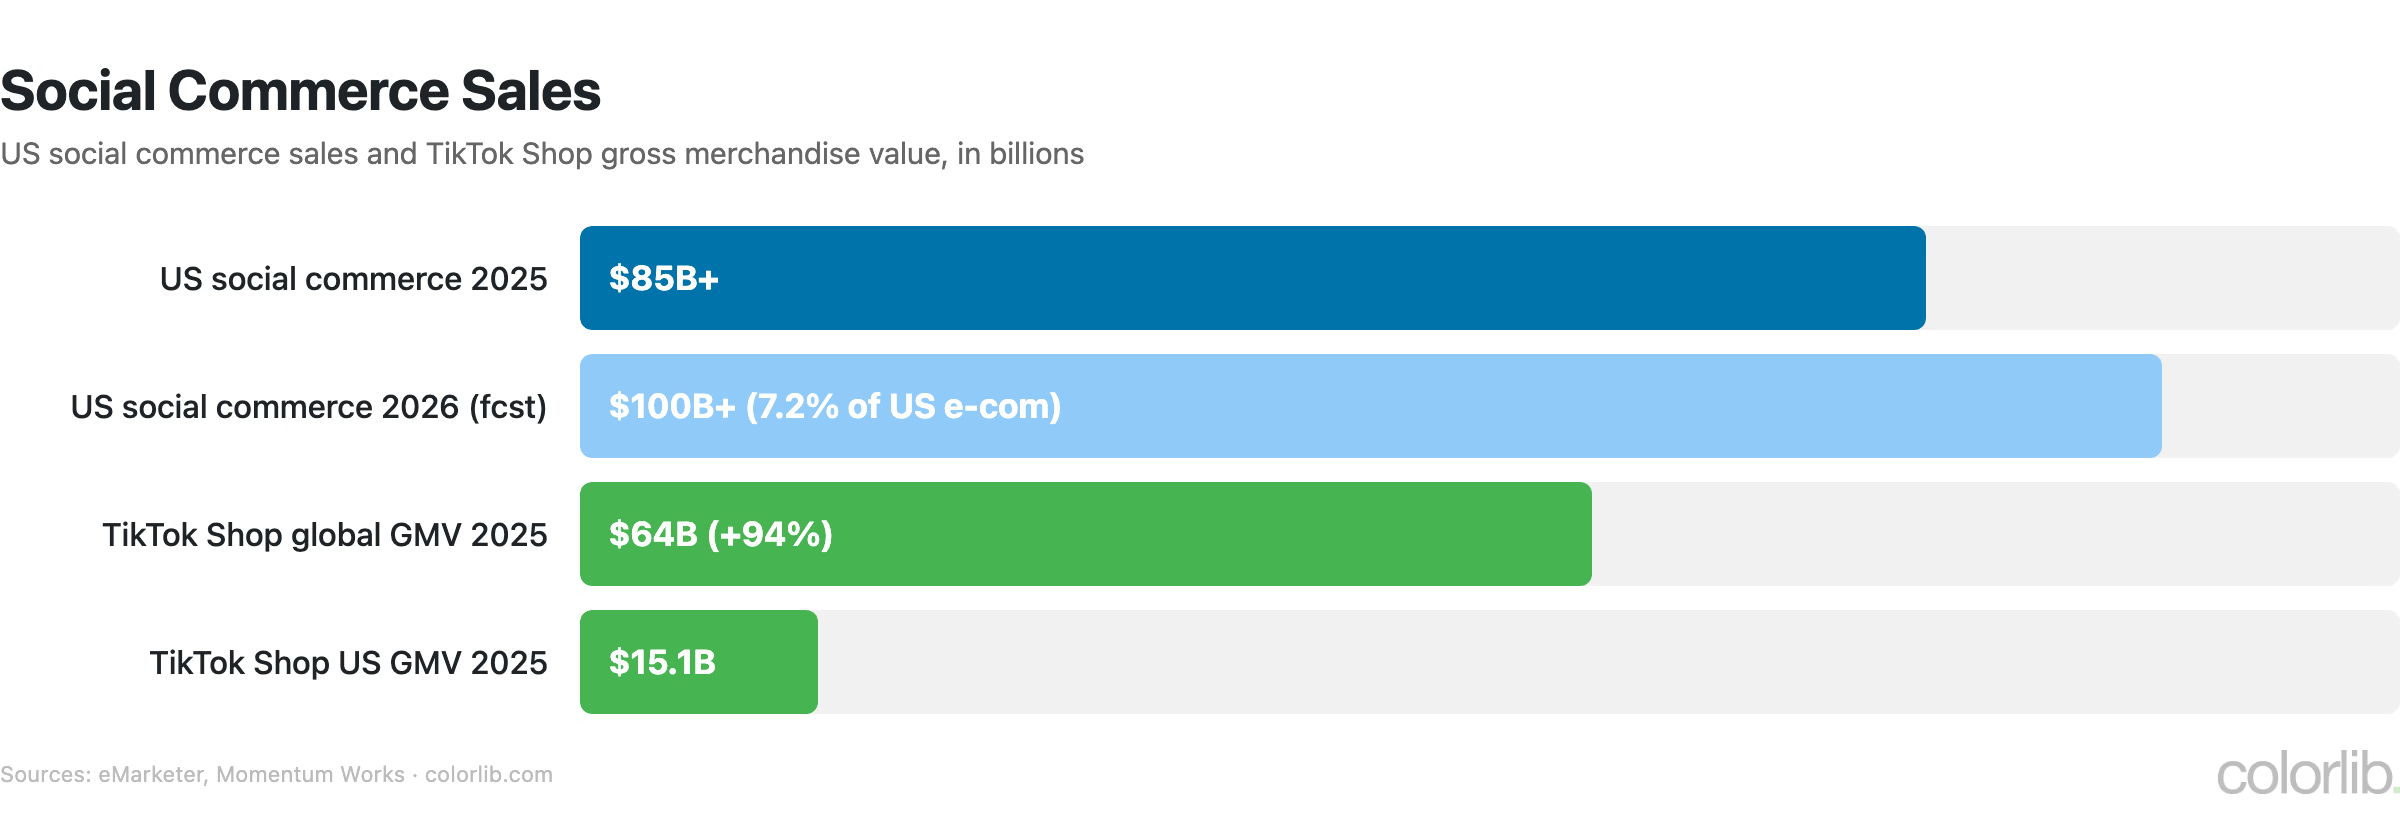
| US social commerce sales (2025) | $85+ billion | eMarketer |
| US social commerce sales (2026 forecast) | $100+ billion | eMarketer |
| Social commerce share of US e-commerce (2026 forecast) | 7.2% | eMarketer |
| TikTok Shop global GMV (2025) | $64 billion | Momentum Works |
| TikTok Shop US GMV (2025) | $15.1 billion | Momentum Works |
| Global social commerce (Accenture projection for 2025) | $1.2 trillion | Accenture |
- Accenture projected global social commerce would reach $1.2 trillion by 2025, with China, where livestream shopping is already mainstream, accounting for the largest share
- TikTok Shop is the fastest-growing social commerce platform, reaching $64 billion in global gross merchandise value in 2025, up 94% year over year, with Southeast Asia contributing about 70% of it
- US social commerce is forecast to pass $100 billion in 2026, growing about 18% and reaching 7.2% of all US e-commerce, driven by in-app checkout and creator-led product launches
Social Media Advertising
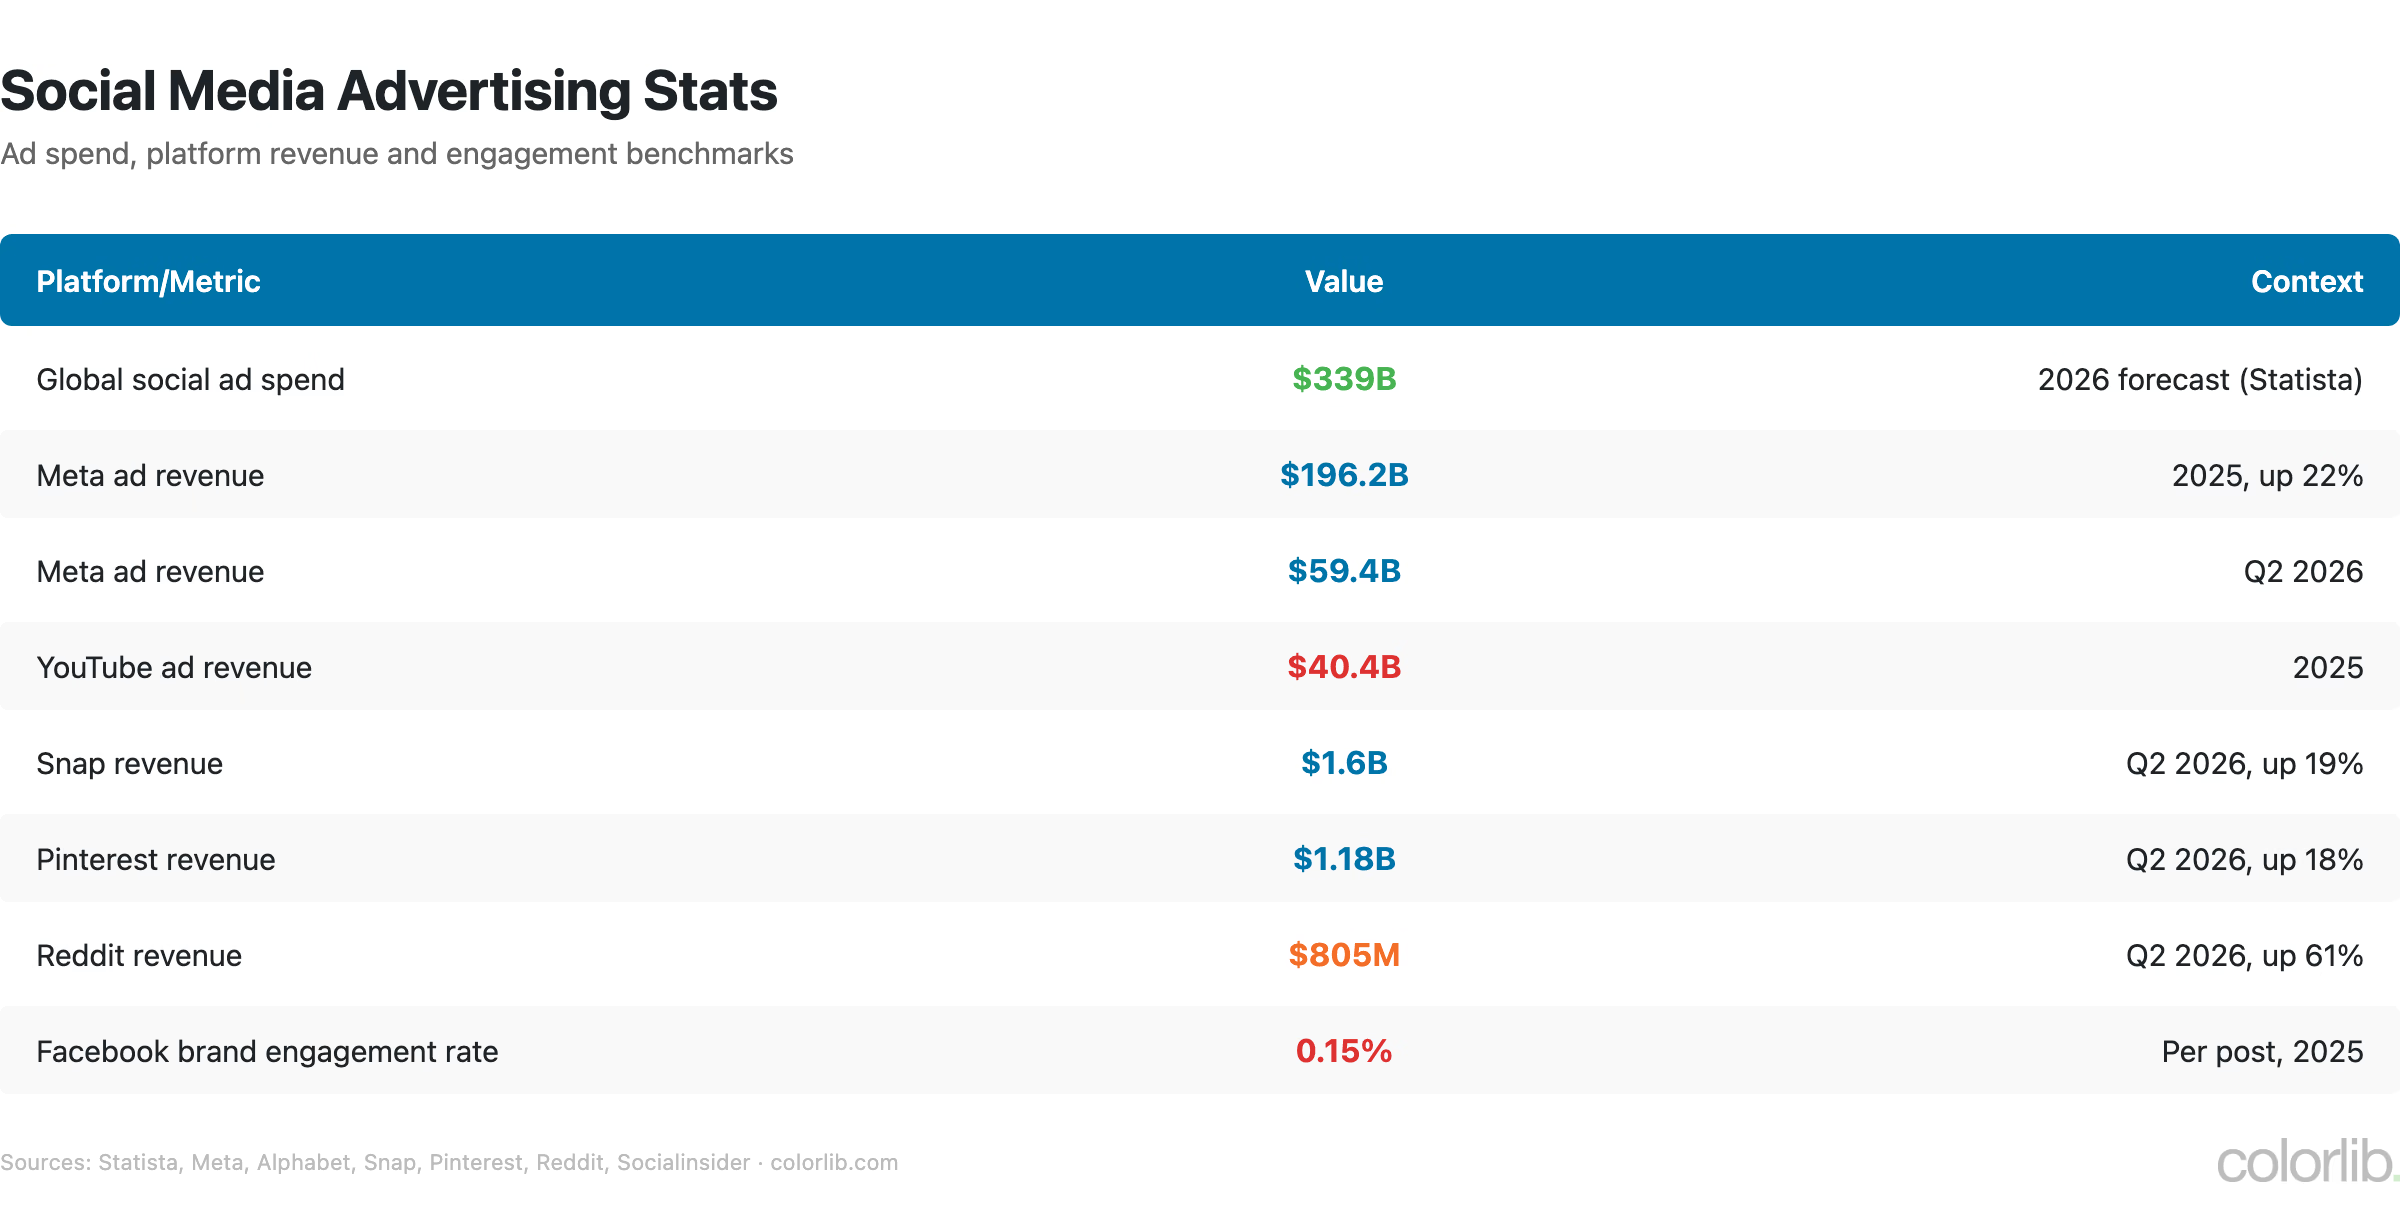
| Metric | Value | Source |
|---|---|---|
| Global social ad spend (2026 forecast) | $339 billion | Statista |
| Meta ad revenue (2025) | $196.2 billion | Meta |
| Meta ad revenue (Q2 2026) | $59.4 billion | Meta |
| YouTube ad revenue (2025) | $40.4 billion | Alphabet |
| Snap revenue (Q2 2026) | $1.6 billion | Snap |
| Pinterest revenue (Q2 2026) | $1.18 billion | |
| Reddit revenue (Q2 2026) | $805 million | |
| Facebook average brand engagement rate per post (2025) | 0.15% | Socialinsider |
- Social media advertising is projected to reach $339 billion in 2026, according to Statista Market Insights
- Meta dominates with $196.2 billion in 2025 ad revenue, up 22%, more than the next five social platforms combined. Its AI-powered Advantage+ campaigns passed a $75 billion annual run rate in Q2 2026
- Brand posts on Facebook averaged an engagement rate of just 0.15% in 2025, against 0.48% on Instagram and 3.70% on TikTok, which is why most brands pair organic posting with paid social
- Smaller platforms are growing faster than Meta: Reddit’s revenue grew 61% to $805 million in Q2 2026, Snap’s grew 19% to $1.6 billion and Pinterest’s grew 18% to $1.18 billion
- YouTube’s ad business brought in $40.4 billion in 2025, and YouTube’s total revenue including subscriptions topped $60 billion
Social Media Trends 2026
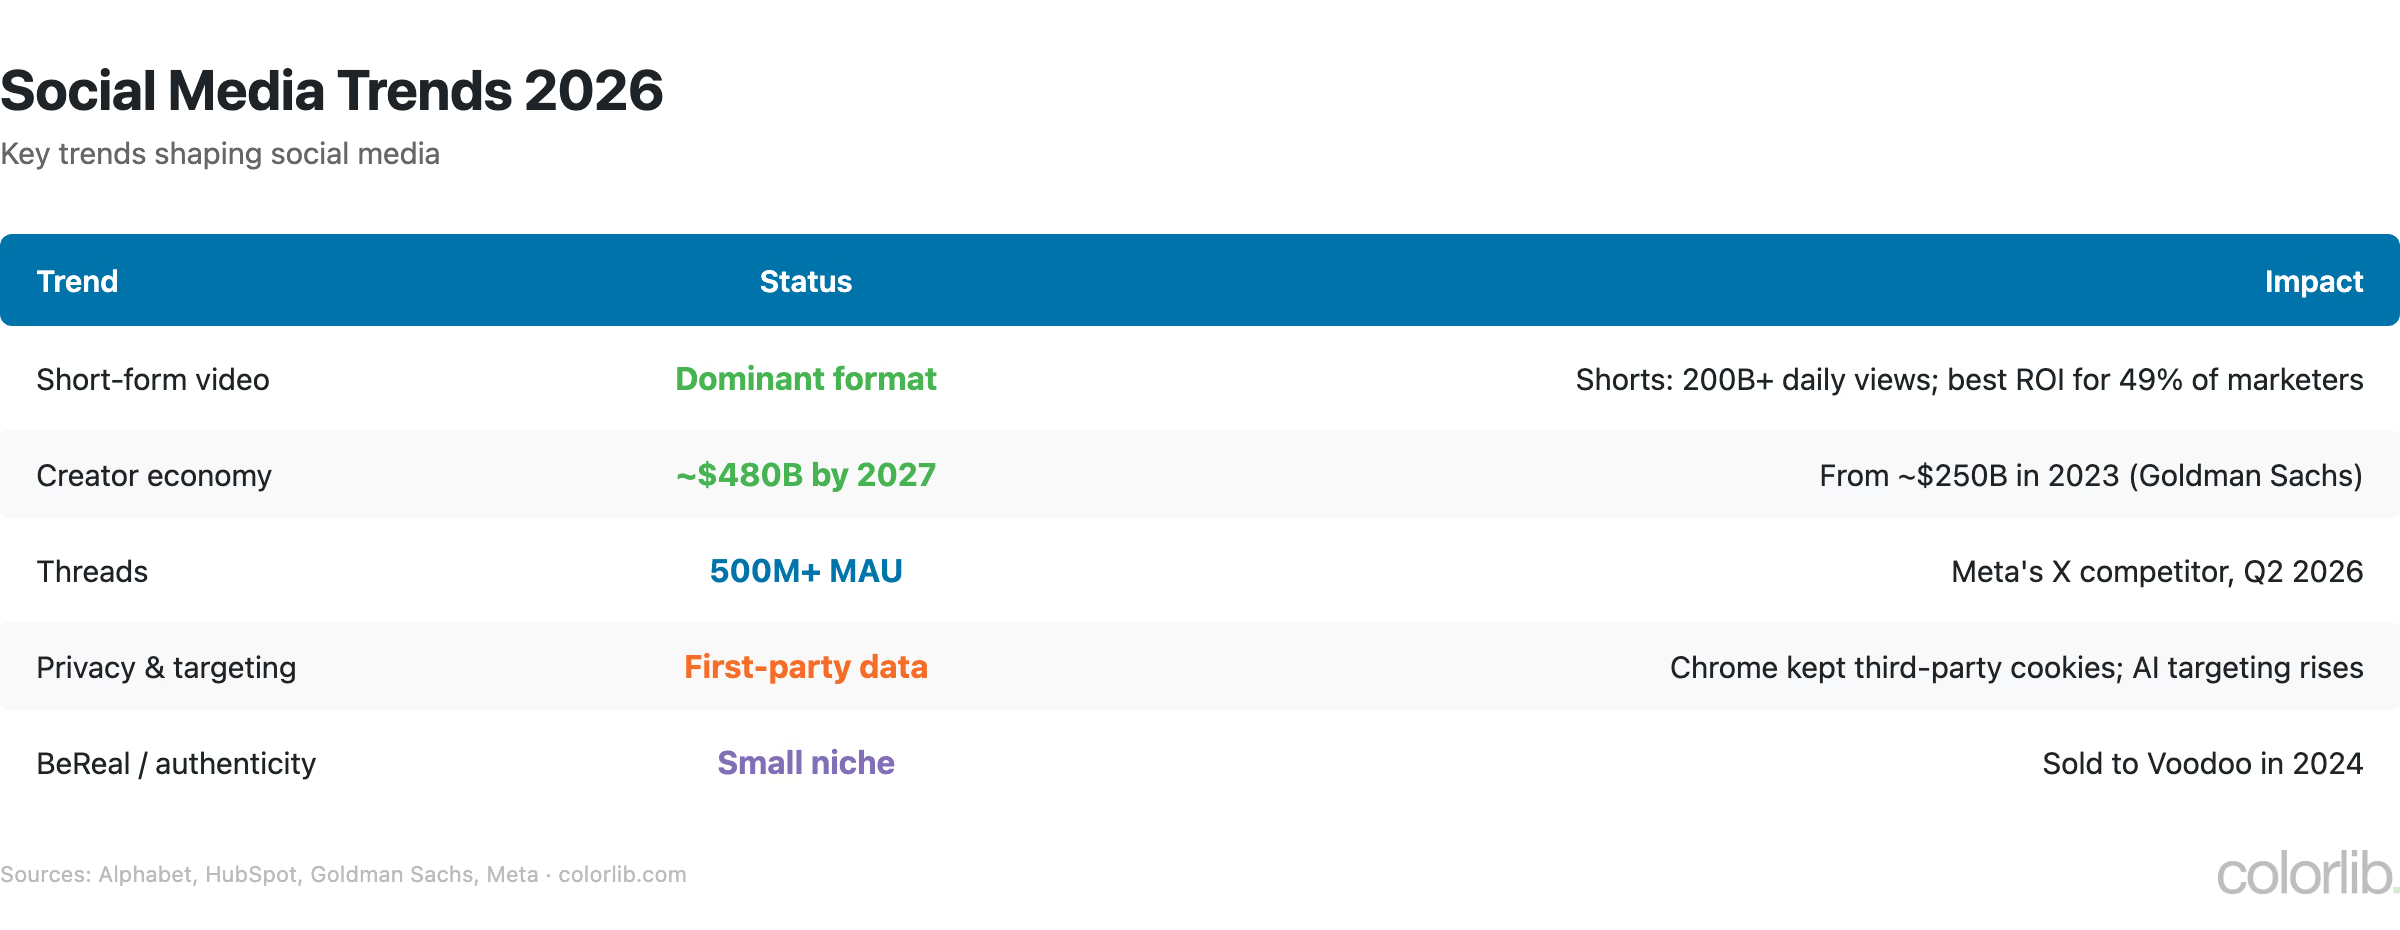
- Short-form video dominates everything. YouTube Shorts alone averages 200+ billion daily views, and 49% of marketers say short-form video delivers their best ROI. Platforms that don’t prioritize video are losing engagement
- Creator economy continues to grow. Goldman Sachs sized the creator economy at about $250 billion in 2023 and projects it could approach $480 billion by 2027, including brand deals, subscriptions, and merchandise
- Privacy regulations are reshaping targeting. Google dropped its plan to phase out third-party cookies in Chrome, but privacy regulation and app-tracking limits still push social platforms toward first-party data and AI-based targeting
- BeReal and authenticity apps are carving a niche. While still small (BeReal was sold to games publisher Voodoo in 2024) compared to major platforms, the demand for unfiltered, authentic content is influencing how Instagram and TikTok design features
Sources
- DataReportal — Global Social Media Statistics
- Meta — Investor Relations
- Statista — Social Media Advertising
- eMarketer — Social Commerce Report
- DataReportal — Digital 2026: social media use and app time
- Socialinsider — 2026 Social Media Benchmarks
- HubSpot — Marketing Statistics
- Momentum Works — TikTok Shop GMV
Frequently Asked Questions
How many people use social media in 2026?
DataReportal counted 5.79 billion social media user identities in April 2026, equal to 69.9% of the global population and 94.7% of internet users. Social media added more than 800,000 new users per day over the previous 12 months. The average user is active on 6.5 different platforms a month and spends about 18 hours 36 minutes a week on social media.
What is the most popular social media platform?
Facebook, WhatsApp and Instagram each have more than 3 billion monthly active users, and YouTube has the largest ad audience at 2.65 billion. However, TikTok leads in daily time spent (1 hour 37 minutes per Android user) and brand engagement rate (3.70% per post). By demographic, TikTok dominates among Gen Z, LinkedIn is the top professional network, and Facebook still leads among users over 35. For engagement benchmarks, see our Instagram engagement rate report.
How much do businesses spend on social media advertising?
Statista projects global social media ad spending of $339 billion in 2026. Meta (Facebook, Instagram and WhatsApp) took in $196.2 billion in ad revenue in 2025, far more than any other social company, while YouTube’s ads brought in $40.4 billion. Among marketers, Instagram (70%) and Facebook (69.6%) are the most-used platforms.
Is social media marketing still effective?
Yes, but the strategy has shifted. Organic engagement keeps falling: brand posts on Facebook average an engagement rate of only 0.15%. Effective social media marketing in 2026 requires a mix of paid advertising, short-form video content, influencer partnerships, and community engagement. 49% of marketers say short-form video delivers their best ROI, and US social commerce sales passed $85 billion in 2025. The key is meeting audiences where they are: video-first, mobile-first, and increasingly through social search. For broader marketing trends, see our digital marketing statistics report.
Key Takeaways
- Social media reaches 69.9% of humanity. With 5.79 billion user identities spending more than 2.5 hours a day, social platforms collectively command more than 15 billion hours of human attention every single day.
- Meta has the scale, but TikTok owns engagement. Facebook, Instagram and WhatsApp each top 3 billion monthly users, but TikTok’s 1 hour 37 minutes a day is unmatched. Short-form video is the dominant format everywhere.
- Social commerce is passing $100 billion in the US alone. Led by China’s livestream shopping and TikTok Shop’s $64 billion in 2025 GMV, buying through social media is becoming as natural as scrolling through a feed.
- Organic reach is hard to come by for brands. With Facebook brand posts averaging a 0.15% engagement rate, brands must pay to play. Social advertising is heading for $339 billion in 2026, essentially a tax on reaching your own followers.

Related Posts






Comments (0)