Skip to content
Our free WordPress themes are downloaded over 7 MILLION times. Get them now!
saas statistics
Colorlib content is free. When you buy through links on our site, we may earn an affiliate commission. Read our affiliate disclosure

60+ SaaS Statistics: Market Size, Growth & Trends (2026)

Statista projects the global SaaS market will reach $488.5 billion in 2026, with the US alone at $254.9 billion. Organizations in Zylo’s dataset now run an average of 305 SaaS apps and spend $55.7 million a year on them, up 8% in a year, as AI add-ons and usage-based pricing push costs higher. Here are 60+ SaaS statistics covering market size, revenue, churn, pricing, AI adoption, security, and funding for 2026.

Key SaaS Statistics (2026)

  • Global SaaS market: $488.5 billion (2026), projected $855.6 billion by 2031 (Statista)
  • US SaaS market: $254.9 billion in 2026, about 52% of the global total (Statista)
  • Average SaaS portfolio: 305 apps and $55.7 million in annual spend, up 8% year over year (Zylo, 2026)
  • 53% of licenses go a full year without a login (BetterCloud)
  • 92% of SaaS companies have launched or plan to launch AI features (High Alpha via Zylo)
  • Spend on AI-native apps jumped 108% in a year, and 393% at large enterprises (Zylo)
  • 78% of IT leaders were hit with unexpected charges tied to AI features or consumption pricing (Zylo)

SaaS Market Size & Growth

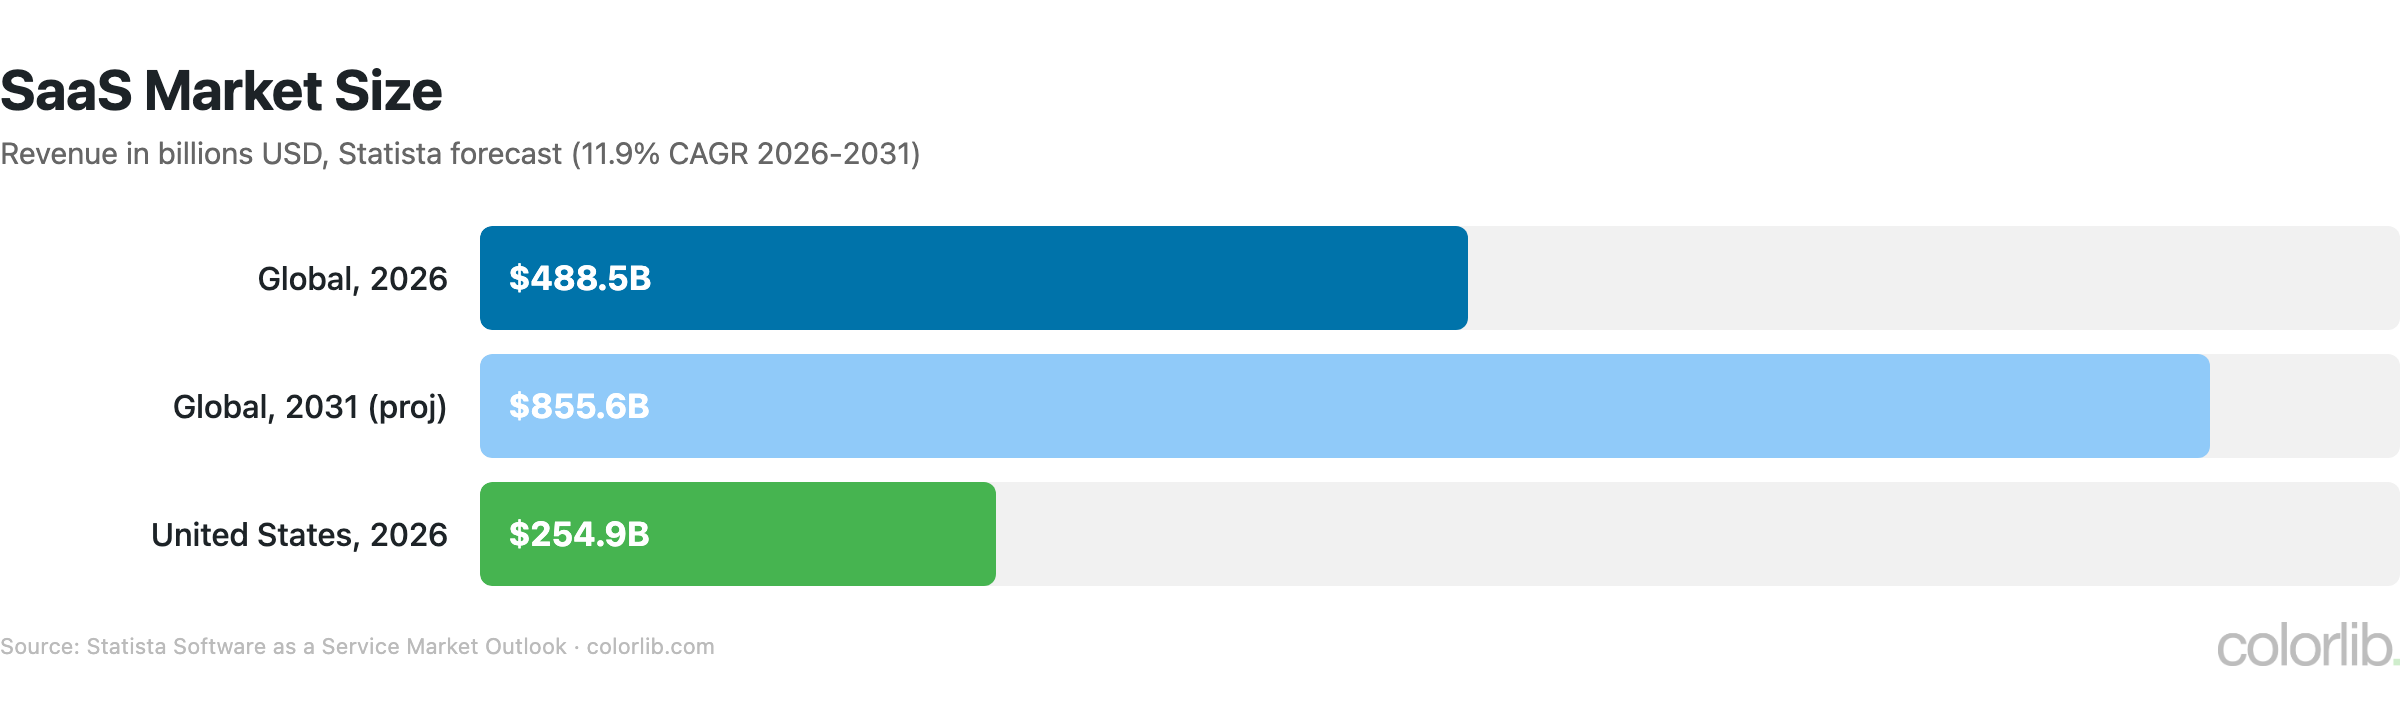
Bar chart of the SaaS market: $488.5 billion globally in 2026, $855.6 billion projected for 2031, and $254.9 billion in the US in 2026
MetricValueSource
Global SaaS market (2026)$488.5 billionStatista
Projected by 2031$855.6 billionStatista
CAGR (2026-2031)11.9%Statista
US SaaS market (2026)$254.9 billionStatista
US share of global SaaS revenue~52%Statista
Median growth rate, private B2B SaaS (2026 survey)22% (25% in 2024)SaaS Capital

Top SaaS Companies by Revenue

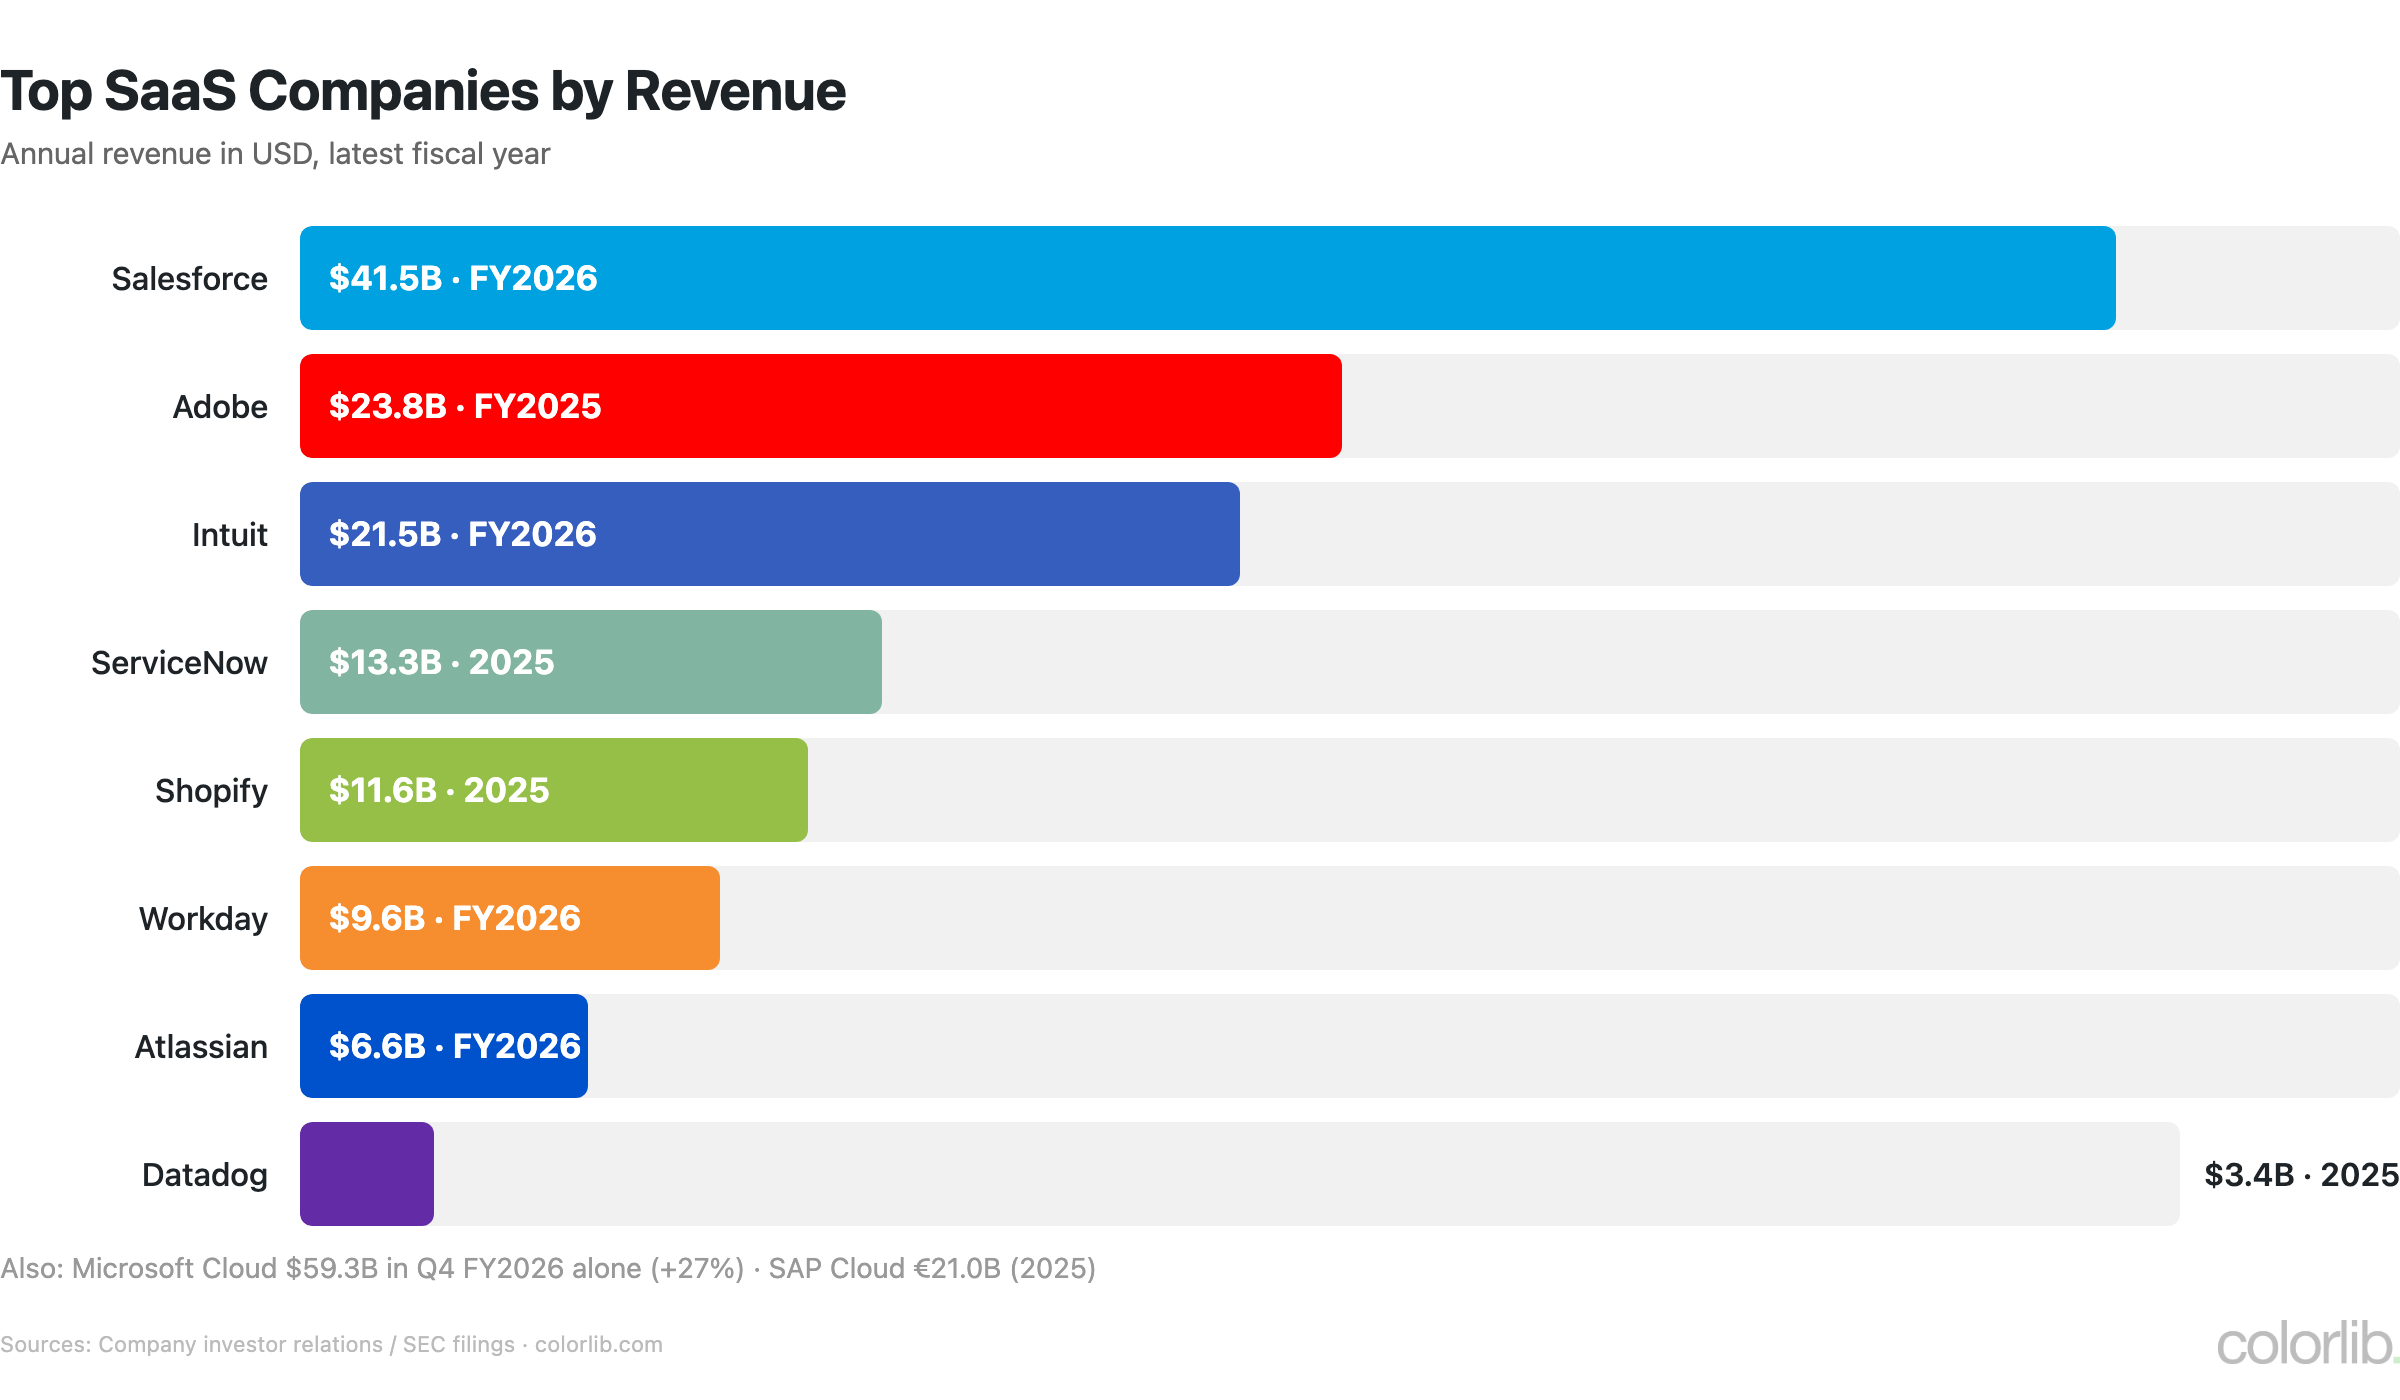
Bar chart of annual revenue for top SaaS companies: Salesforce $41.5B, Adobe $23.8B, Intuit $21.5B, ServiceNow $13.3B, Shopify $11.6B, Workday $9.6B, Atlassian $6.6B, Datadog $3.4B
CompanyRevenueFY
Microsoft Cloud$59.3B in Q4 alone (+27%)FY2026
Salesforce$41.5BFY2026
Adobe$23.8BFY2025
SAP Cloud€21.0B2025
Intuit$21.5BFY2026
ServiceNow$13.3B2025
Shopify$11.6B2025
Workday$9.6BFY2026
Atlassian$6.6BFY2026
Datadog$3.4B (+28%)2025
Sources: Company investor relations / SEC filings

SaaS Business Metrics Benchmarks

MetricBenchmarkSource
CAC payback period15 months (median)OpenView
LTV:CAC ratio (ideal)3:1+ (median 4:1)SaaS Capital
Gross margins72-78%KeyBanc
NRR (median public)110%SaaS Capital
NRR (top quartile)120%+KeyBanc
Rule of 40 achieversOnly 25%McKinsey
Time to $1M ARR2-3 yearsChartMogul
Revenue per employee$200-350KMeritech

SaaS Churn & Retention

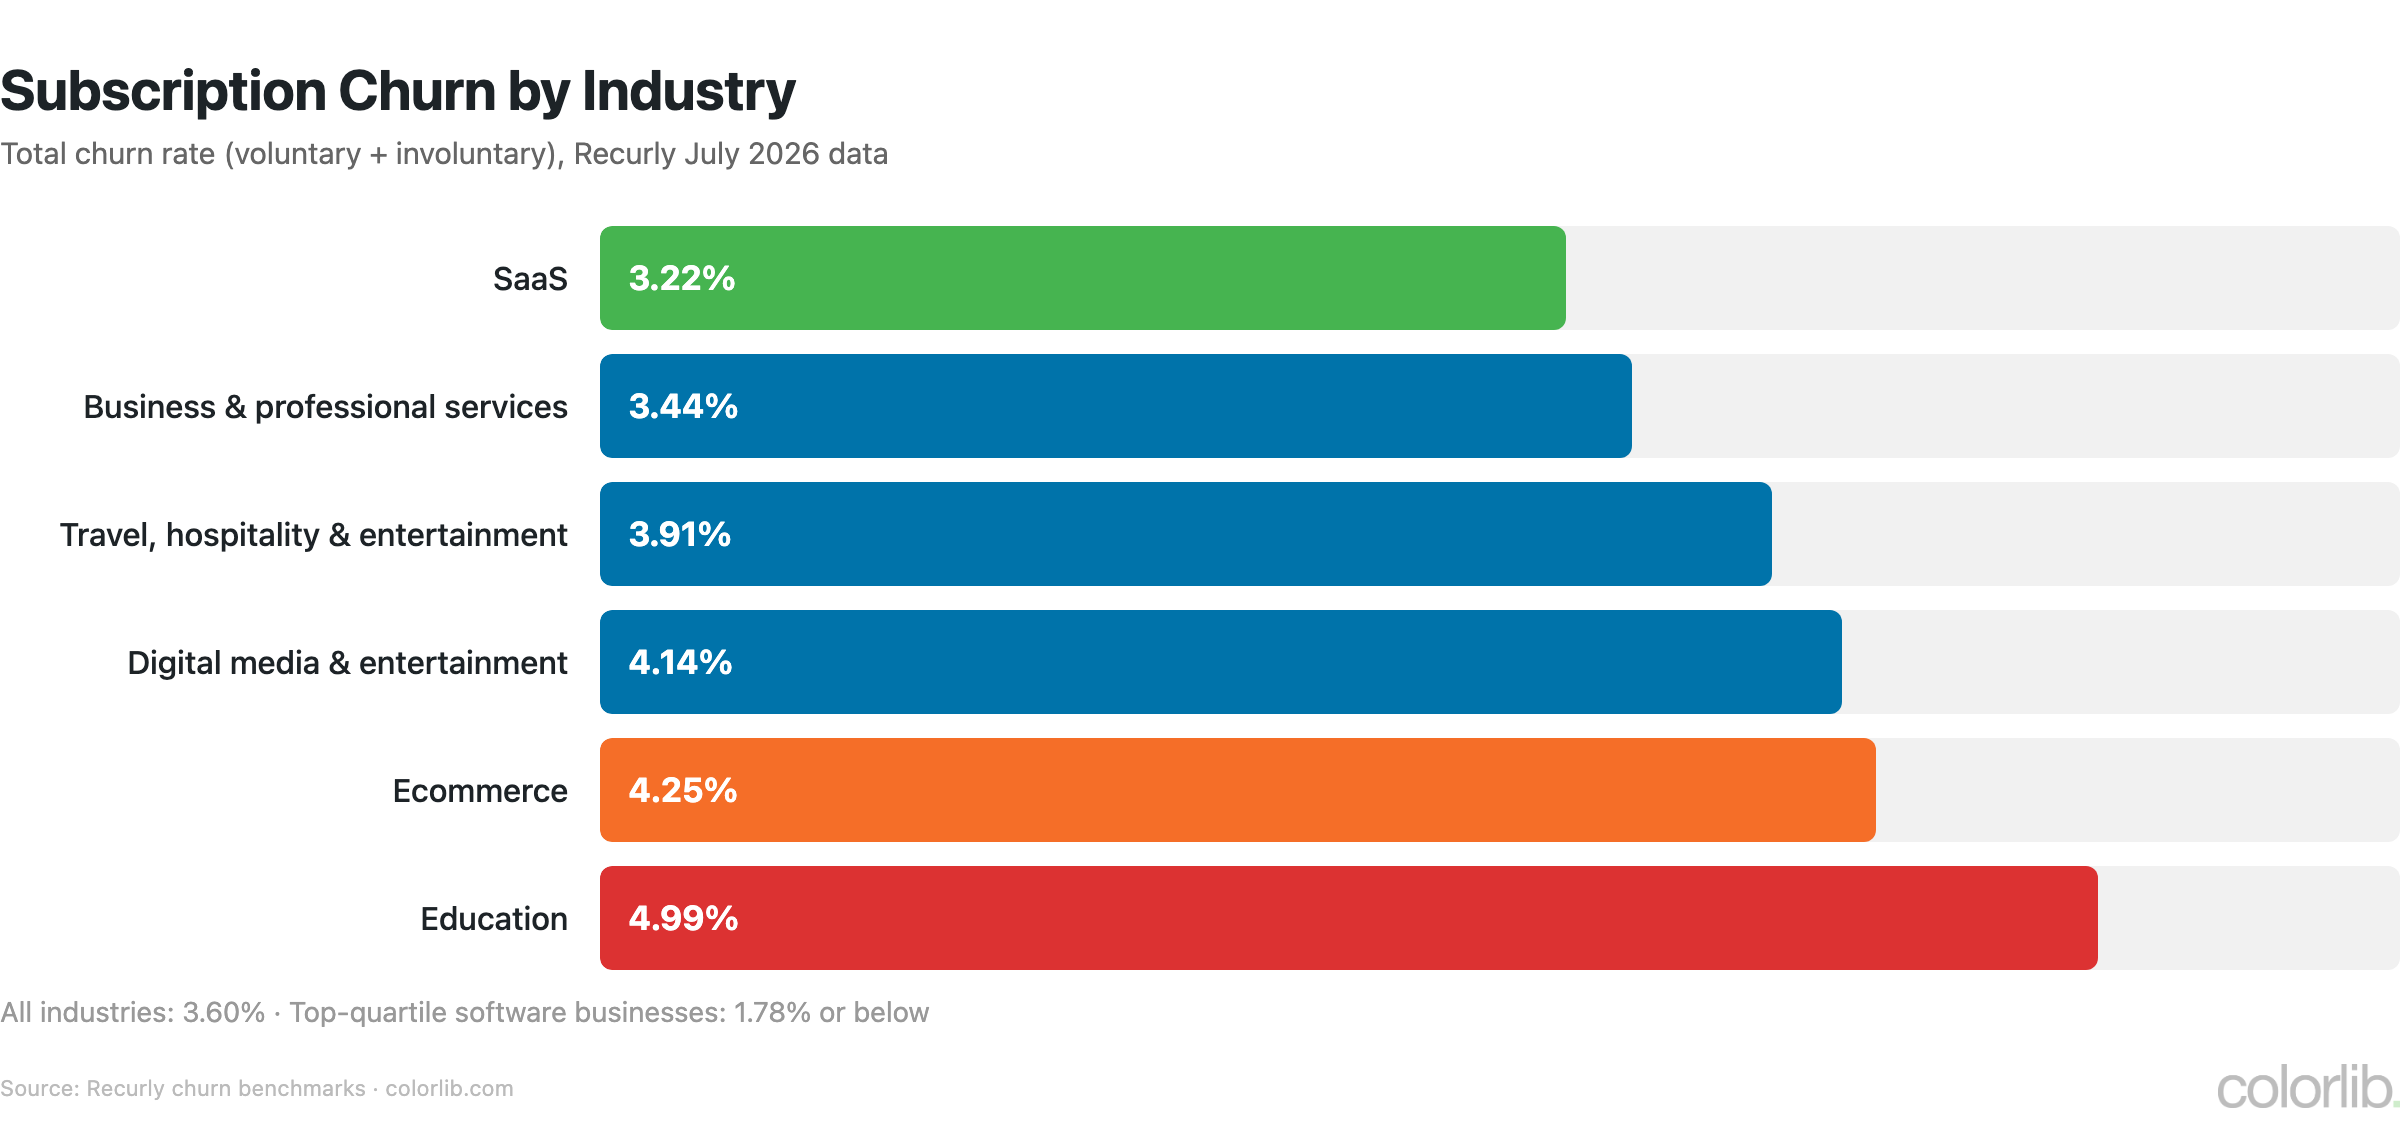
Bar chart of subscription churn by industry from Recurly: SaaS 3.22%, business services 3.44%, travel and hospitality 3.91%, digital media 4.14%, ecommerce 4.25%, education 4.99%
IndustryTotal ChurnVoluntaryInvoluntary
SaaS3.22%2.16%1.06%
Business & professional services3.44%2.27%1.18%
Travel, hospitality & entertainment3.91%2.63%1.28%
Digital media & entertainment4.14%2.55%1.59%
Ecommerce4.25%2.87%1.38%
Education4.99%3.30%1.69%
Source: Recurly churn benchmarks (July 2026 data)
  • SaaS has the lowest churn of the six verticals Recurly tracks, at 3.22%; education is the highest at 4.99%
  • Top-quartile software businesses keep churn at 1.78% or below on Recurly’s network
  • Involuntary churn (failed payments) makes up about a third of all churn: 1.25 of 3.60 points across all industries
  • Higher-value subscribers churn less: the $250+ ARPC cohort sees 3.07% total churn and just 0.18% involuntary churn

SaaS Pricing Statistics

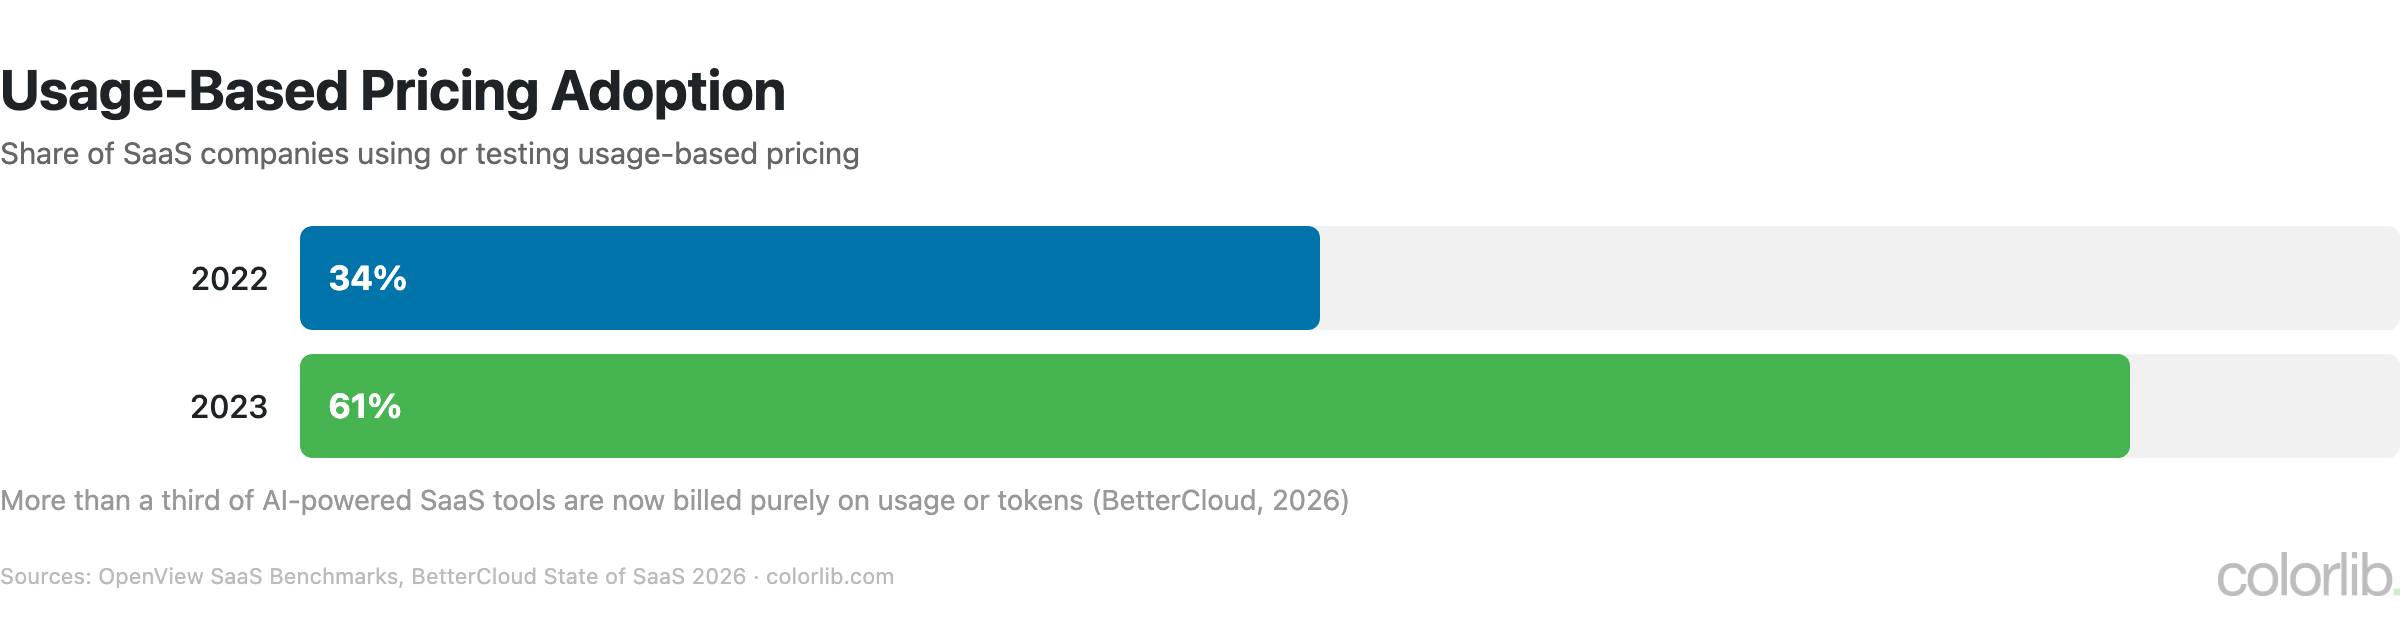
Bar chart showing usage-based pricing adoption among SaaS companies rising from 34% in 2022 to 61% in 2023
  • Usage-based pricing adoption: 61% of SaaS companies used or tested it in 2023, up from 34% in 2022 (OpenView)
  • More than a third of AI-powered SaaS tools are billed purely on usage or token consumption rather than per seat (BetterCloud, 2026)
  • 78% of IT leaders reported unexpected charges tied to AI features or consumption-based pricing in the past year (Zylo, 2026)
  • 61% cut projects because of unplanned SaaS cost increases (Zylo)

SaaS Spending & Adoption

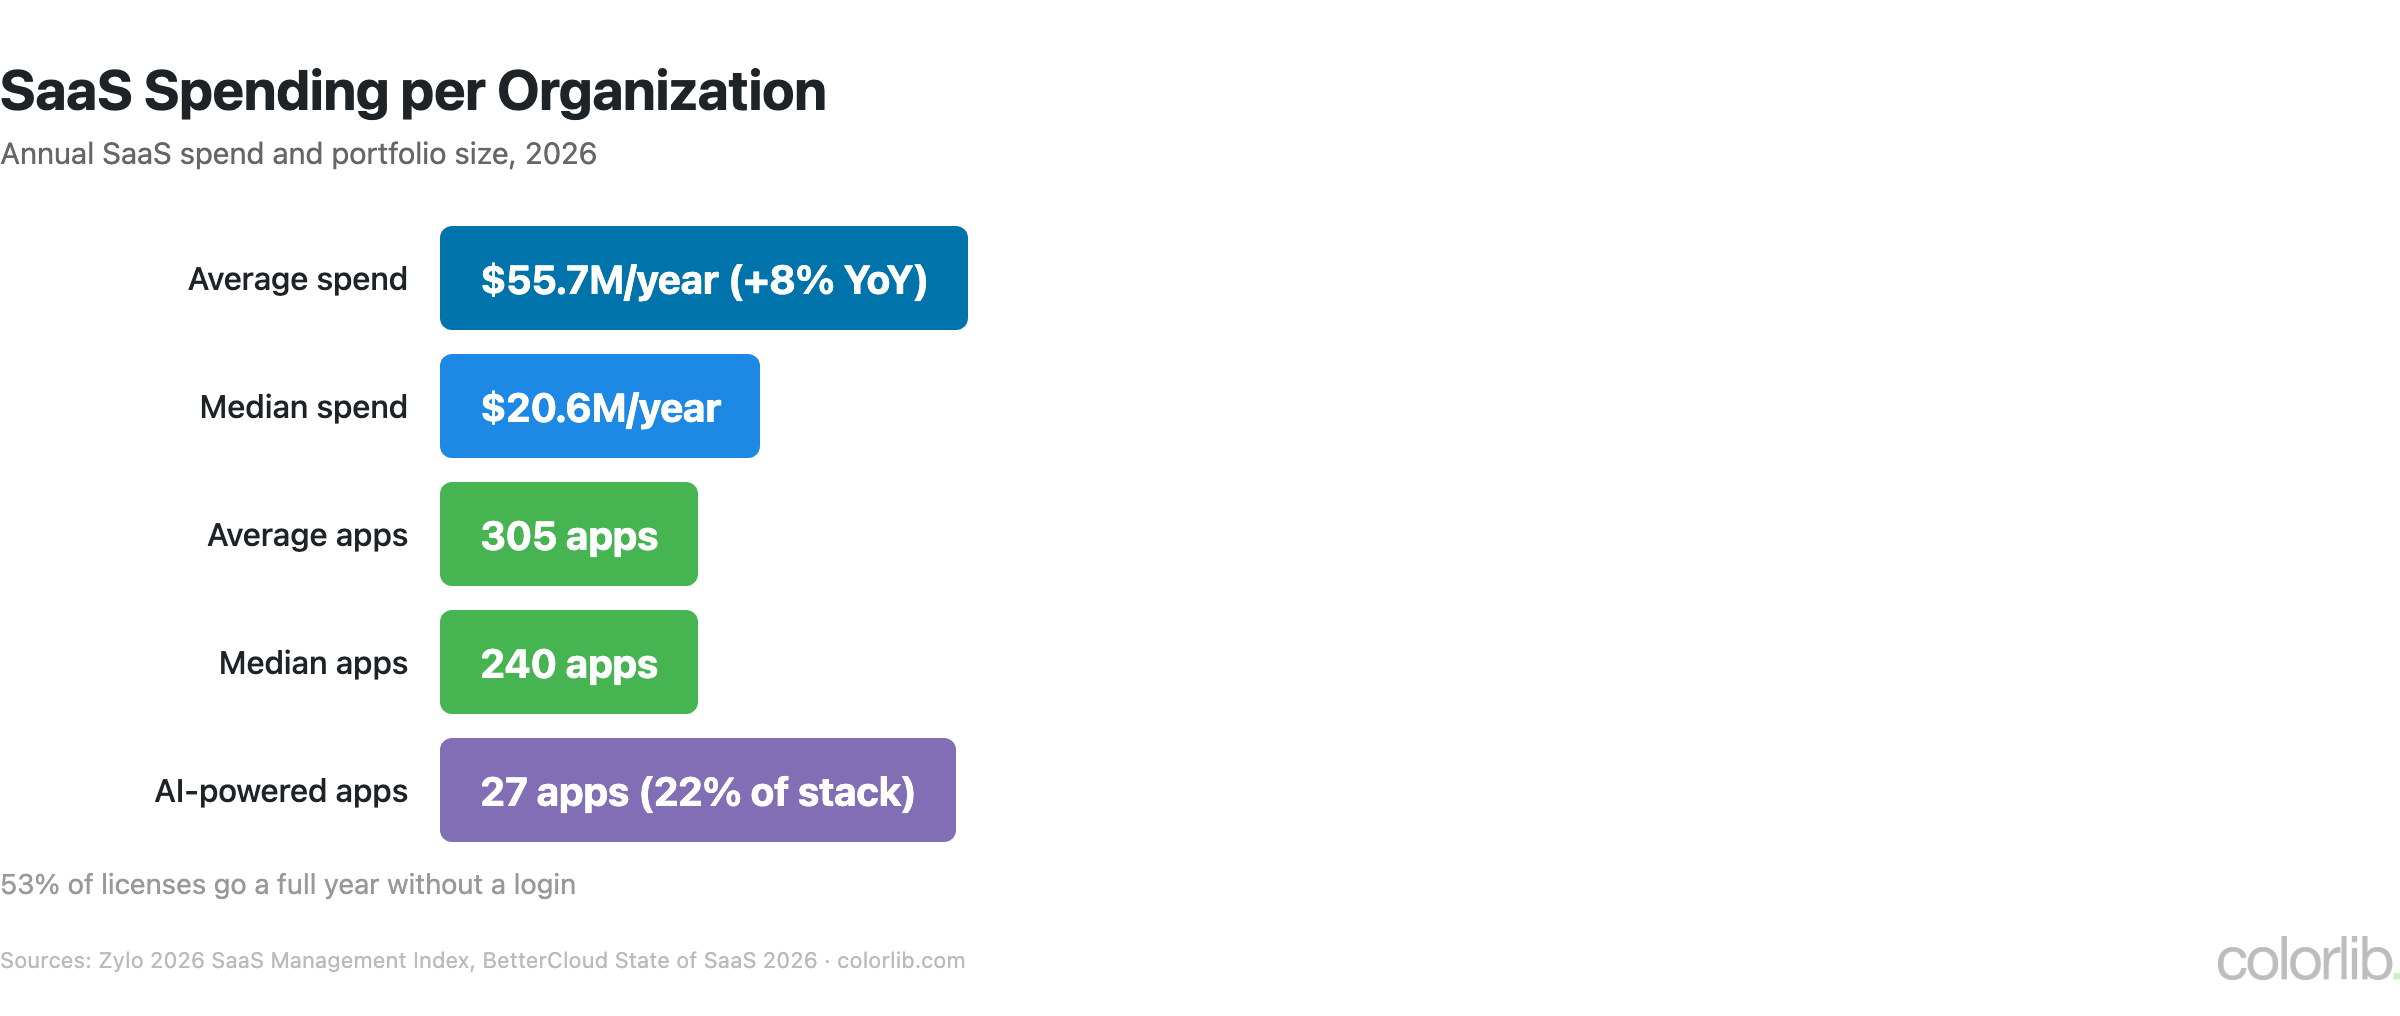
Chart of SaaS spending per organization: average $55.7 million a year, median $20.6 million, average 305 apps, median 240 apps, 27 AI-powered apps
MetricValueSource
SaaS apps per organization (average)305Zylo
SaaS apps per organization (median)240Zylo
Annual SaaS spend (average)$55.7 million (+8% YoY)Zylo
Annual SaaS spend (median)$20.6 millionZylo
AI-powered SaaS apps per organization27BetterCloud
Share of tech stack that is AI-powered22%BetterCloud
Licenses without a login for a year53%BetterCloud

AI in SaaS

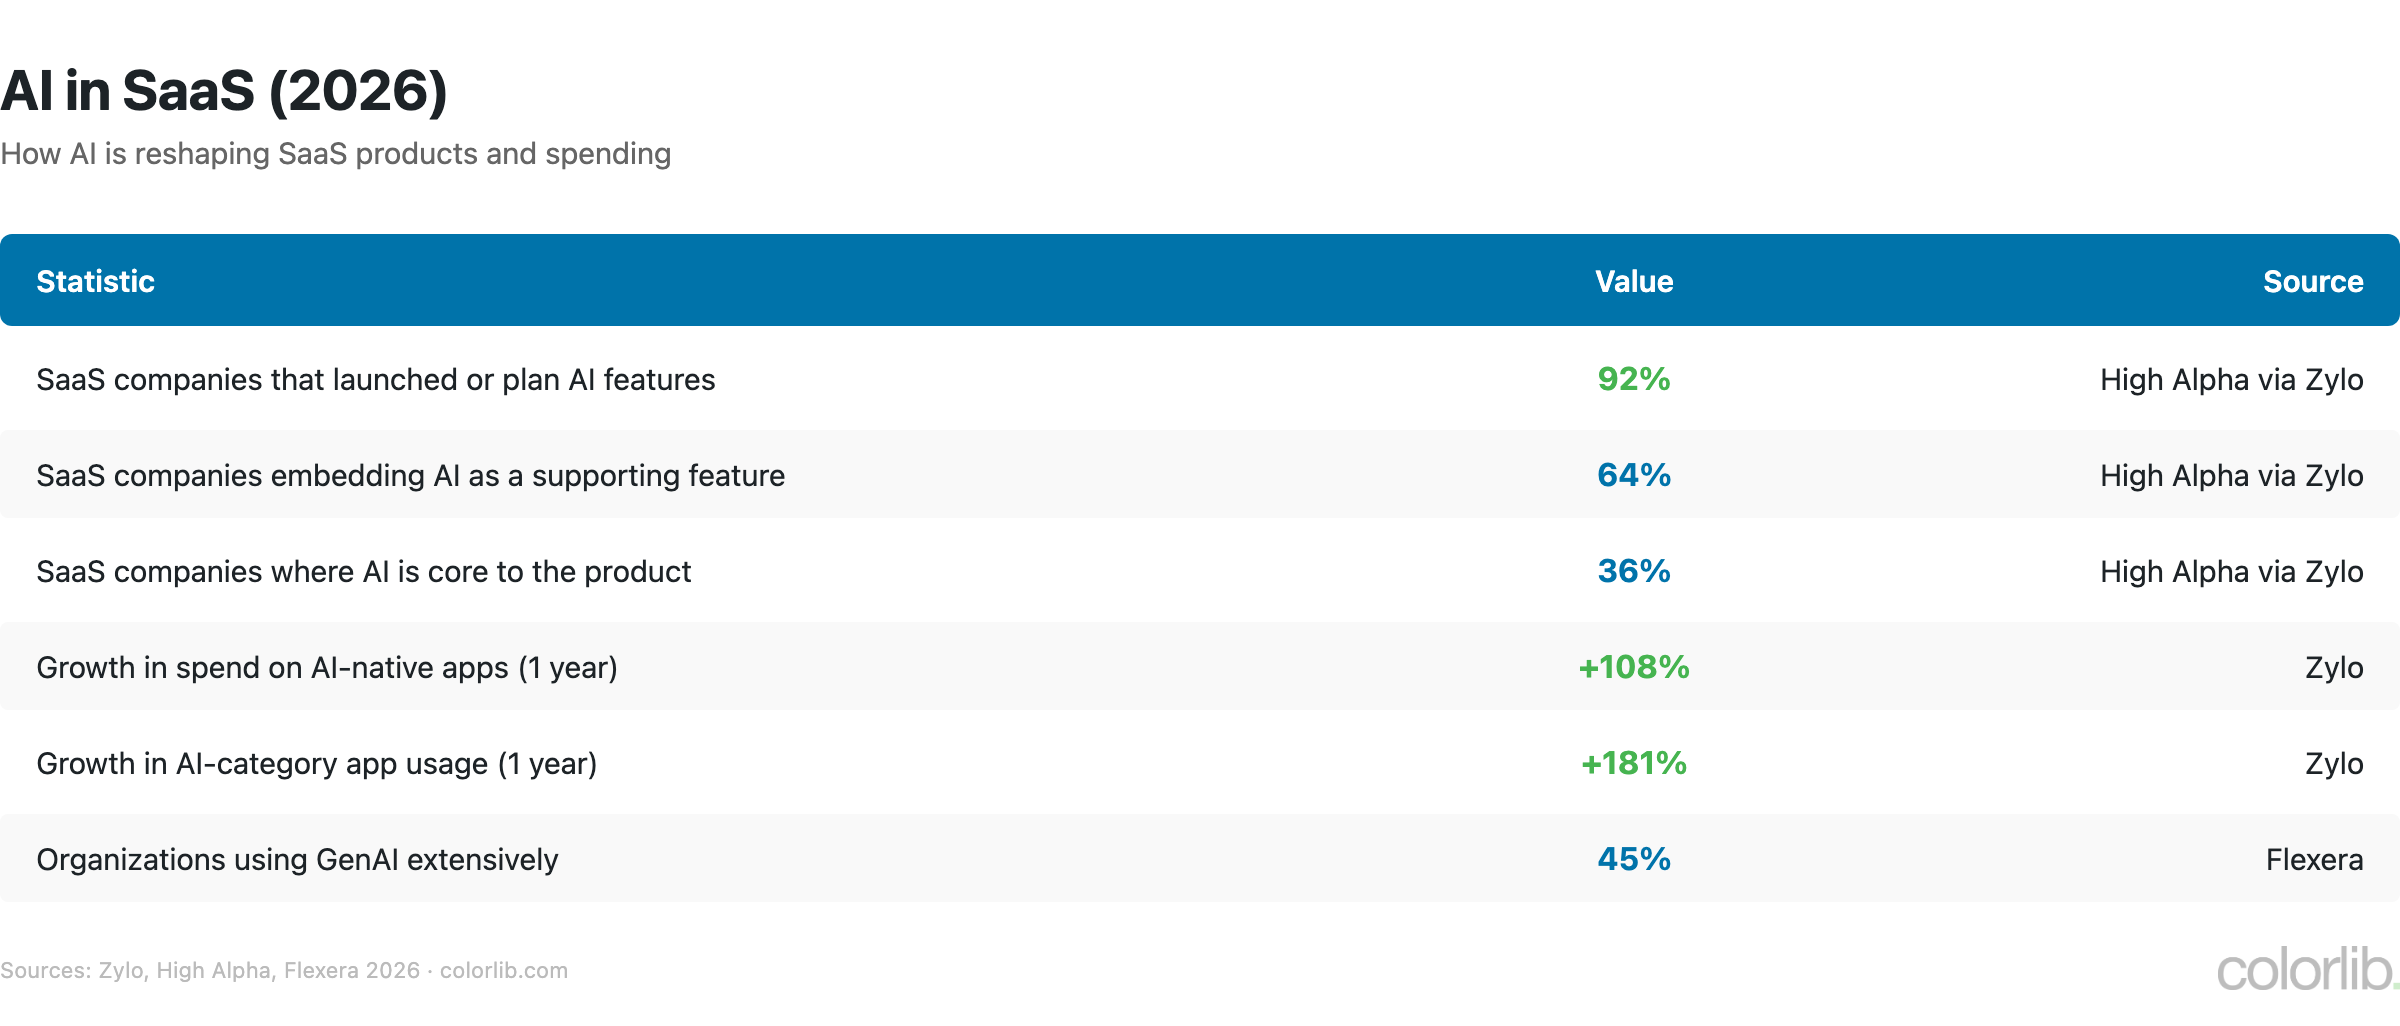
Table of AI in SaaS statistics: 92% of SaaS companies launched or plan AI features, AI-native app spend up 108%, AI app usage up 181%, 45% of organizations use GenAI extensively
StatisticValueSource
SaaS companies that launched or plan AI features92%High Alpha via Zylo
SaaS companies embedding AI as a supporting feature64%High Alpha via Zylo
SaaS companies where AI is core to the product36%High Alpha via Zylo
Growth in spend on AI-native apps (1 year)+108% (+393% at large enterprises)Zylo
Growth in AI-category app usage (1 year)+181%Zylo
AI-powered tools billed purely on usage/tokensMore than a thirdBetterCloud
Organizations using GenAI extensively45% (up from 36%)Flexera

SaaS Security

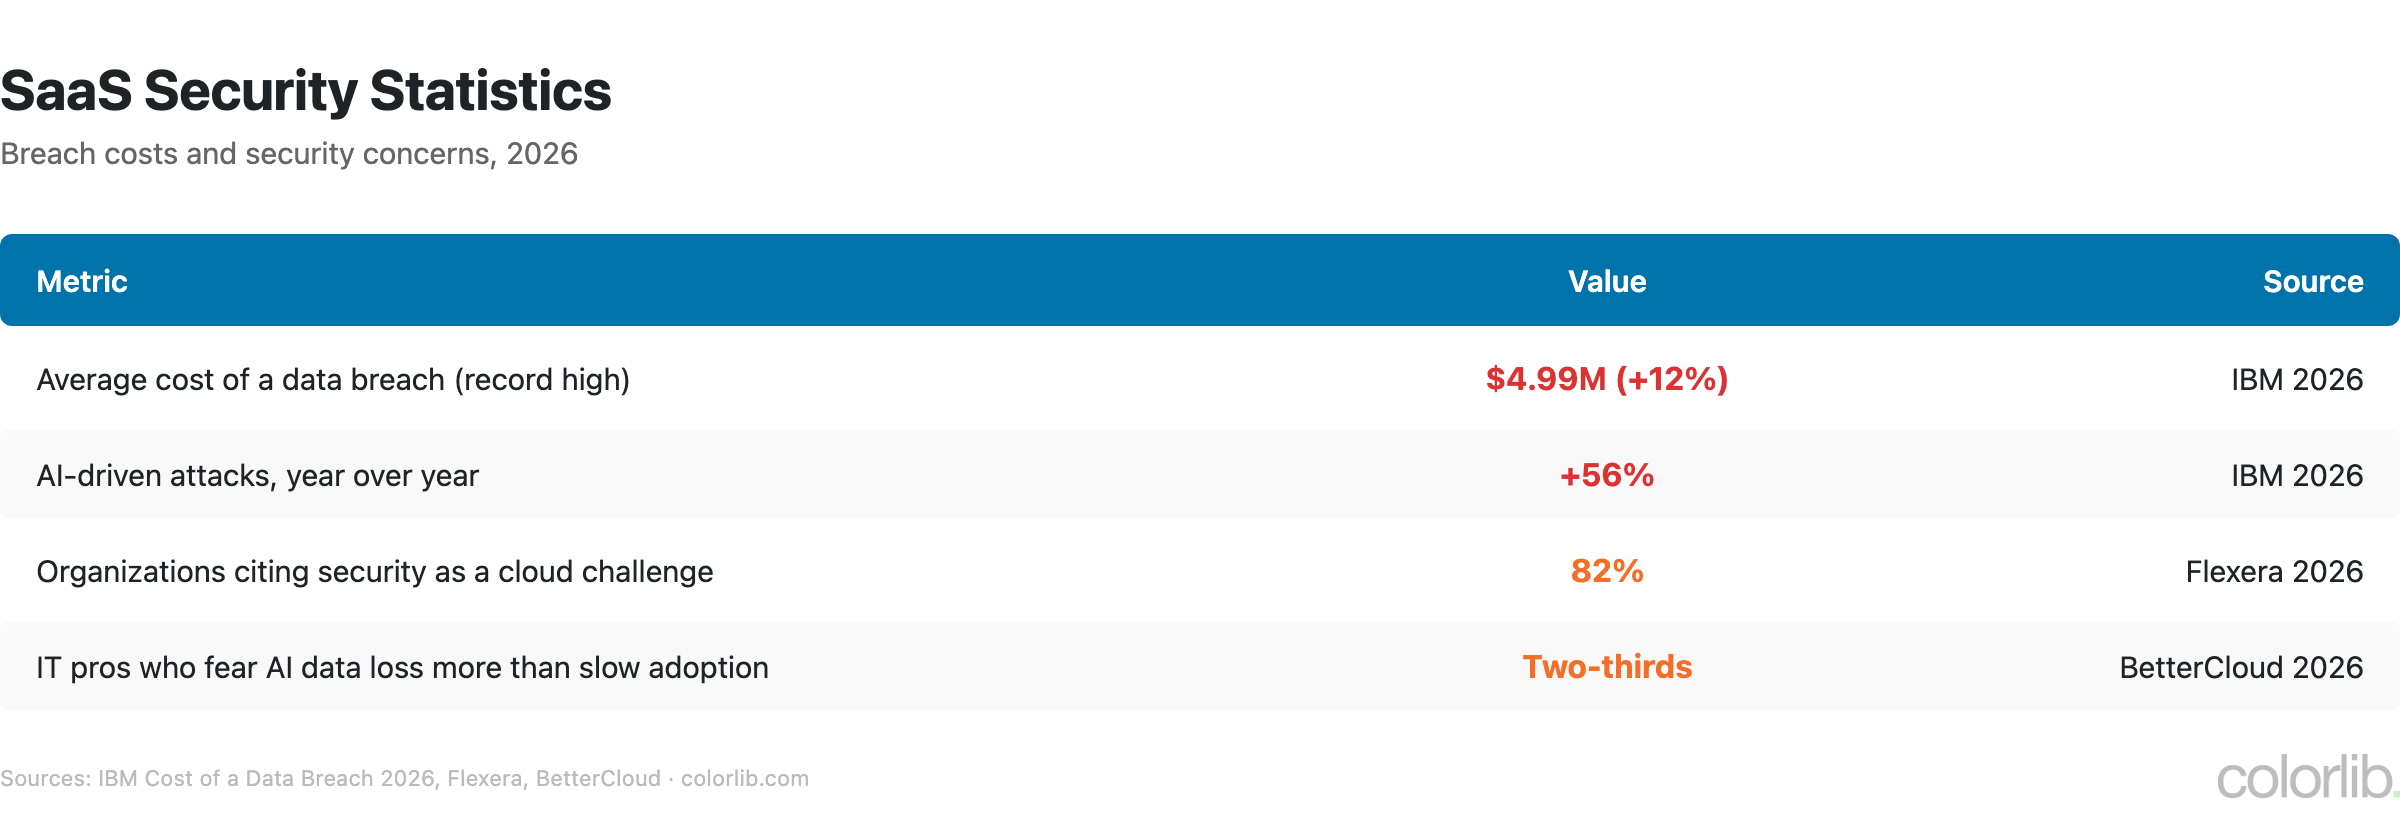
Table of SaaS security statistics: average data breach cost $4.99 million, AI-driven attacks up 56%, security cited by 82% as a cloud challenge, two-thirds fear AI data loss
  • Average cost of a data breach: $4.99 million globally, up 12% and a record high (IBM Cost of a Data Breach 2026)
  • AI-driven attacks rose 56% year over year (IBM 2026)
  • Two-thirds of IT professionals fear AI data loss far more than slow AI adoption (BetterCloud, 2026)
  • Security is the second-biggest cloud challenge, cited by 82% of organizations (Flexera 2026)

SaaS vs On-Premise

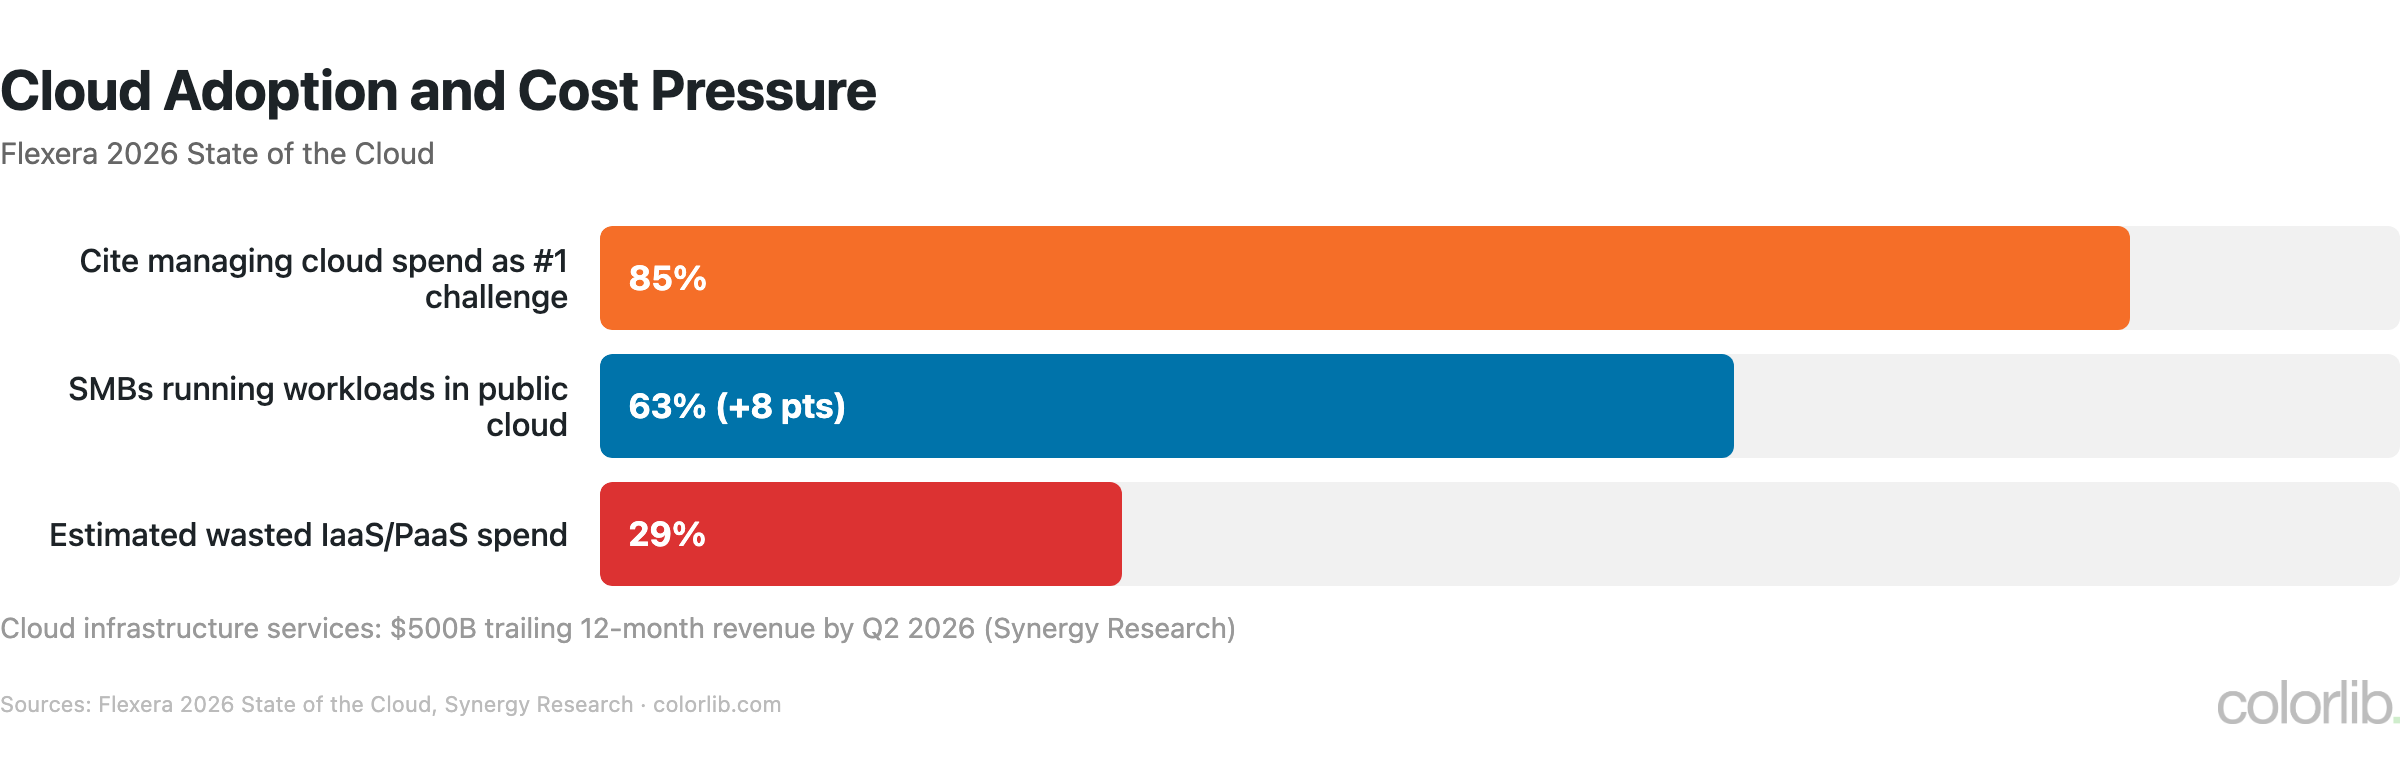
Bar chart of cloud adoption: 85% of organizations cite managing cloud spend as their top challenge, 63% of SMBs run workloads in the public cloud, 29% of IaaS and PaaS spend is wasted
  • 63% of SMBs now run workloads in the public cloud, up 8 points in a year (Flexera 2026)
  • Managing cloud spend is the #1 cloud challenge, cited by 85% of organizations
  • Estimated wasted IaaS and PaaS spend rose to 29%, the first increase after five years of decline, as AI adds complexity
  • Cloud infrastructure services hit $500 billion in trailing 12-month revenue by Q2 2026 (Synergy Research)

SaaS Funding & Investment

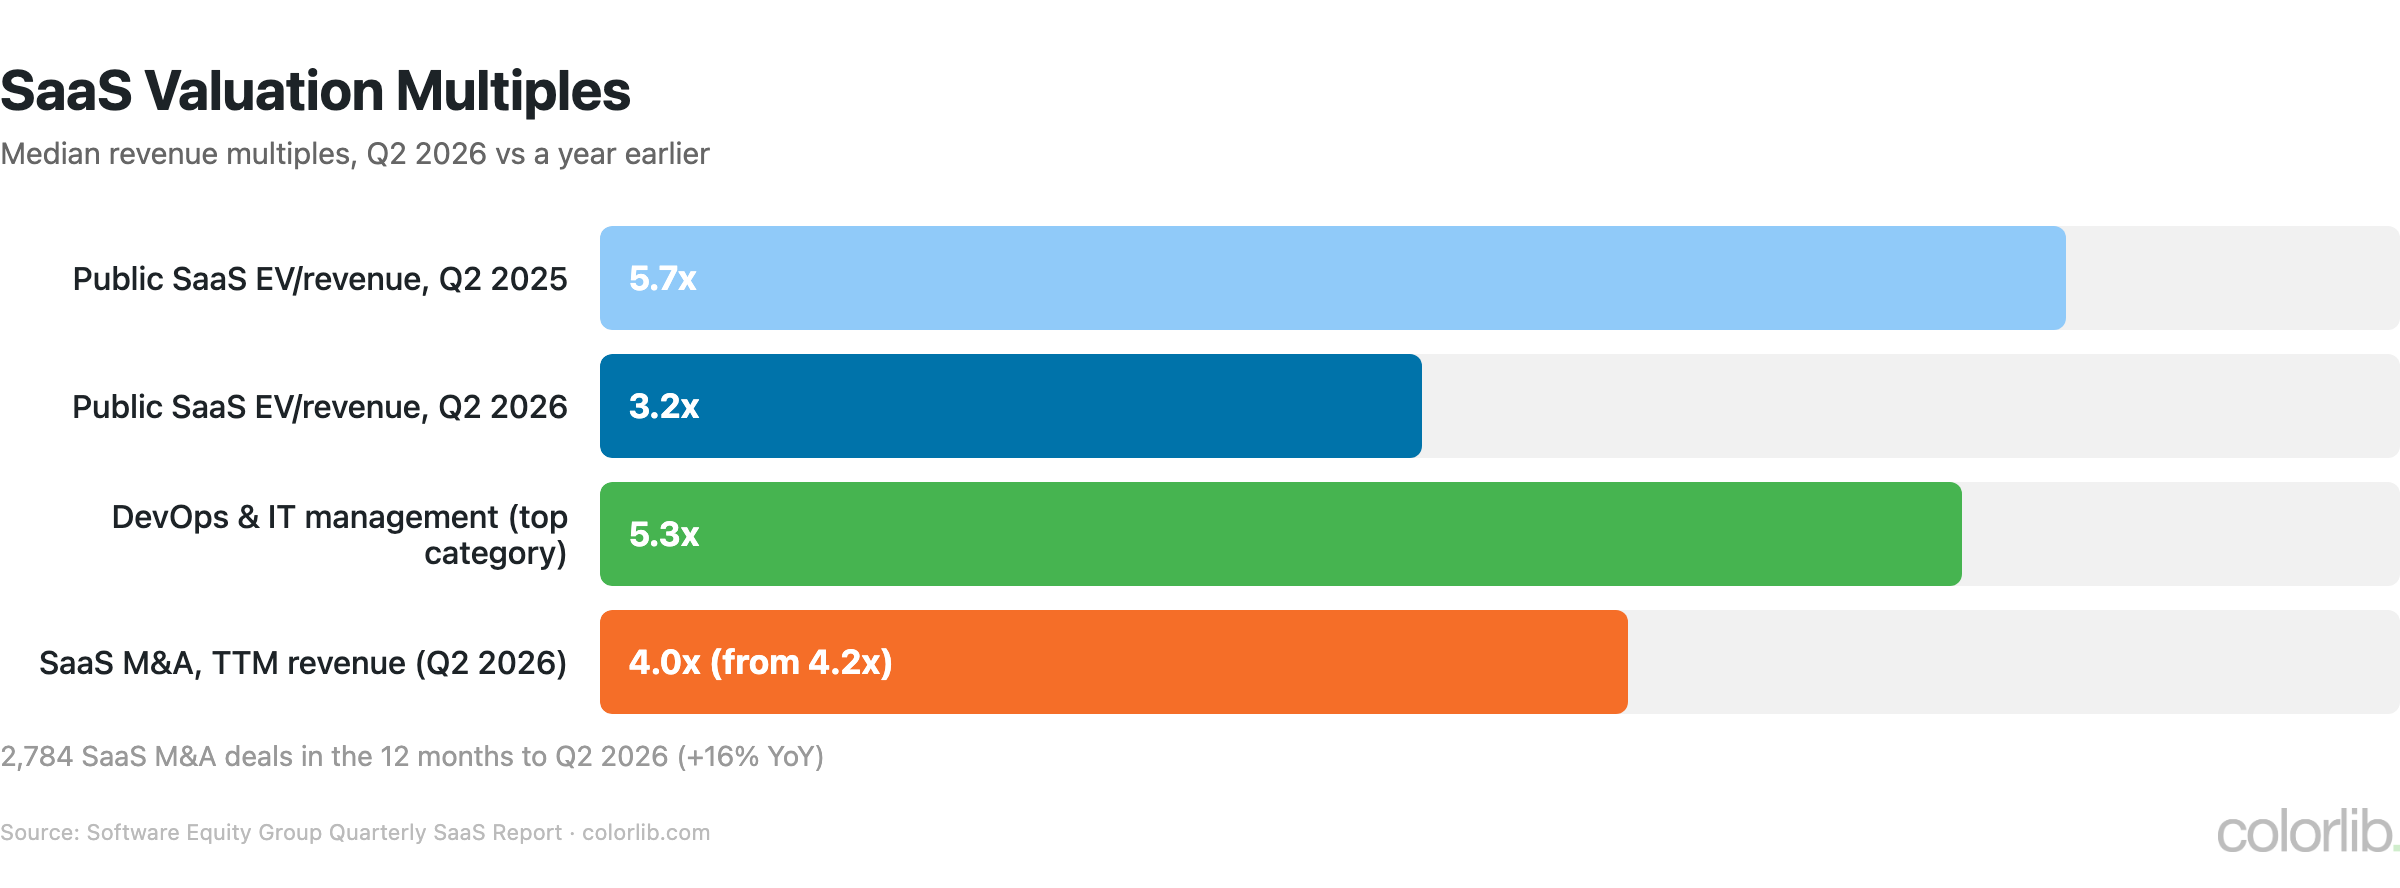
Bar chart of SaaS valuation multiples: public SaaS median EV to revenue fell from 5.7x to 3.2x, M&A median 4.0x, DevOps and IT management 5.3x in Q2 2026
MetricValueSource
SaaS M&A transactions (2025)~2,700SEG
SaaS M&A deals, trailing 12 months to Q2 20262,784 (+16% YoY)SEG
Median SaaS M&A multiple (Q2 2026)4.0x TTM revenue (from 4.2x)SEG
Median public SaaS EV/revenue (Q2 2026)3.2x (from 5.7x a year earlier)SEG
Highest-valued public category (Q2 2026)DevOps & IT management at 5.3xSEG
Median private B2B SaaS growth rate (2026)22%SaaS Capital

Vertical SaaS

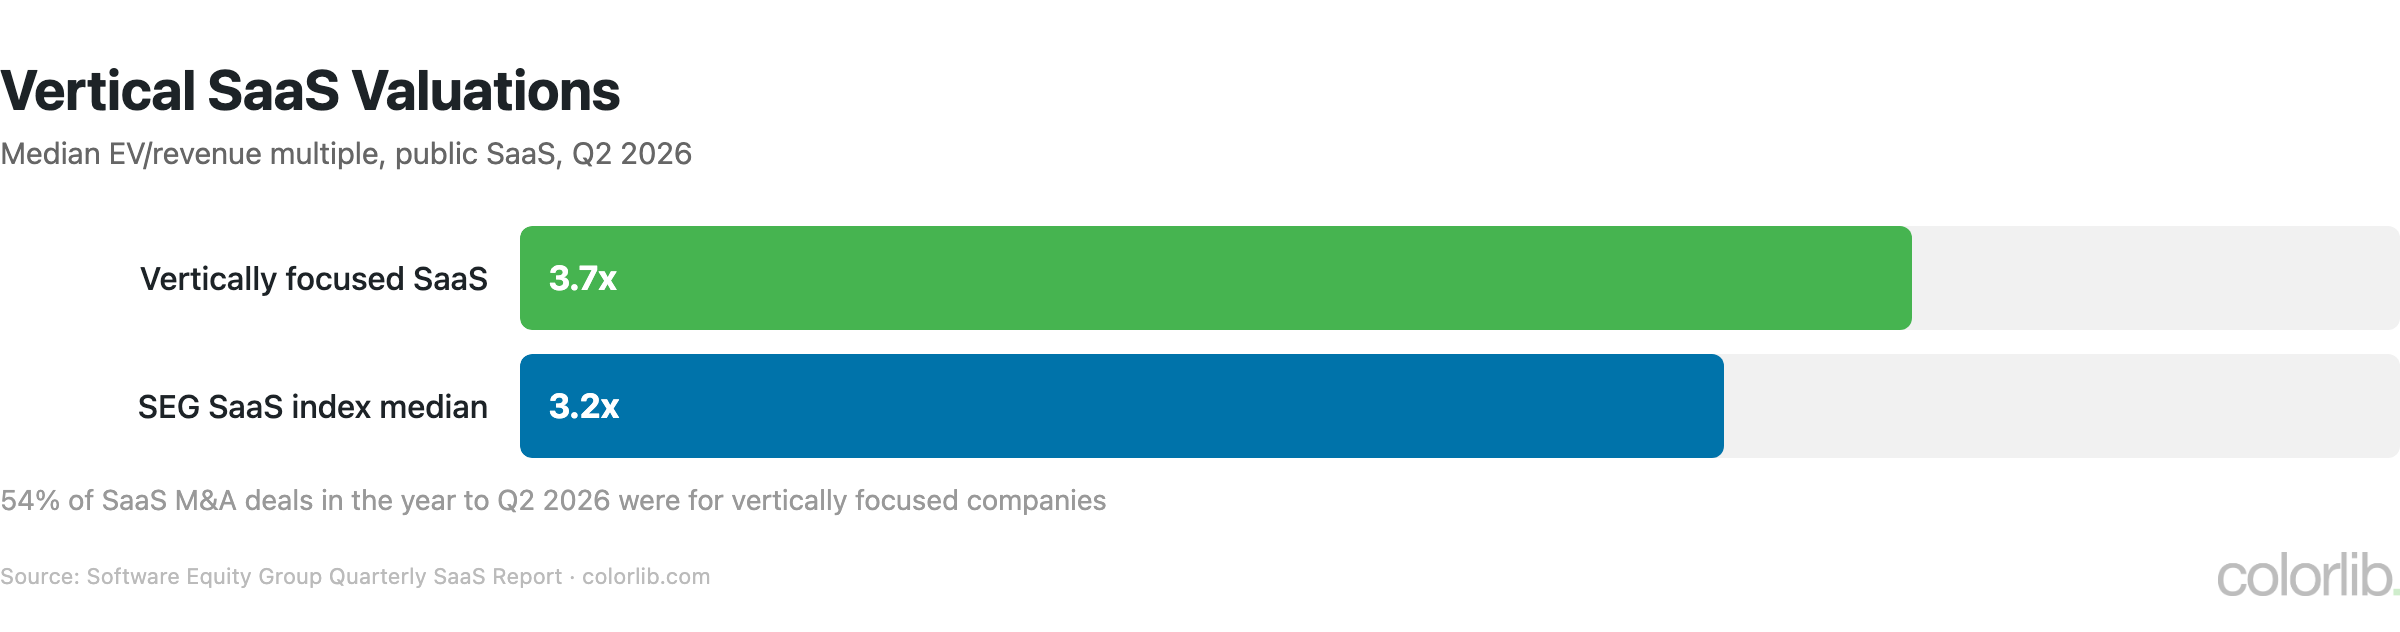
Bar chart comparing vertical SaaS at a median 3.7x revenue with the 3.2x public SaaS index median in Q2 2026; 54% of SaaS M&A deals were vertically focused
  • 54% of SaaS M&A deals in the year to Q2 2026 were for vertically focused companies (SEG)
  • Vertically focused public SaaS companies traded at a median 3.7x revenue in Q2 2026, above the 3.2x index median
  • Buyers reward software that is deeply embedded in workflows, with durable growth and retention (SEG)

Cloud Infrastructure Under SaaS

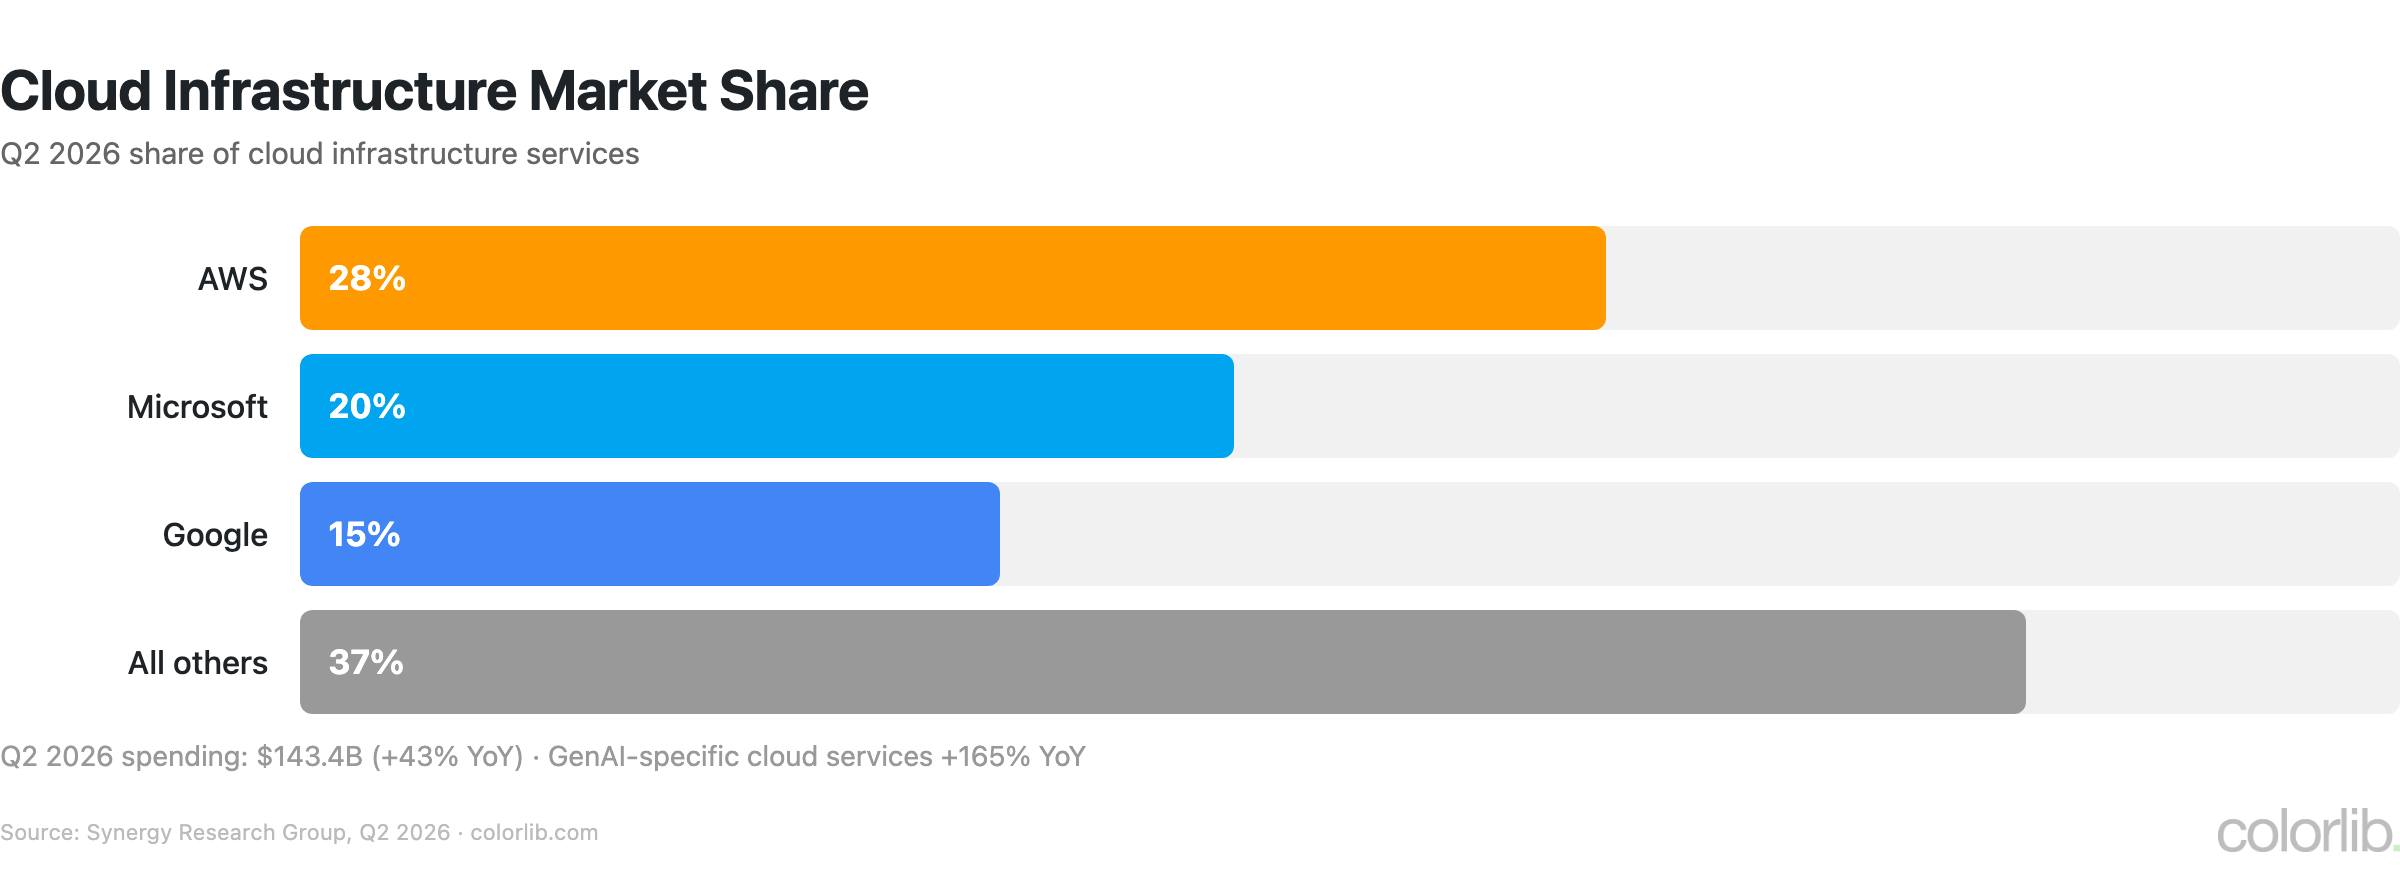
Bar chart of Q2 2026 cloud infrastructure market share: AWS 28%, Microsoft 20%, Google 15%, all others 37%
  • Q2 2026 cloud infrastructure share: AWS 28%, Microsoft 20%, Google 15%, so the Big 3 hold 63% (Synergy Research)
  • Cloud infrastructure spending hit $143.4 billion in Q2 2026 alone, up 43% year over year
  • GenAI-specific cloud services grew 165% year over year, and neoclouds like CoreWeave and Nebius are among the fastest-growing providers

Key Takeaways

  1. SaaS keeps growing. A $488.5B market in 2026, heading for $855.6B by 2031, with the US making up about half.
  2. AI is the new moat. 92% of SaaS companies have launched or plan AI features, and spend on AI-native apps more than doubled in a year.
  3. Cost control is the hidden challenge. Average SaaS spend rose 8% to $55.7M, 53% of licenses go unused for a year, and 78% of IT leaders hit surprise AI or usage charges.
  4. Usage-based pricing is spreading. 61% of SaaS companies used or tested it by 2023, and more than a third of AI tools are now billed purely on consumption.
  5. Security costs keep rising. The average data breach now costs $4.99M, and AI-driven attacks rose 56%.
  6. Vertical SaaS leads M&A. 54% of SaaS deals are vertically focused, even as public SaaS multiples compressed to 3.2x revenue.

Sources

Frequently Asked Questions

How big is the SaaS market in 2026?

Statista projects the global SaaS market will reach $488.5 billion in 2026 and grow at 11.9% a year to $855.6 billion by 2031. The US accounts for $254.9 billion, about half the total.

How many SaaS apps does the average company use?

Organizations in Zylo’s 2026 SaaS Management Index run an average of 305 SaaS apps (median 240) and spend an average of $55.7 million a year on them. BetterCloud’s State of SaaS 2026 finds portfolios growing again after two years of consolidation, driven by an average of 27 AI-powered apps per organization.

What is the average SaaS churn rate?

Recurly’s benchmarks (July 2026 data) put SaaS churn at 3.22%, the lowest of the six verticals it tracks, versus 3.60% across all industries. Roughly a third of churn is involuntary, caused by failed payments. Top-quartile software businesses keep churn at 1.78% or below.

What percentage of SaaS licenses go unused?

BetterCloud reports that 53% of an organization’s licenses go a full year without a login. Waste is getting harder to control as AI add-ons and usage-based pricing spread: 78% of IT leaders hit unexpected AI or consumption charges in the past year, and 61% cut projects because of unplanned SaaS cost increases (Zylo).

Is the SaaS market still growing?

Yes. Statista expects the SaaS market to grow 11.9% a year from 2026 to 2031, and Zylo found average SaaS spend per organization rose 8% in a year. Growth is slowing for individual vendors, though: the median private B2B SaaS company grew 22%, down from 25% in 2024 (SaaS Capital), and public SaaS valuations fell to a median 3.2x revenue in Q2 2026 (SEG).

Was this article helpful?
YesNo

Rok is a professional content creator, WordPress developer and enthusiastic marketer who spends most of his day behind the screen, working on ULTIDA, client projects and listening to black metal. But he never misses a daily workout to get the blood flow going.

Comments (0)

Leave a Reply

Your email address will not be published. Required fields are marked *

Back To Top

Download this template

Enter your email to get the free download link. We'll also send you occasional updates about new templates.

If you wish to withdraw your consent and stop hearing from us, simply click the unsubscribe link at the bottom of every email we send or contact us at [email protected]. We value and respect your personal data and privacy. To view our privacy policy, please visit our website. By submitting this form, you agree that we may process your information in accordance with these terms.