Brand posts on Instagram averaged a 0.48% engagement rate in 2025, and Rival IQ’s all-industry median slipped 17% to 0.30%. Carousels now edge out Reels, image engagement is falling fastest, and smaller accounts still post the highest rates. Here are 75+ Instagram engagement statistics covering benchmarks by content type, follower count, industry, posting times, and advertising for 2026.
Key Instagram Engagement Statistics (2026)
Average brand engagement rate: 0.48% per post in 2025 (Socialinsider)
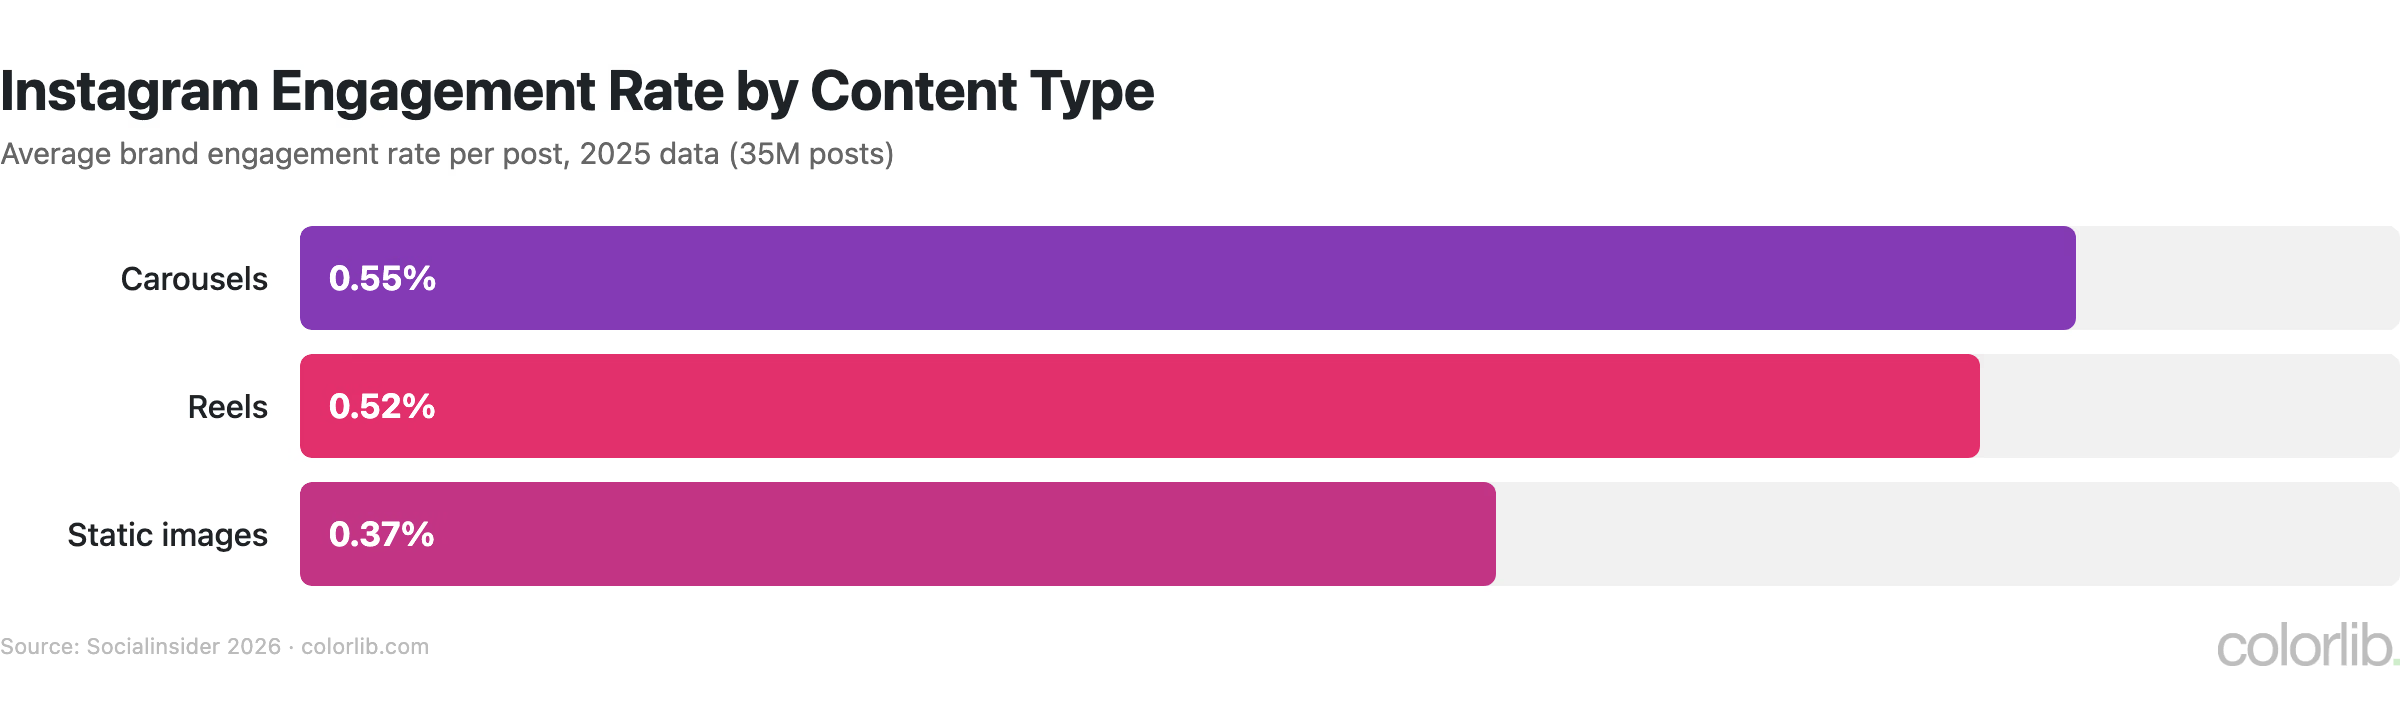
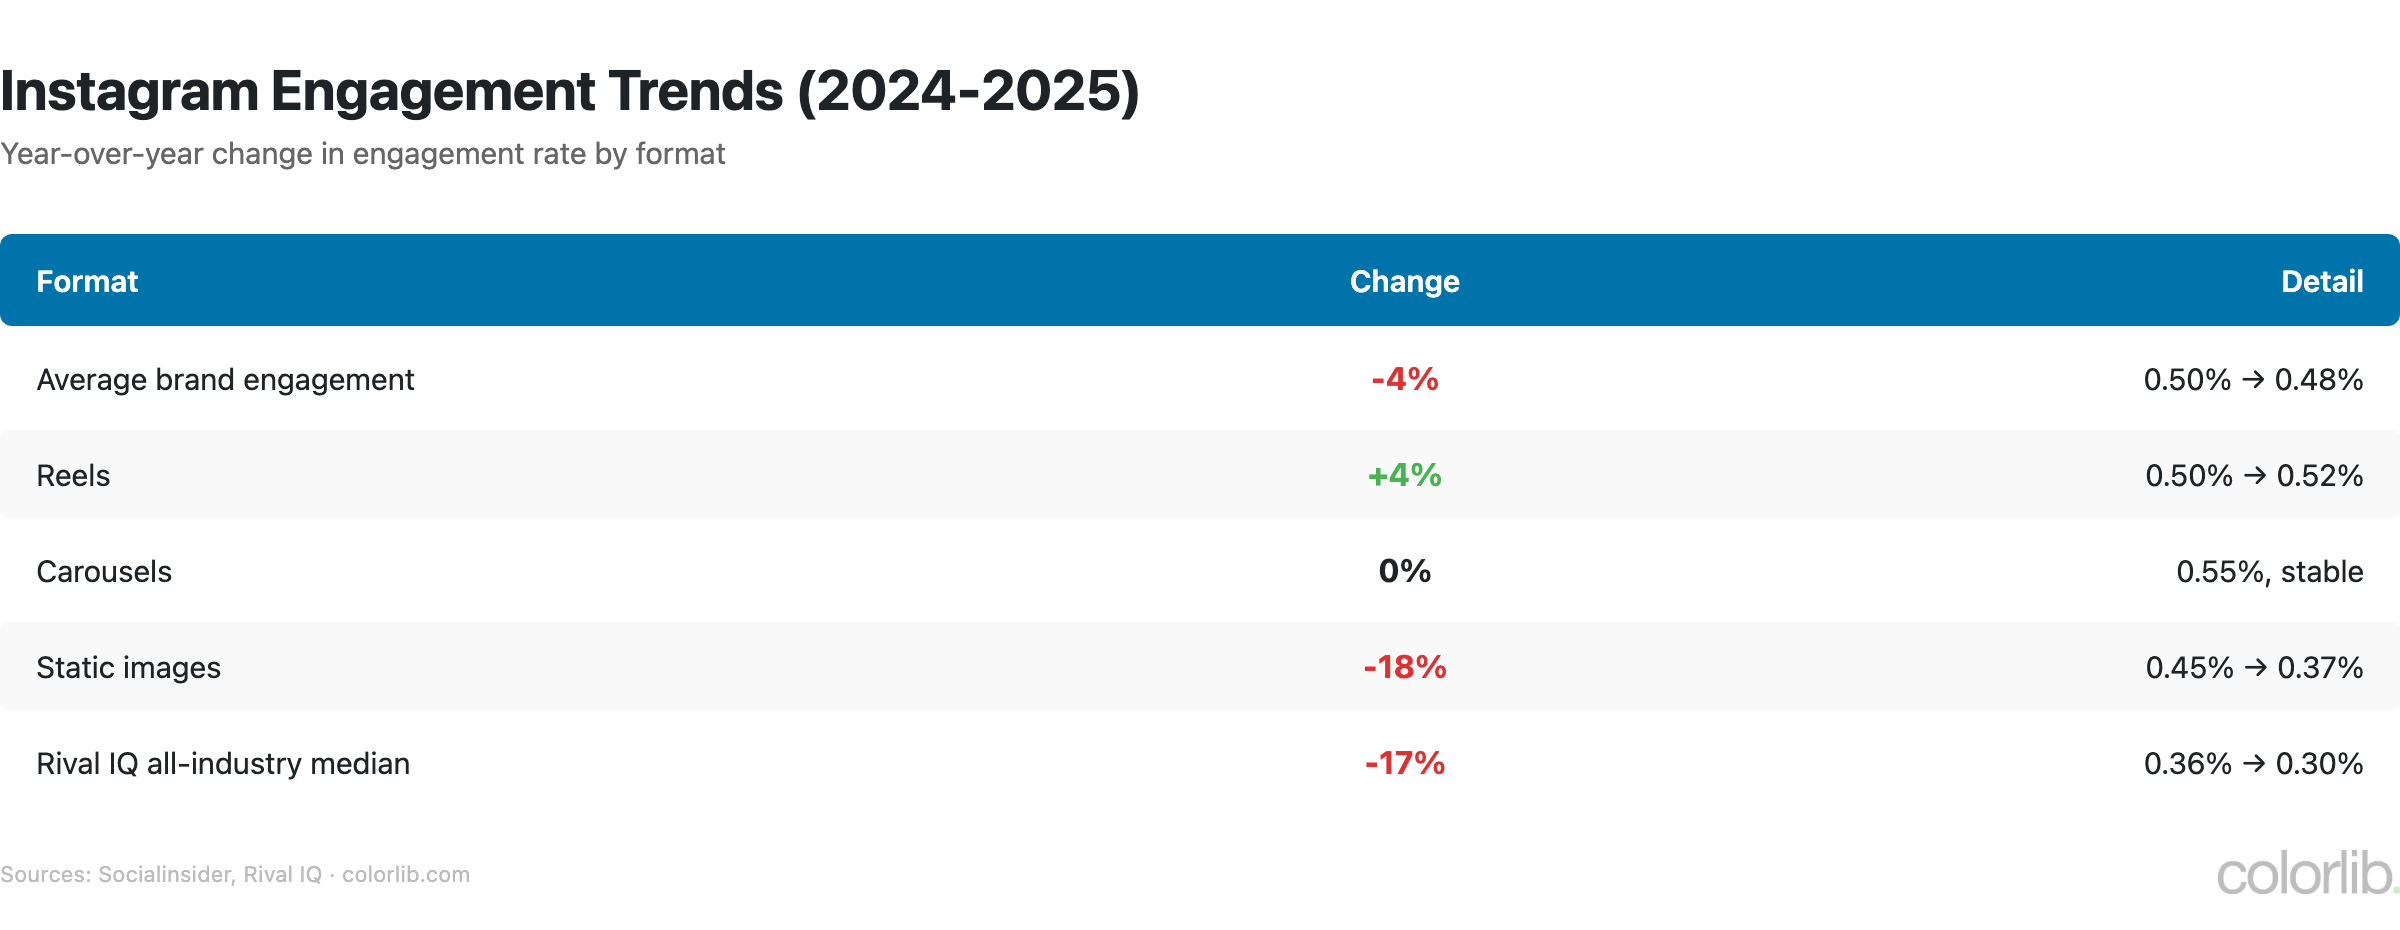
Carousel engagement: 0.55%, the highest of any format (Socialinsider)
Reels engagement: 0.52%, up 4% year over year (Socialinsider)
Image engagement: 0.37%, down 18% year over year (Socialinsider)
All-industry median engagement: 0.30%, down from 0.36% (Rival IQ)
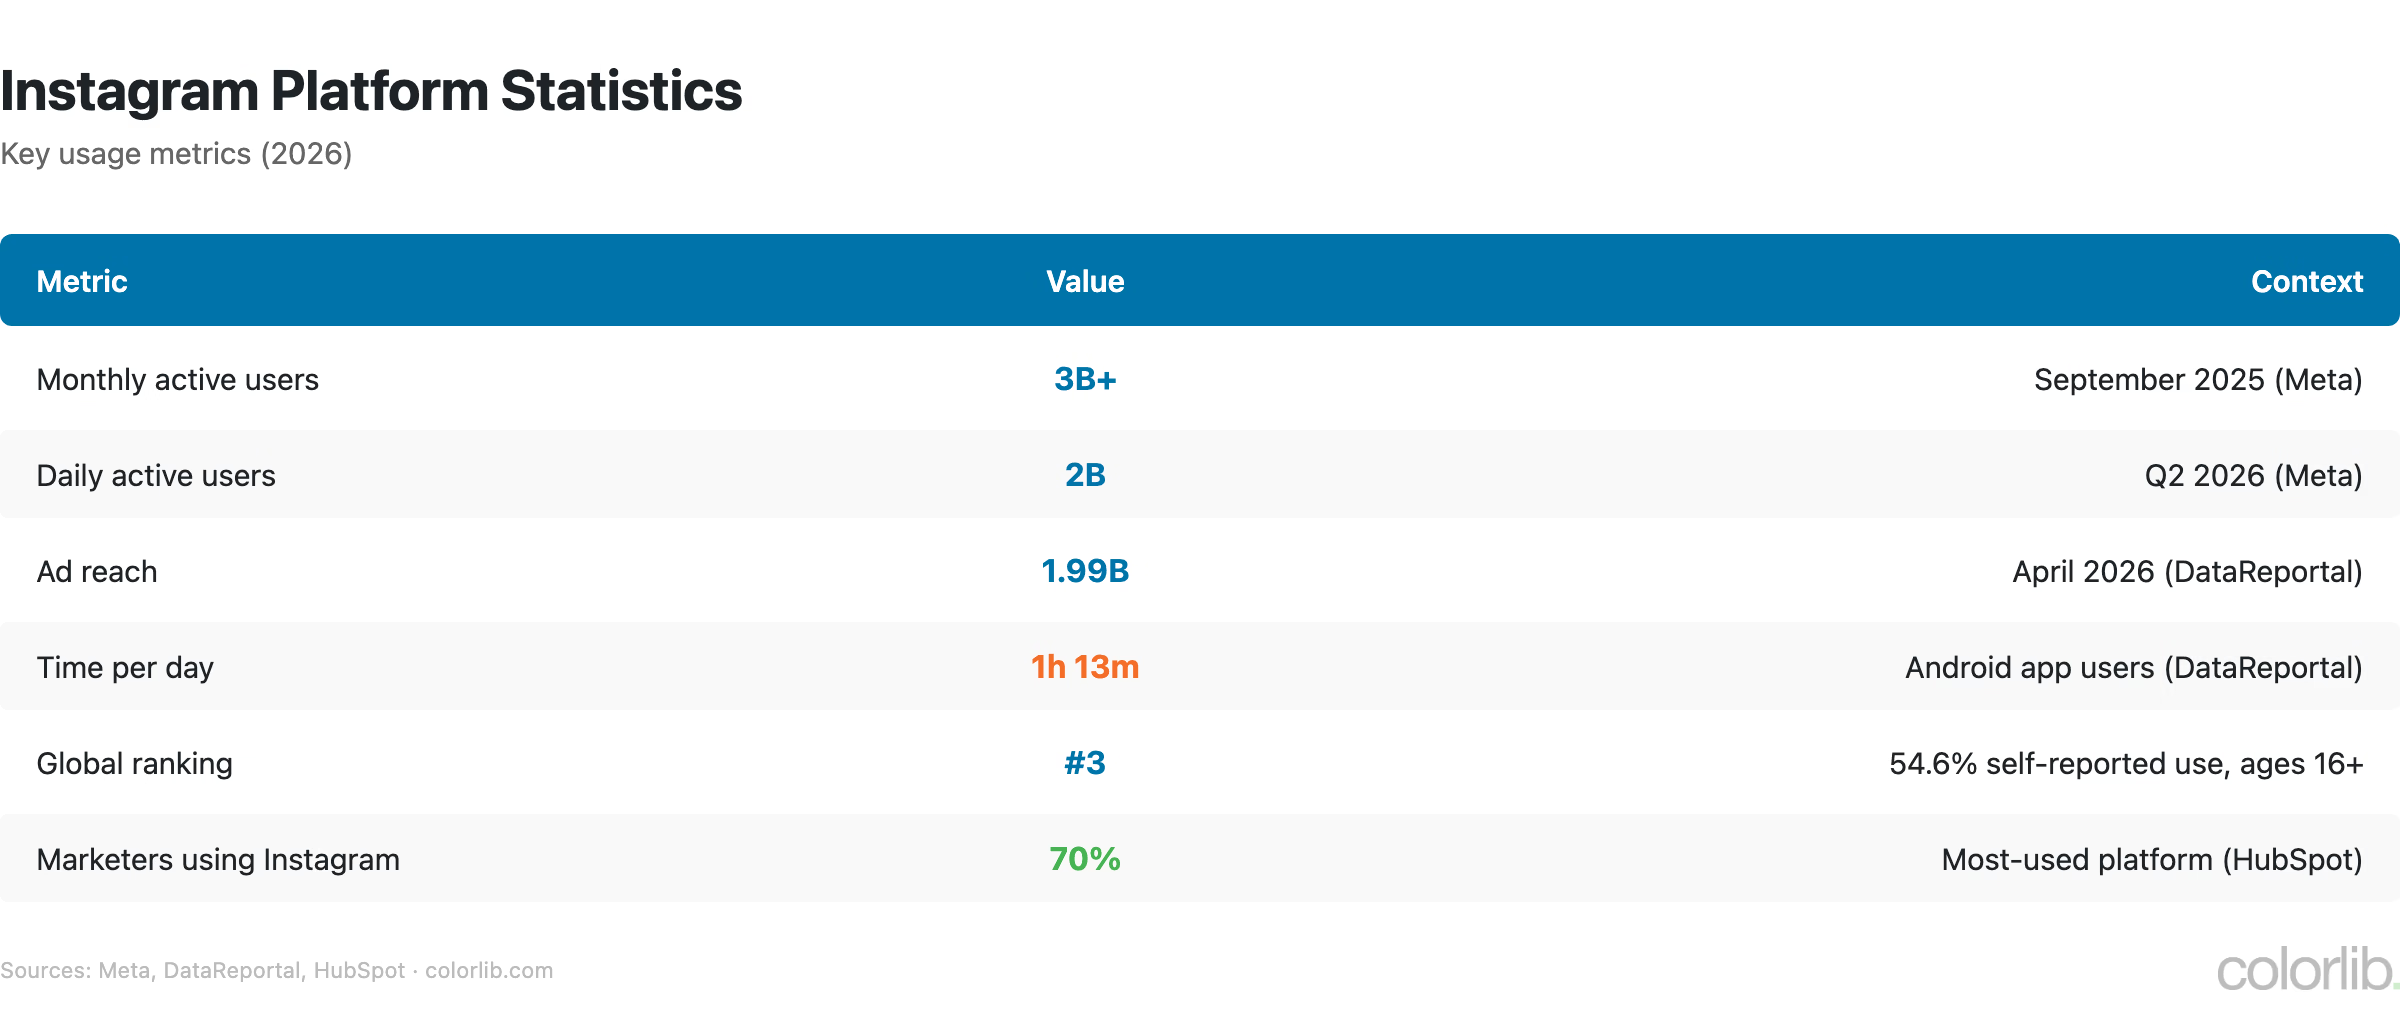
3 billion+ monthly active users and 2 billion daily actives (Meta)
Instagram is used by 70% of marketers, more than any other platform (HubSpot)
Carousels and Reels lead, images fade. Carousels (0.55%) and Reels (0.52%) held up in 2025 while image engagement fell 18%.
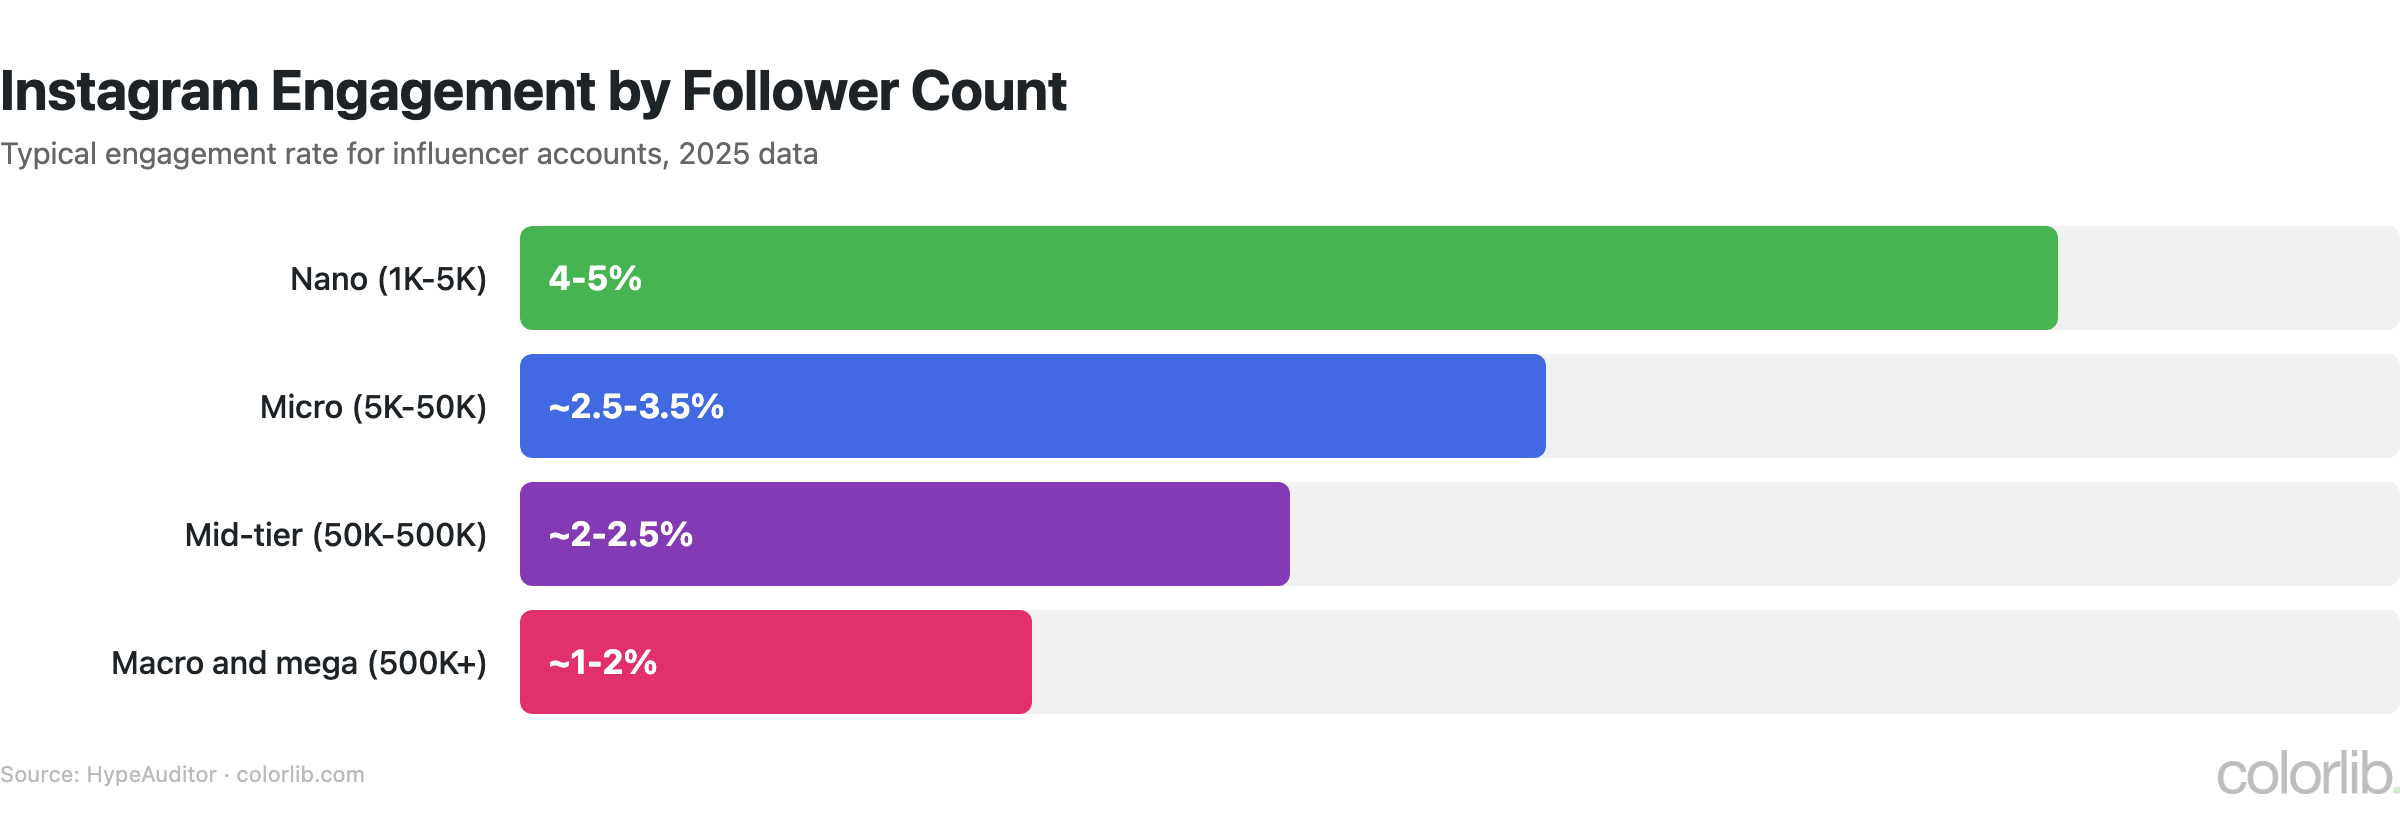
Smaller accounts win on engagement. Accounts with 1K-5K followers engage at roughly 4-5%, against about 1-2% for 500K+.
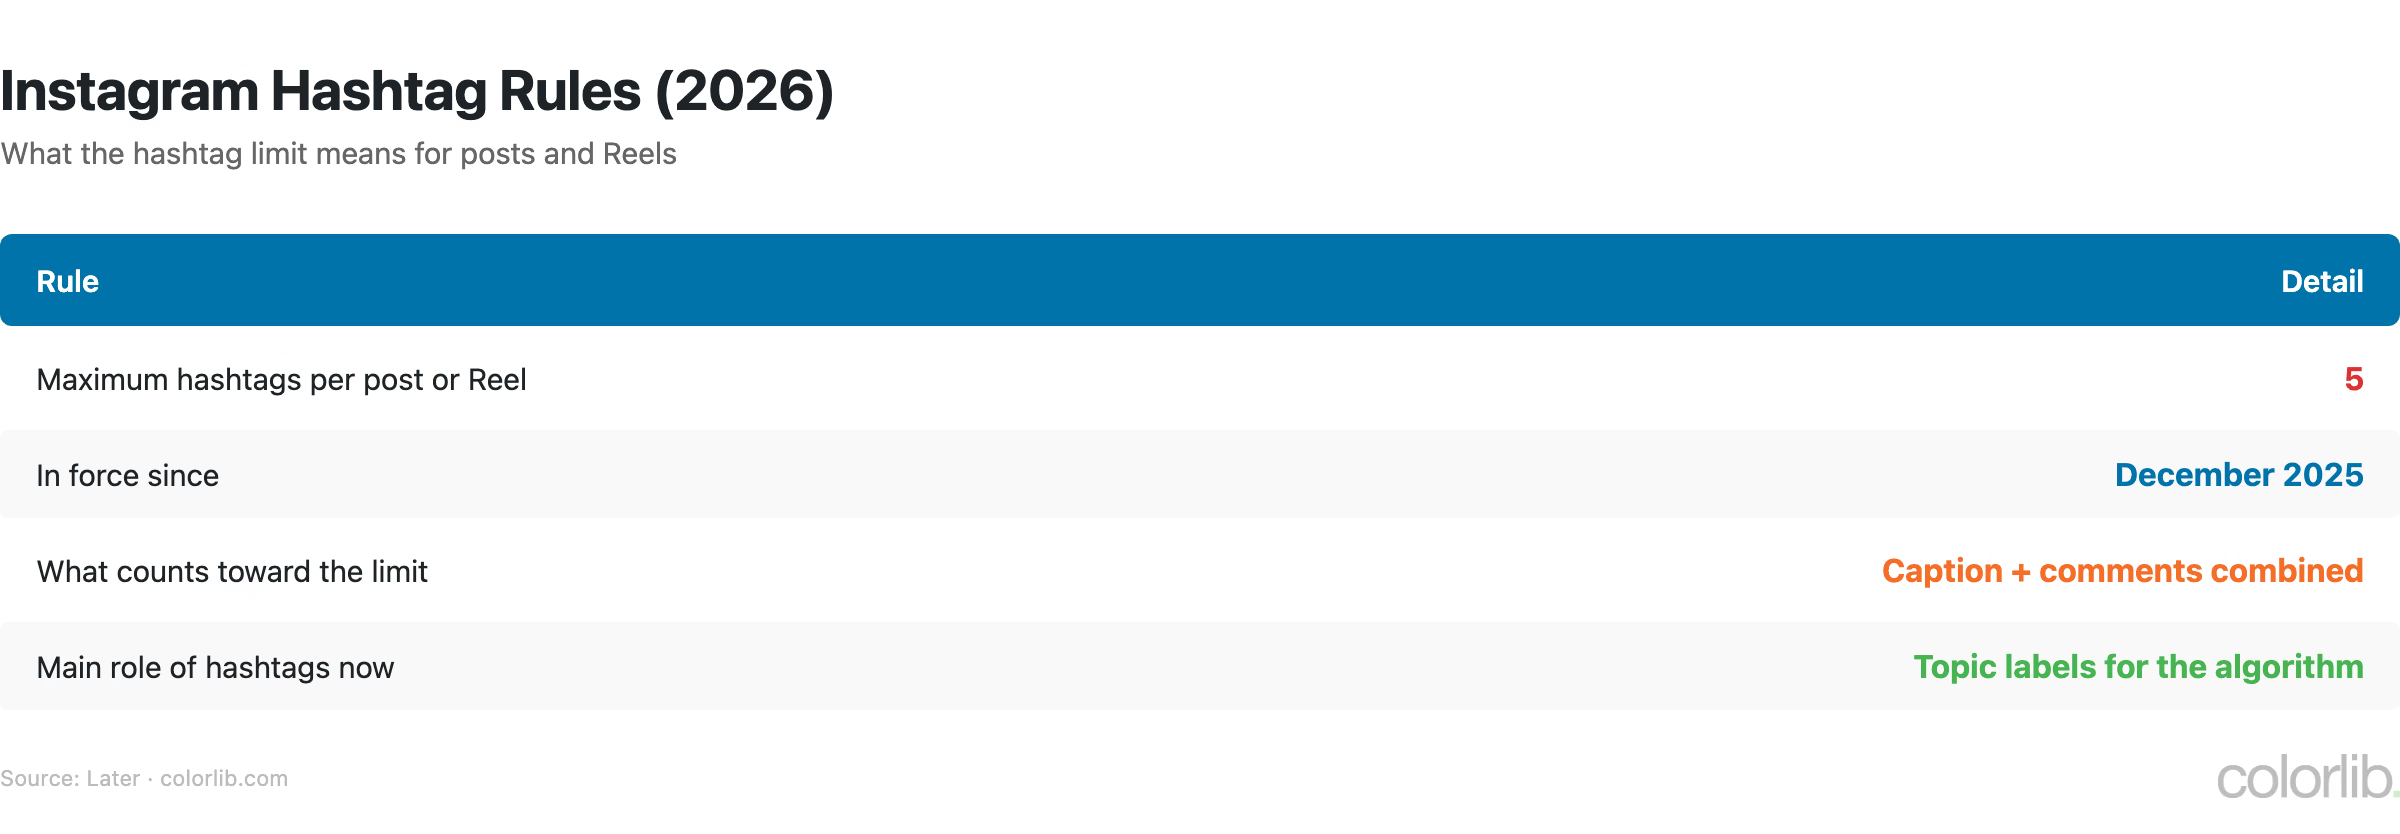
Five hashtags is now the ceiling. Instagram caps posts and Reels at 5 hashtags, so pick precise topic labels.
Carousels are underrated. They are the most-saved and most resilient format, yet brands post them least often.
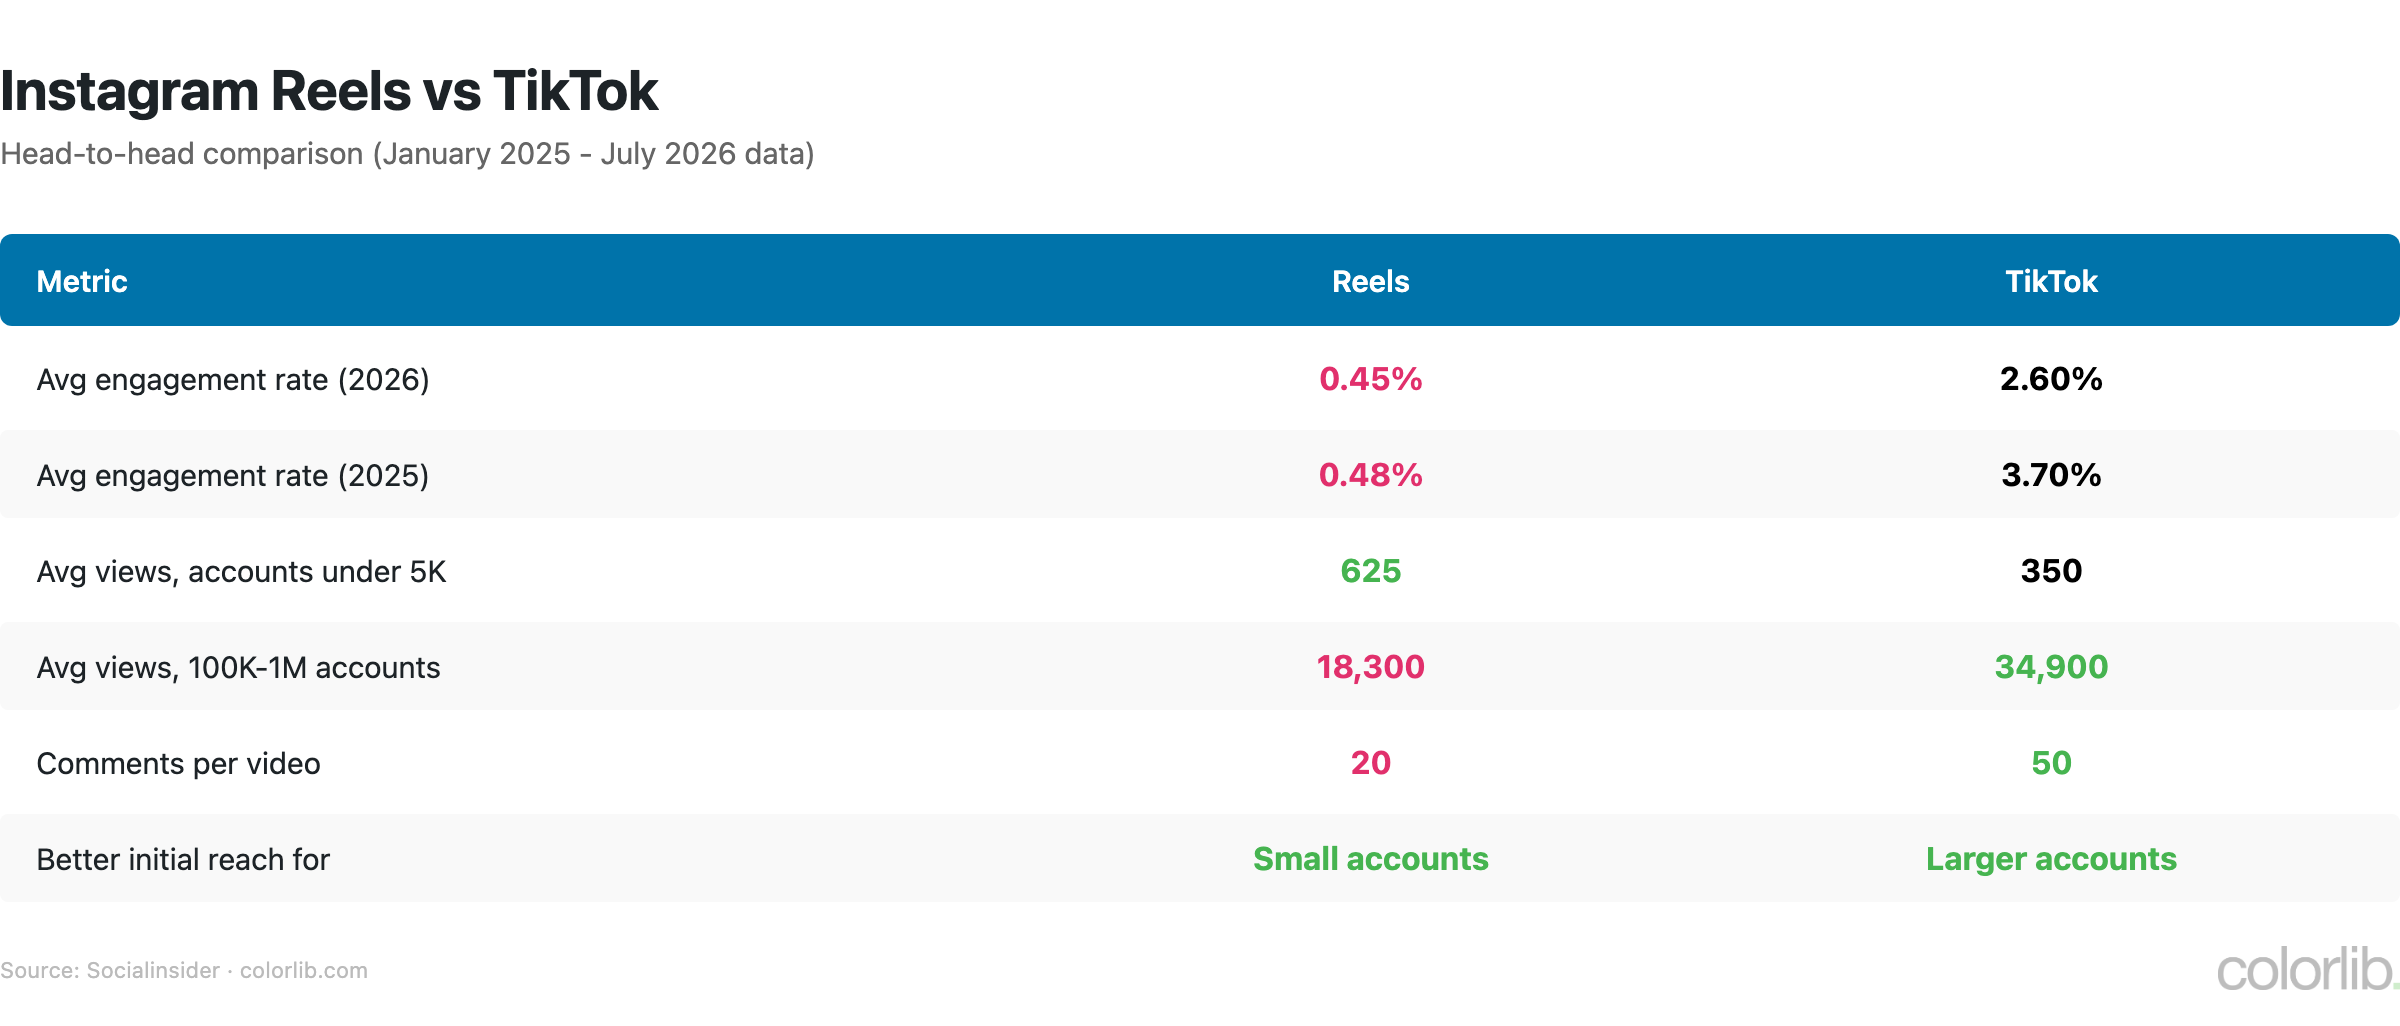
TikTok still out-engages Reels. TikTok averages 2.60% engagement against 0.45% for Reels in 2026, though Reels gives small accounts better early reach.
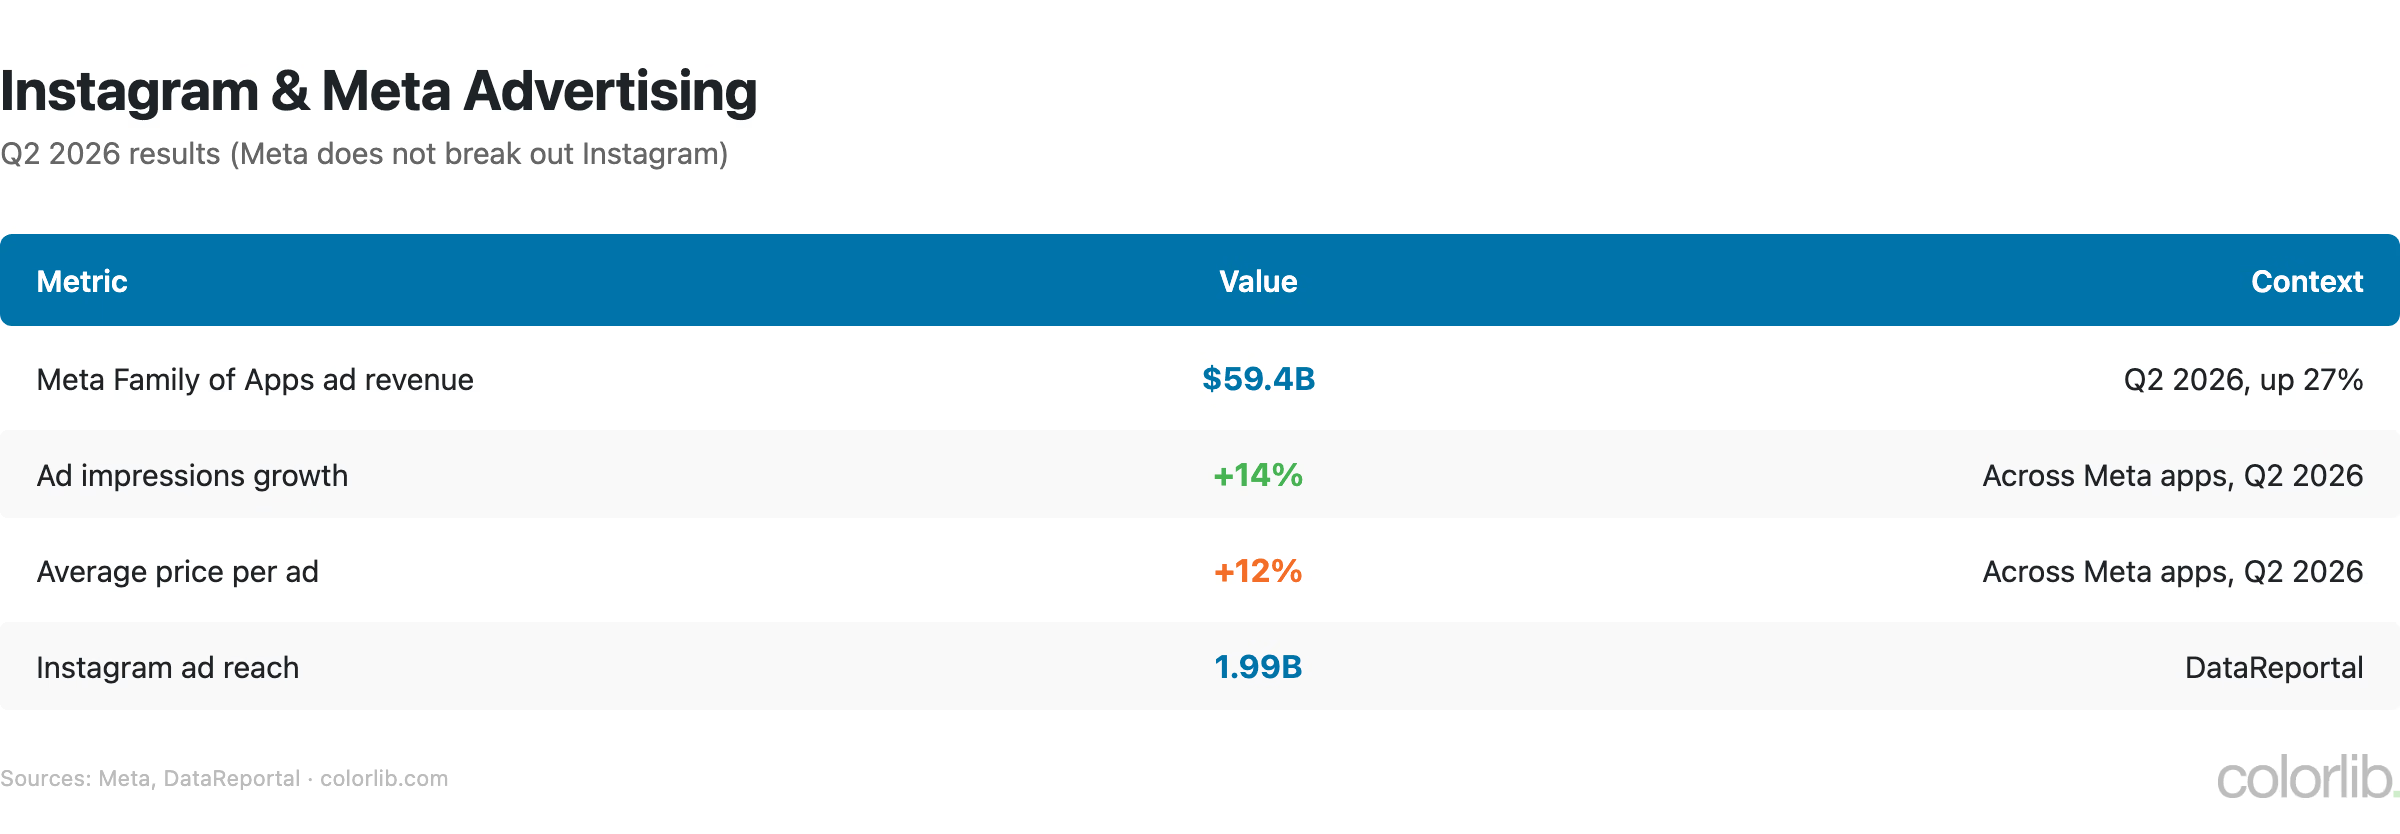
Paid reach is getting pricier. Meta’s average price per ad rose 12% in Q2 2026, so organic formats that earn saves and shares matter more.
Brand posts averaged 0.48% in 2025 (Socialinsider), and Rival IQ’s all-industry median was 0.30%. For a brand account, anything above 0.5% beats the average and above 1% is strong. Carousels (0.55%) and Reels (0.52%) perform best, and small creator accounts with 1K-5K followers typically see 4-5%.
Which content type gets the most engagement?
Carousels at 0.55%, narrowly ahead of Reels at 0.52%, based on Socialinsider’s analysis of 35 million posts from 2025. Static images get just 0.37%, down 18% in a year.
Are Instagram engagement rates declining?
Yes, slowly. Rival IQ’s all-industry median fell about 17% to 0.30% in 2025, and Socialinsider’s average slipped from 0.50% to 0.48%. Static image engagement fell 18%, while Reels grew 4% and carousels held steady.
What industry has the highest Instagram engagement?
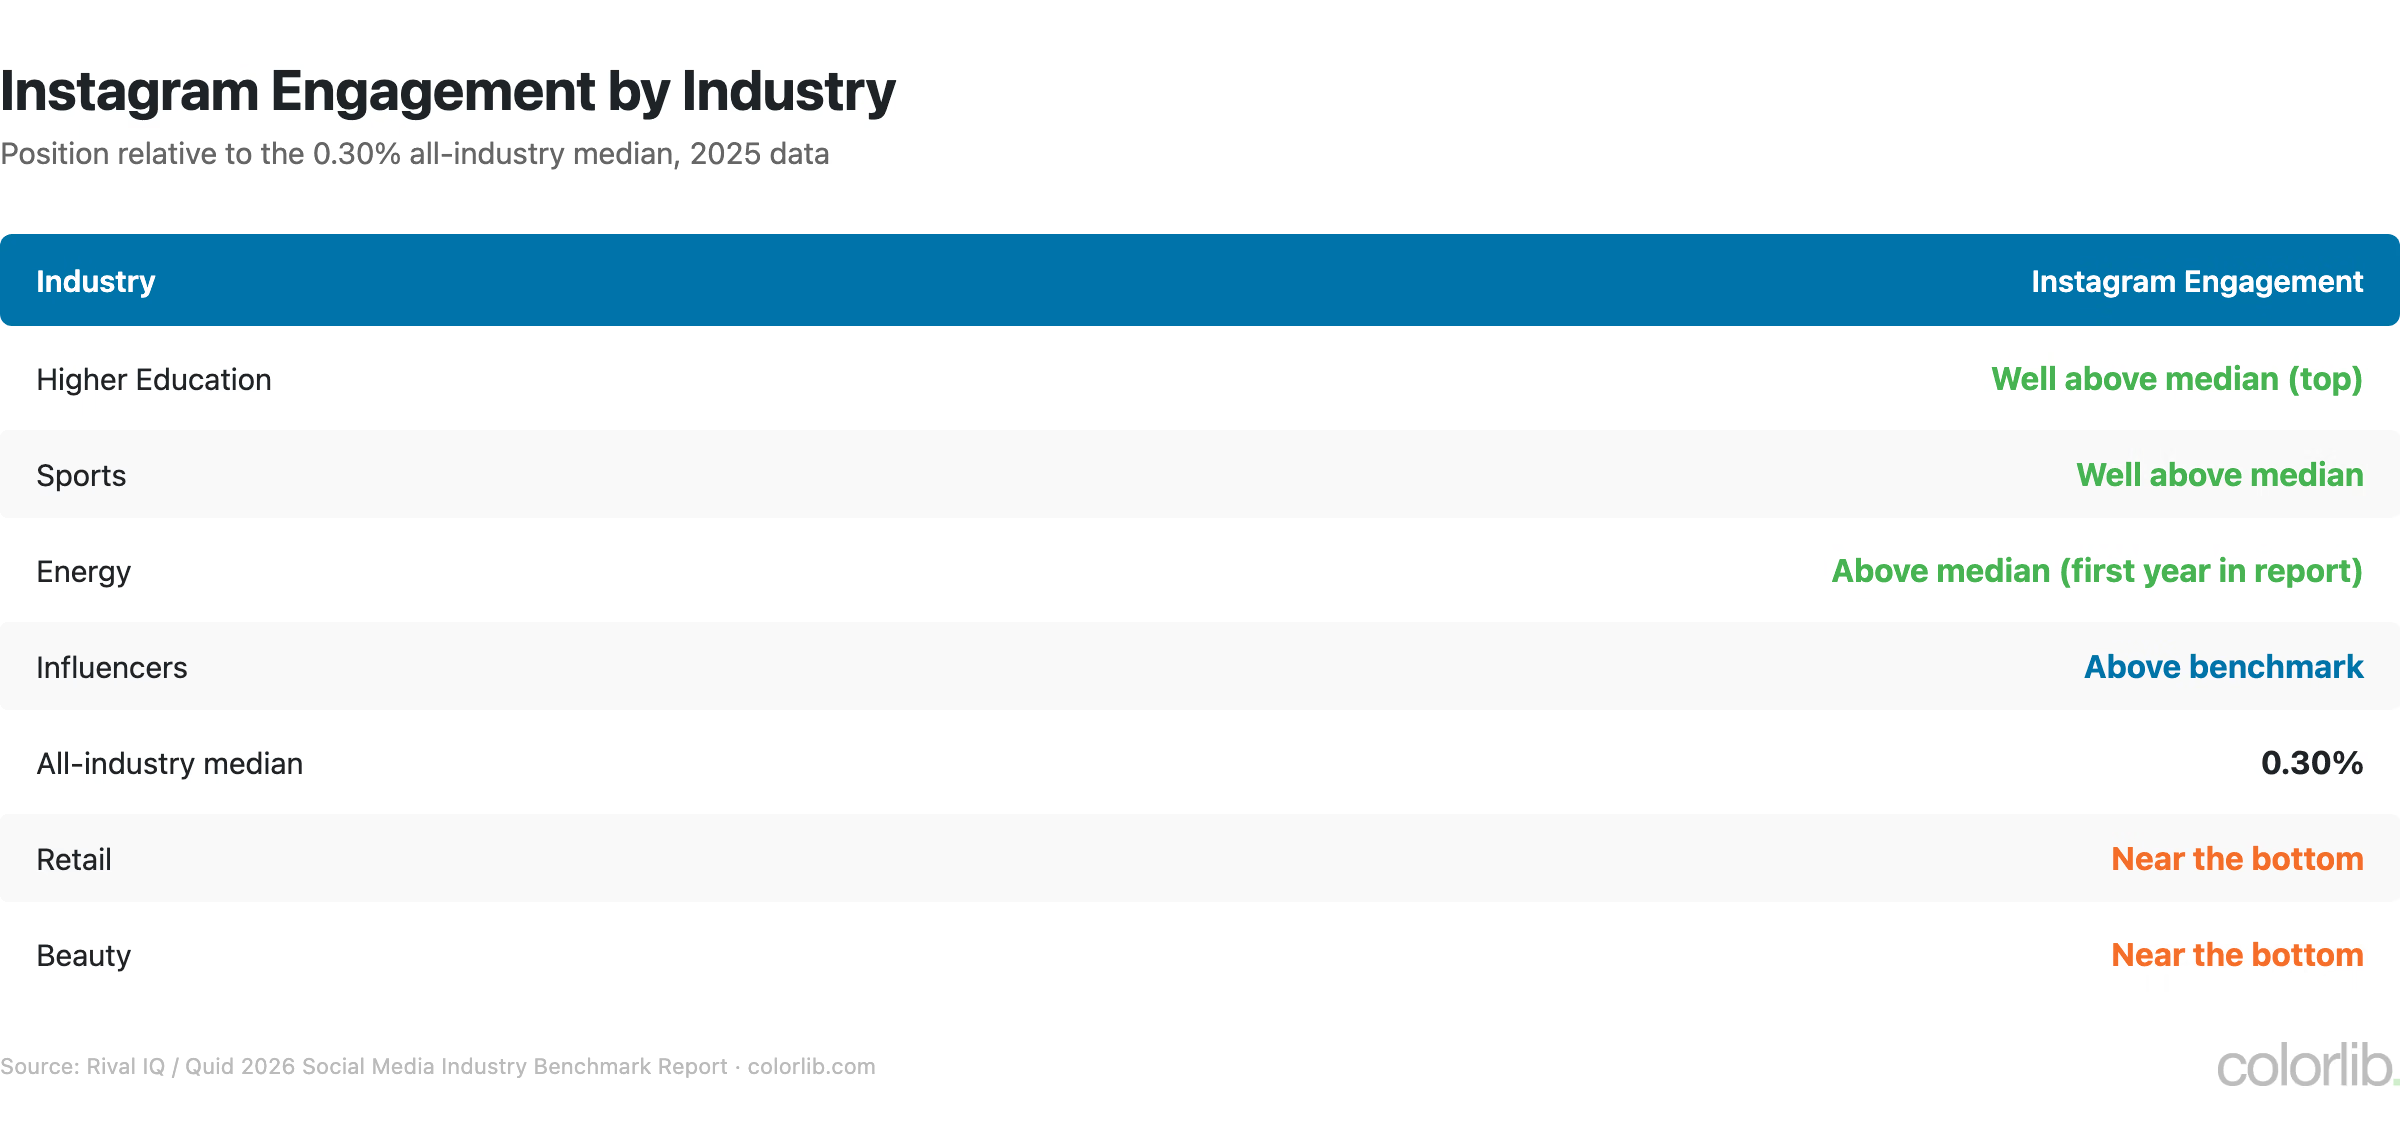
Higher Education and Sports lead Rival IQ’s 2026 benchmark, both well above the 0.30% all-industry median, and Energy made a strong debut. Retail and Beauty sit near the bottom.
What are the best times to post on Instagram?
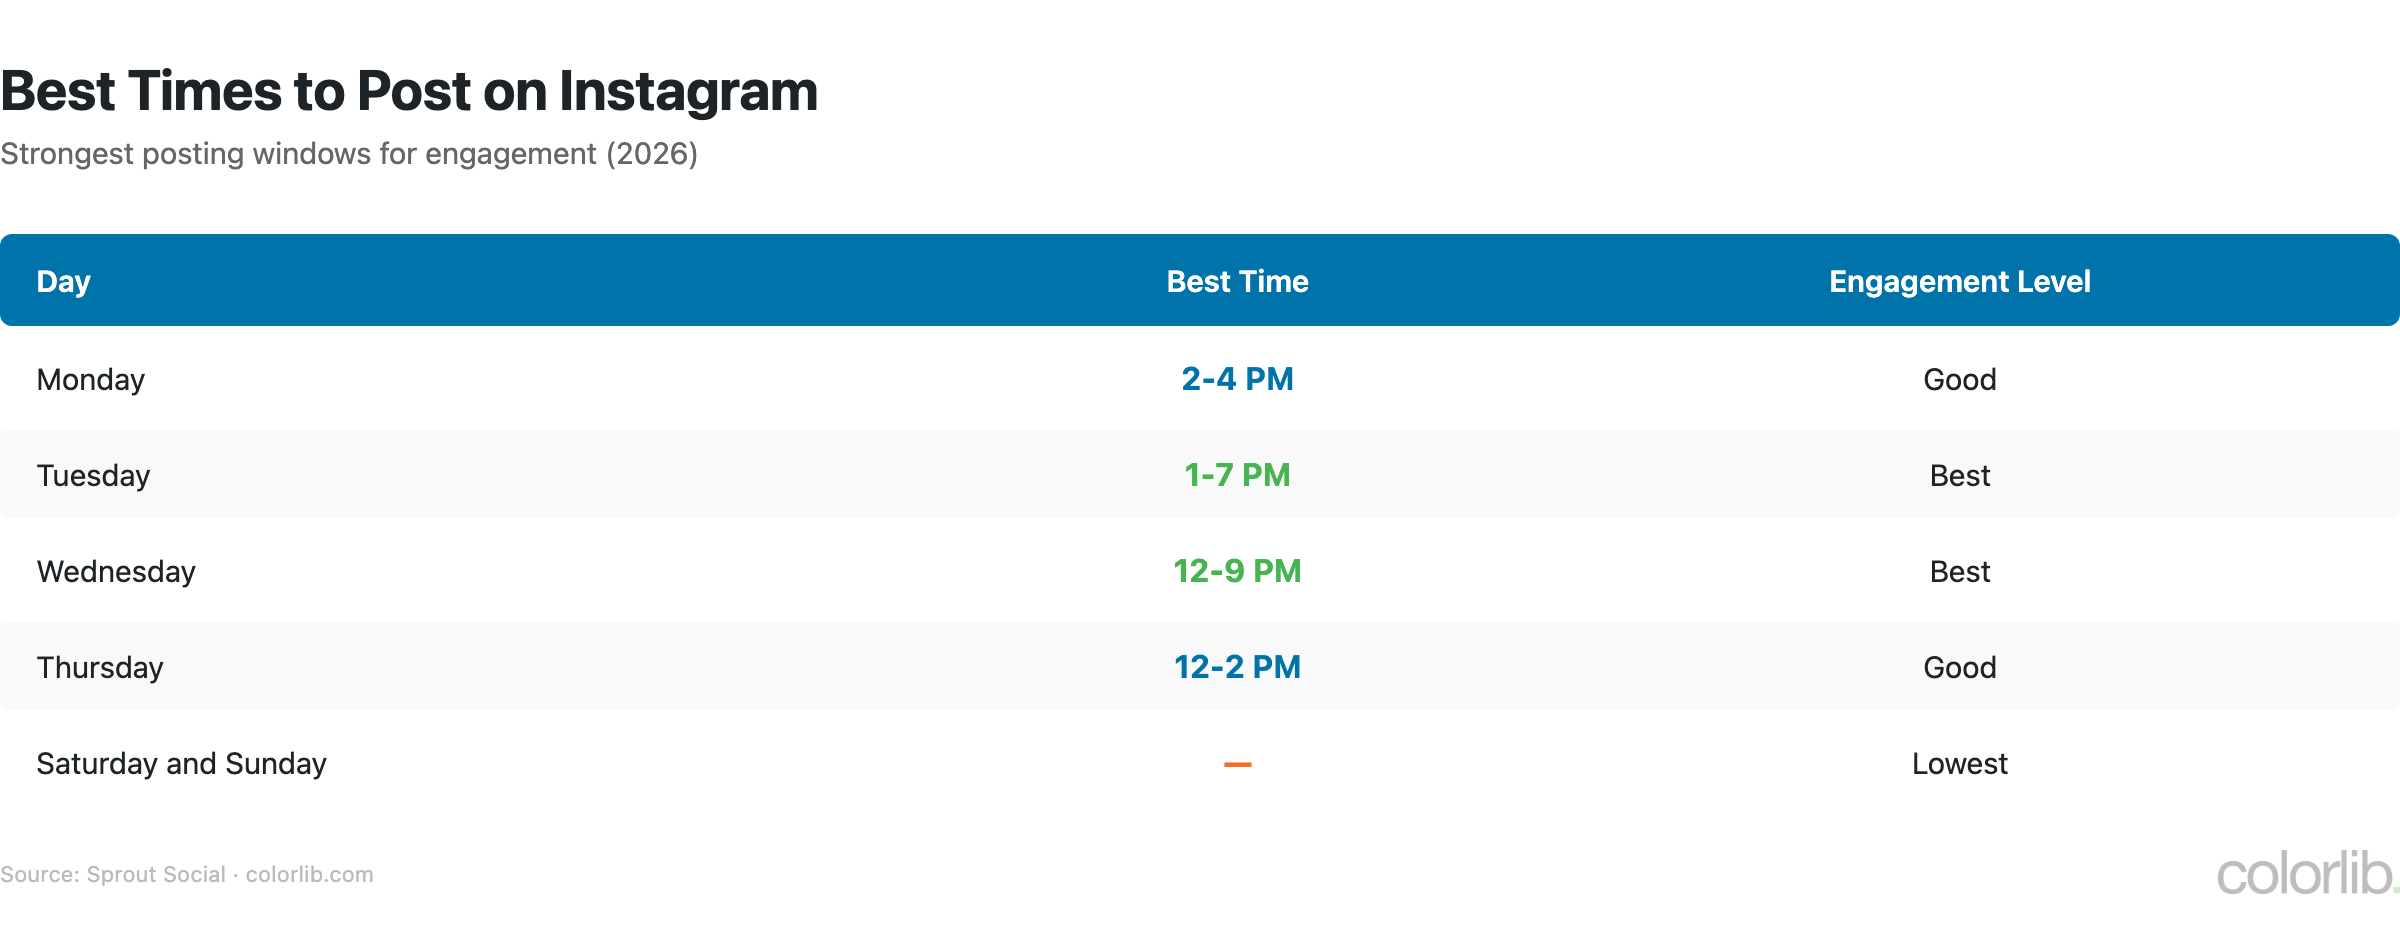
Tuesdays 1-7 PM and Wednesdays 12-9 PM are the strongest windows in Sprout Social’s 2026 data, with Mondays 2-4 PM and Thursdays 12-2 PM close behind. Weekends have the lowest engagement. The median brand posts about 3.7 times per week.
How many hashtags should I use?
Up to 5, because that is now the limit. Since December 2025 Instagram caps posts and Reels at 5 hashtags, counted across the caption and comments together. Choose specific tags that describe the topic rather than broad, crowded ones.






Comments (0)