85+ Graphic Design Statistics & Trends (2026 Edition)
Last updated: March 2026
The graphic design industry is worth $45.8 billion, employs over 500,000 designers in the US alone, and is being transformed by AI tools that 75% of designers now use. Here are 85+ graphic design statistics covering industry size, salaries, tools, AI adoption, freelancing, and trends for 2026.
Key Graphic Design Statistics (2026)
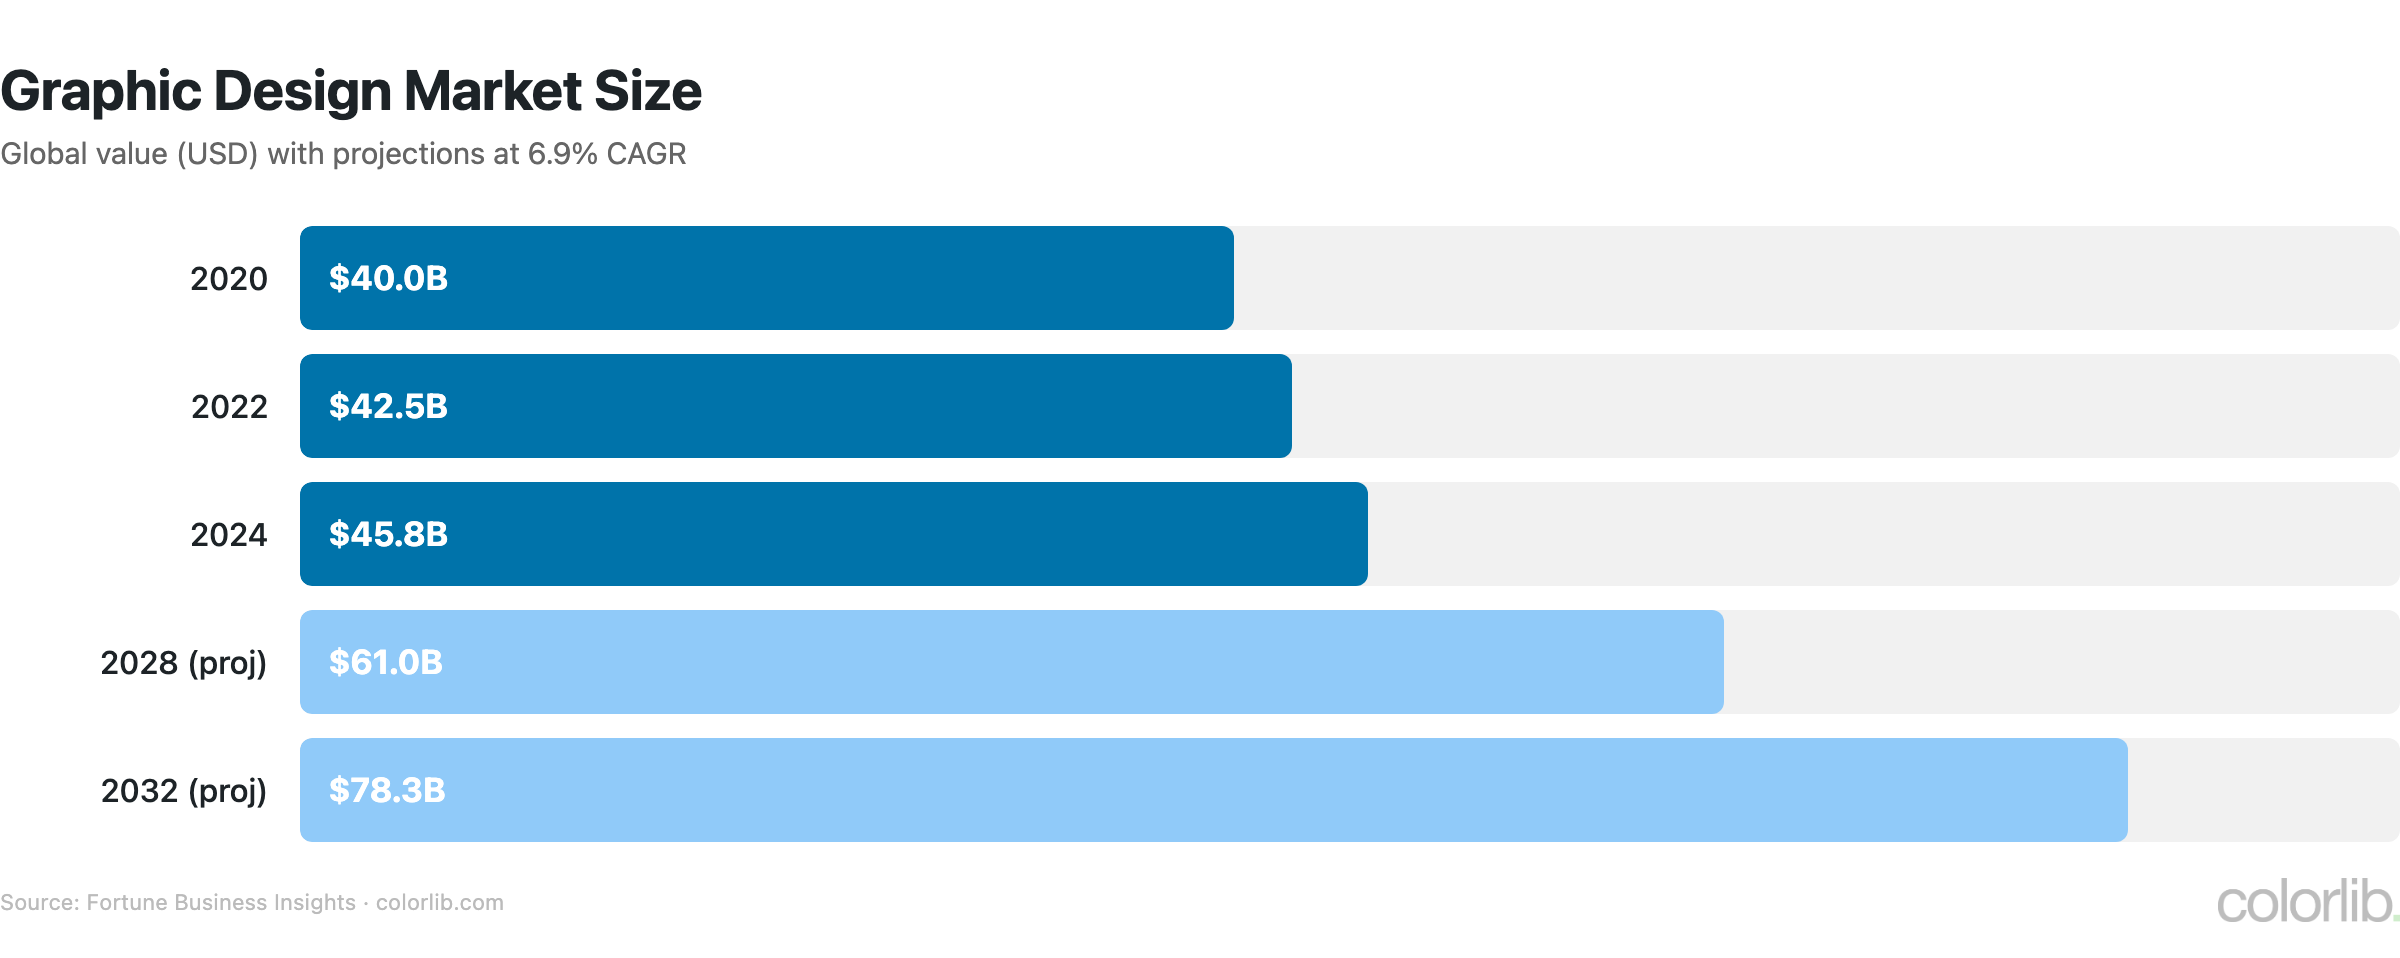
- Global graphic design market: $45.8 billion, projected $78.3B by 2032 (Fortune Business Insights)
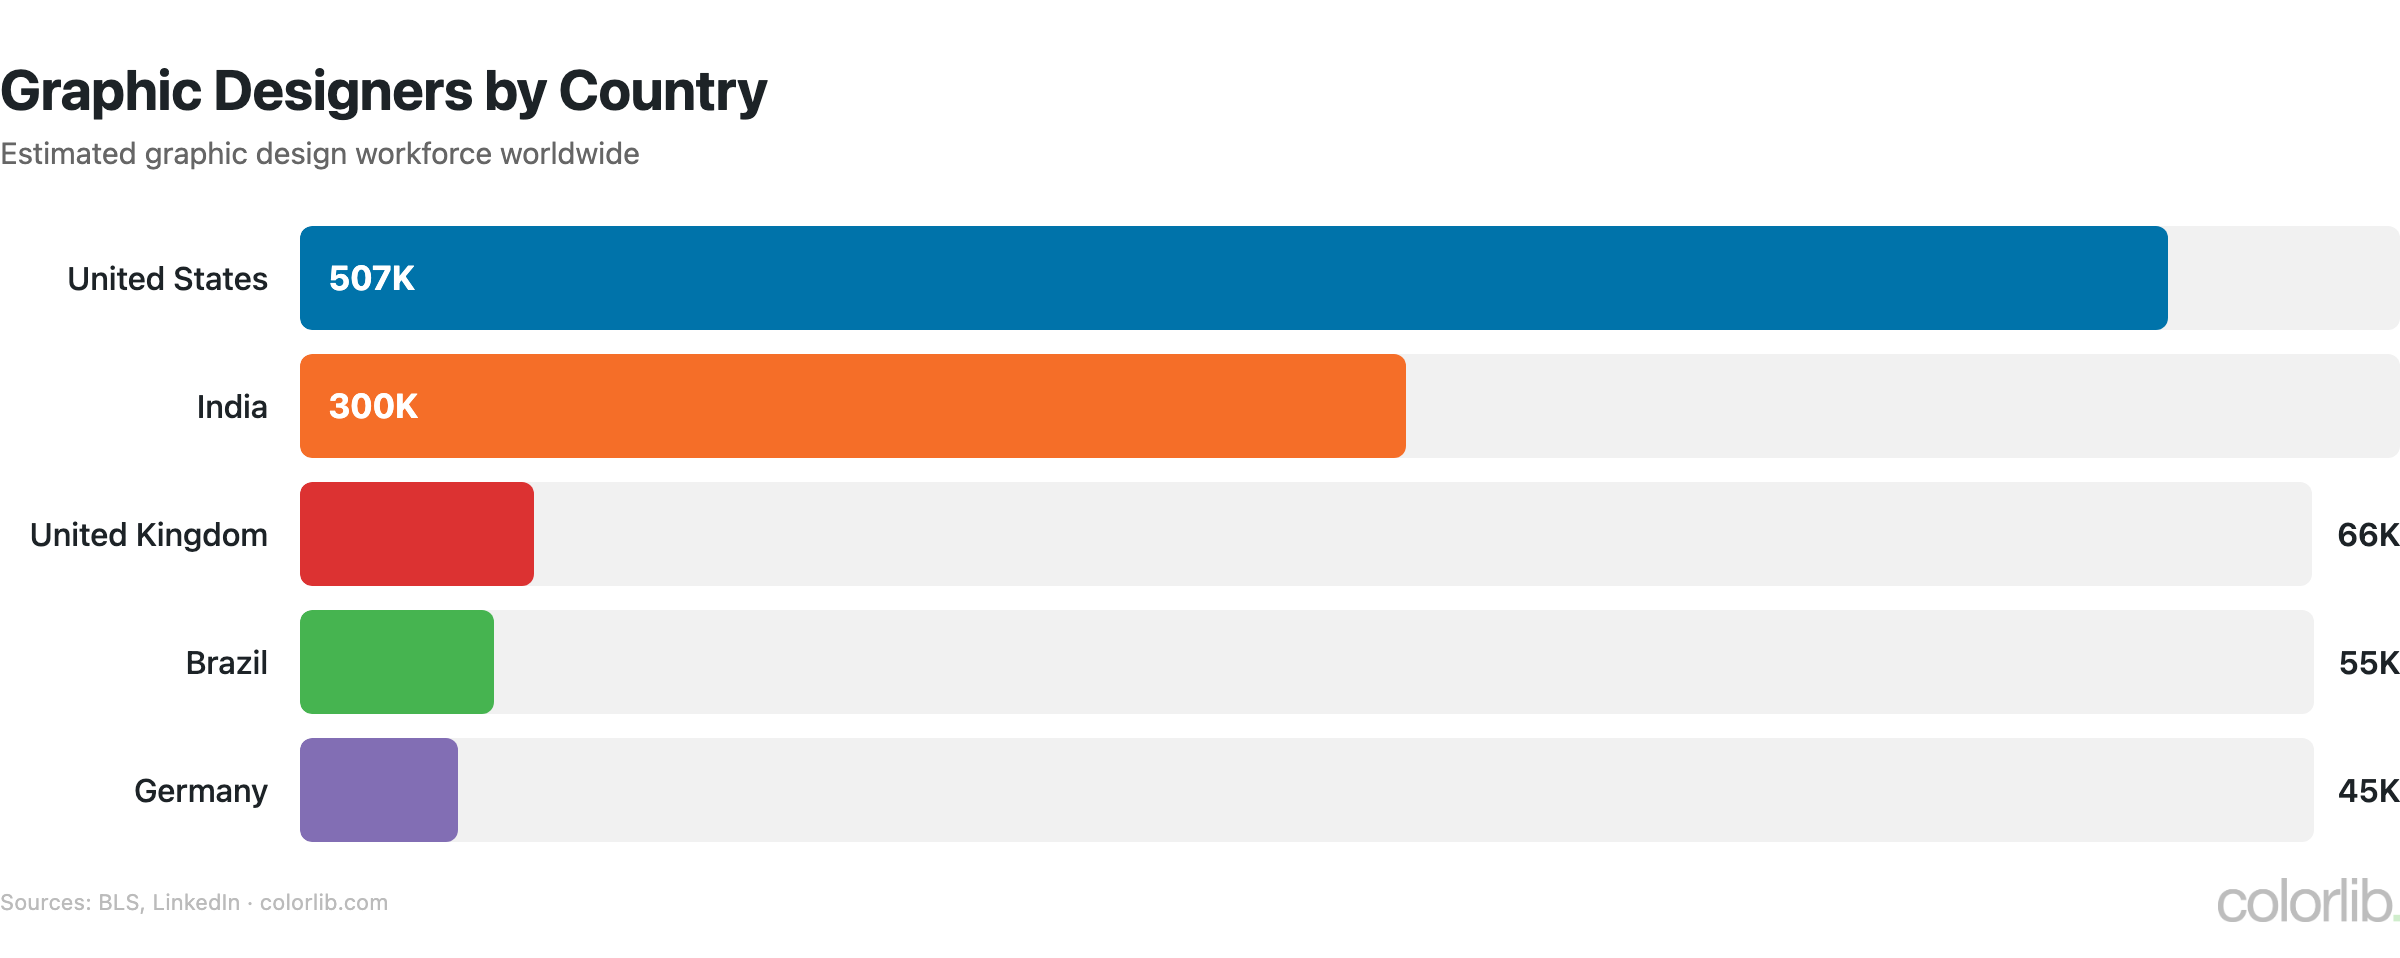
- 507,690 graphic designers employed in the US (BLS)
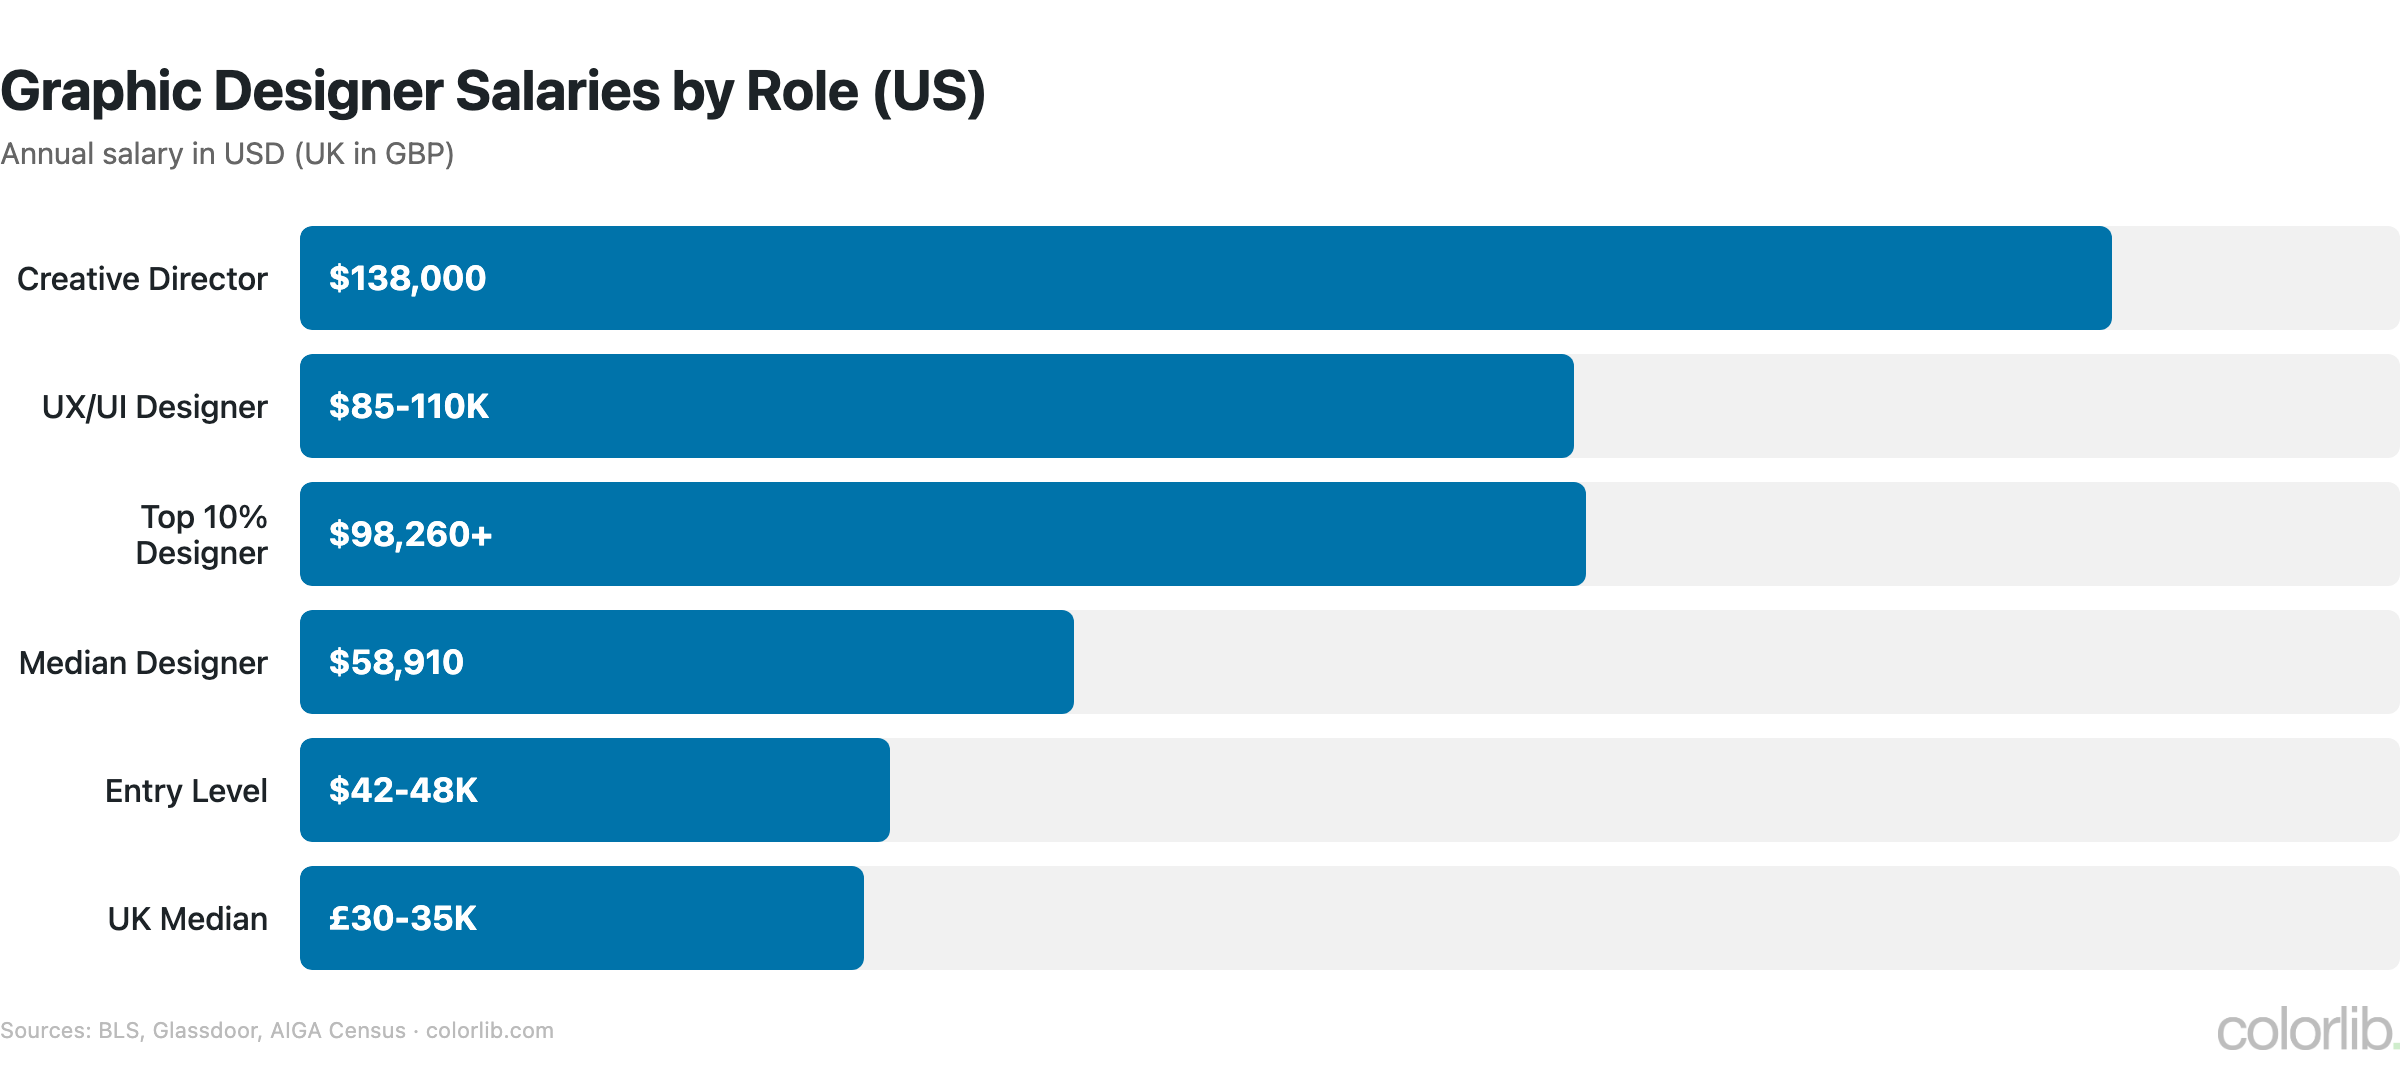
- US median salary: $58,910; top 10% earn $98,260+ (BLS)
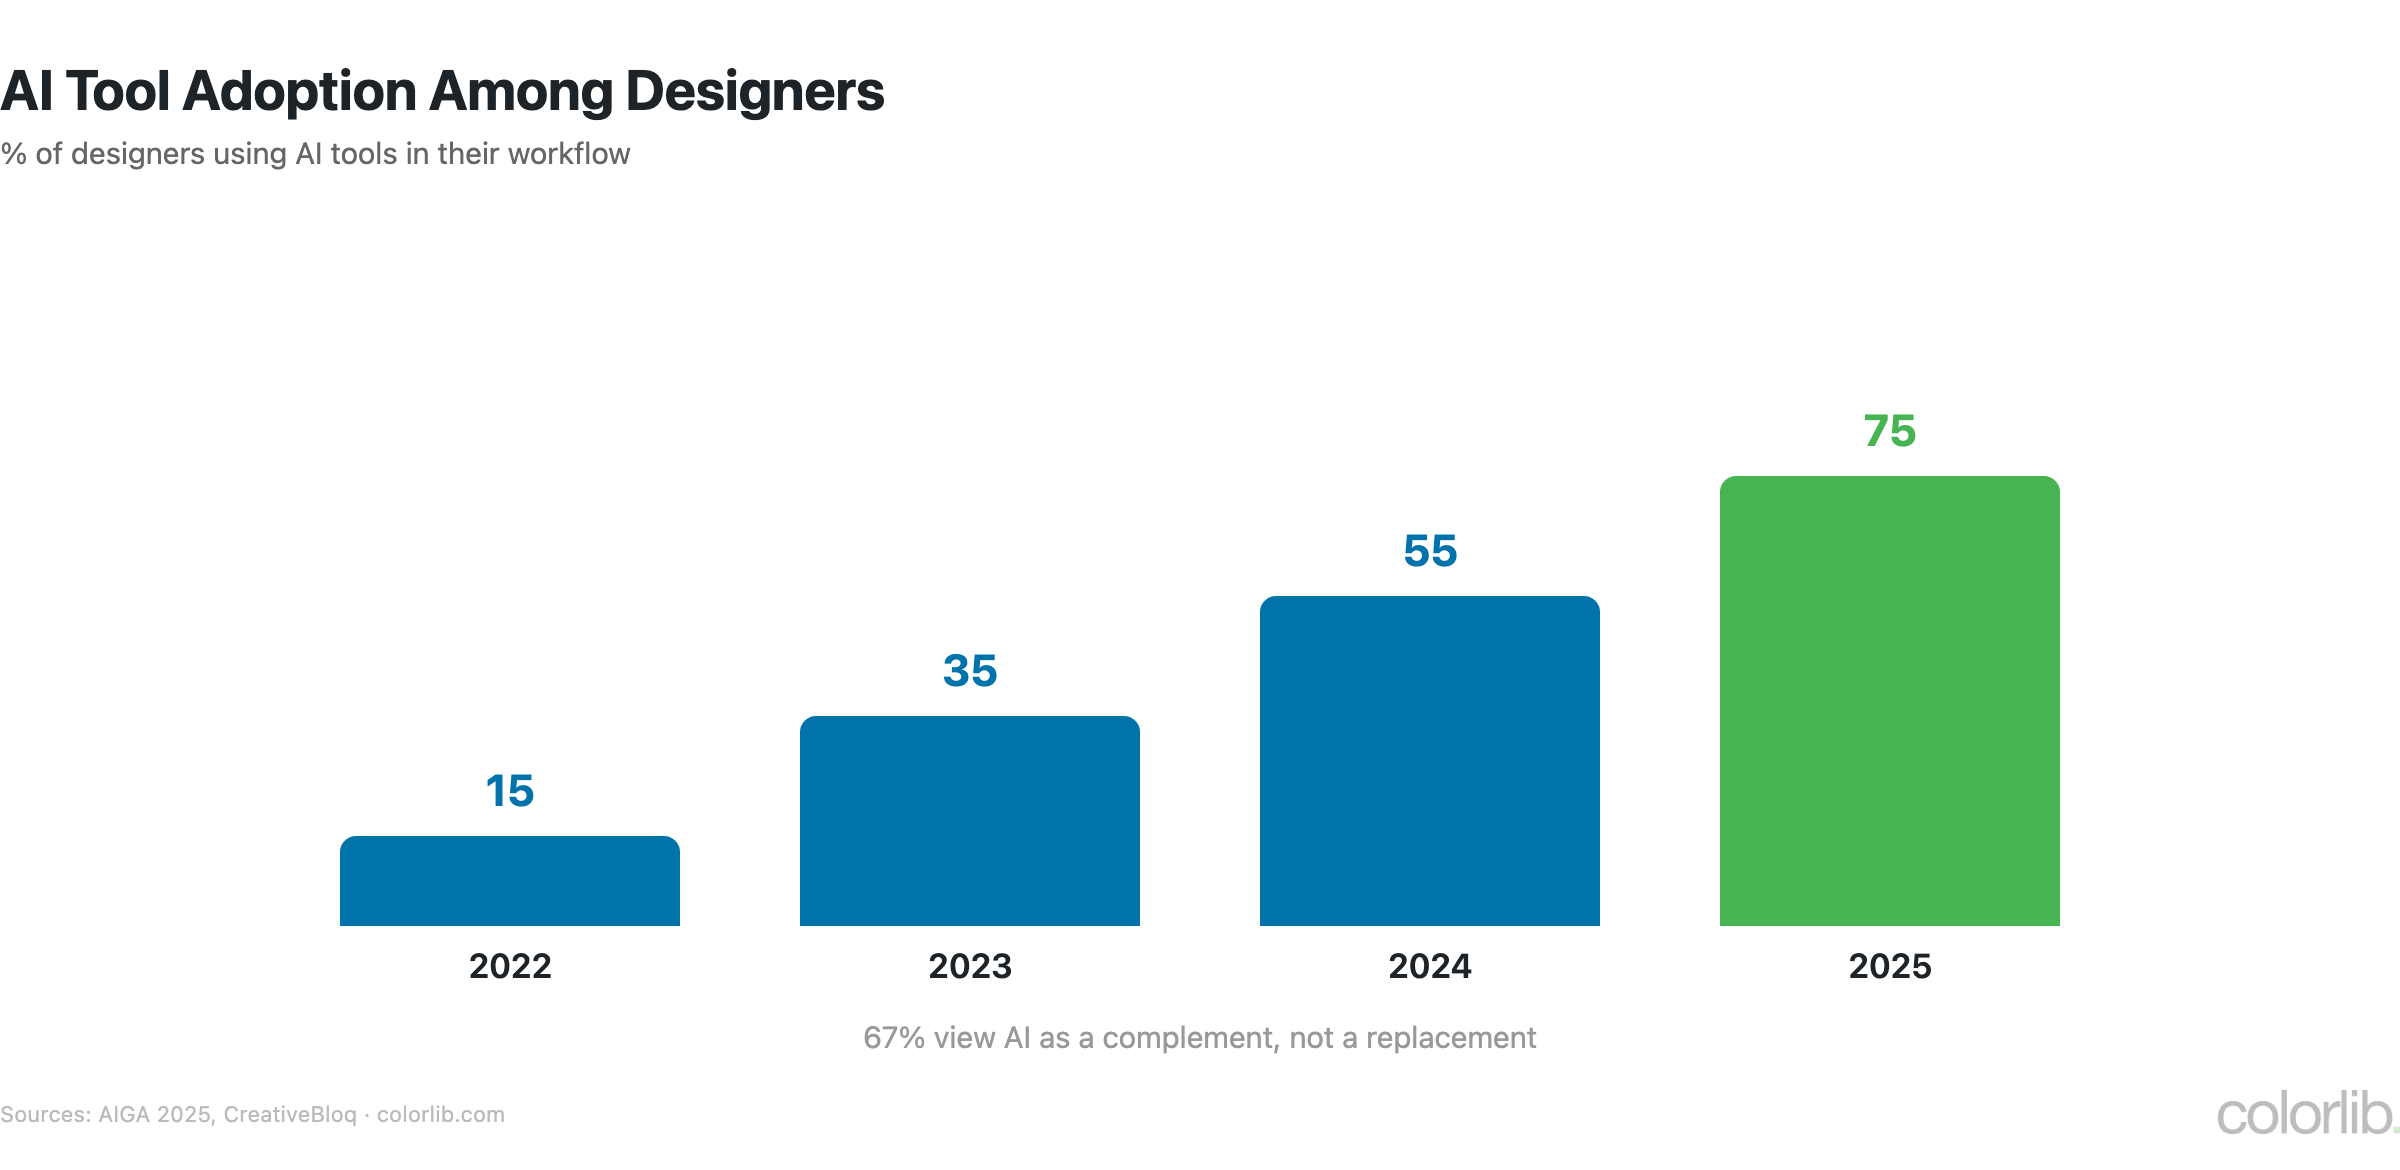
- 75% of designers use AI tools, up from 35% in 2023 (AIGA)
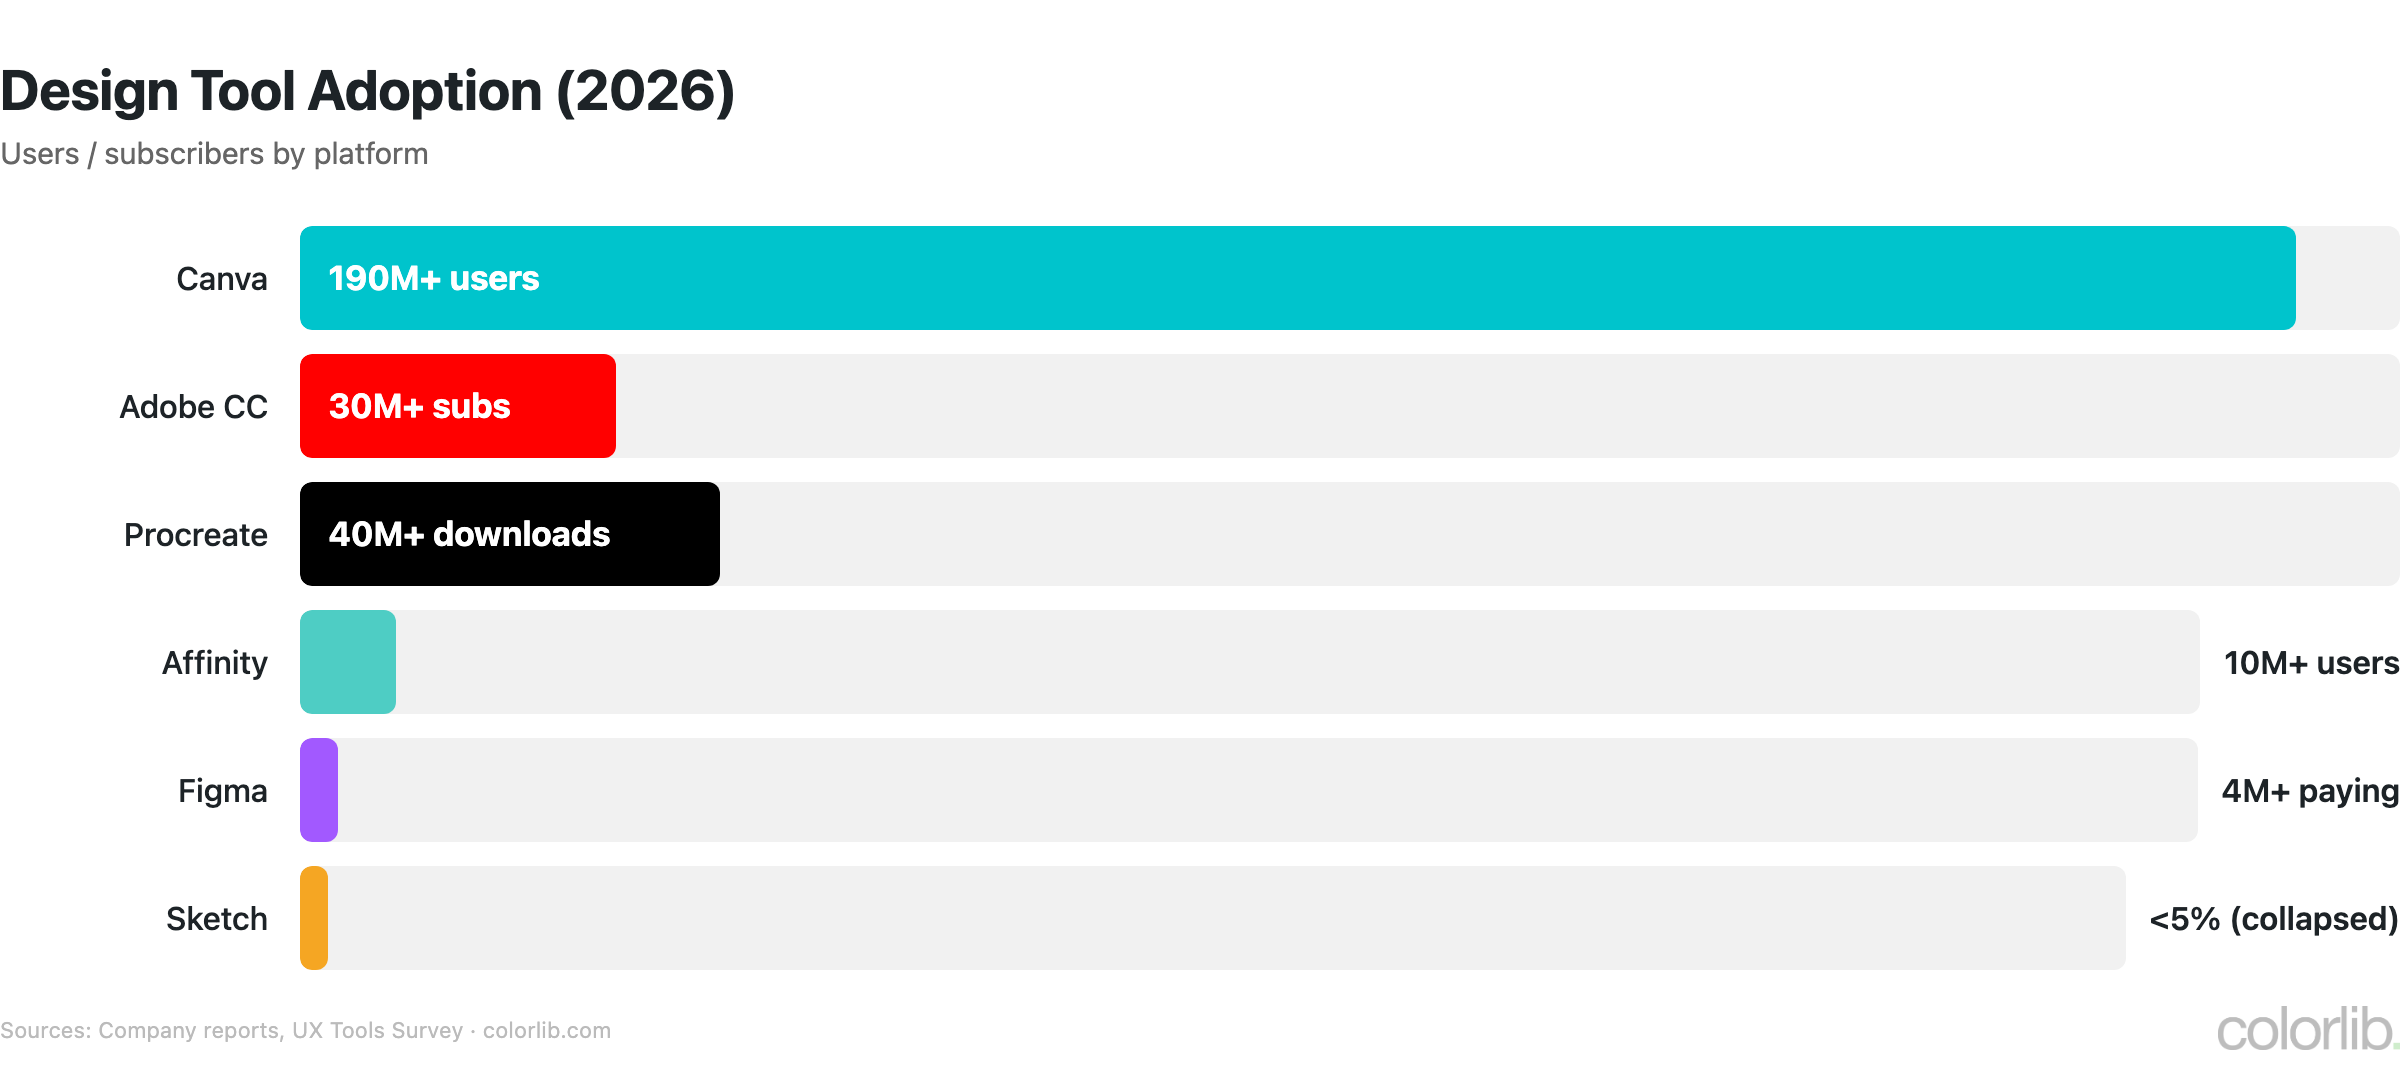
- Canva: 190M+ monthly users; Figma: 4M+ paying customers
- 32% of design job listings mention AI skills, up from 3% in 2023
- Sketch usage collapsed from 30%+ to under 5%, displaced by Figma
Graphic Design Industry Size & Revenue
| Metric | Value | Source |
|---|---|---|
| Global market size (2024) | $45.8 billion | Fortune Business Insights |
| Projected by 2032 | $78.3 billion (6.9% CAGR) | Fortune Business Insights |
| Global creative economy | $2.25 trillion GDP, 30M jobs | UNESCO |
| Design services market by 2030 | $319.2 billion | Allied Market Research |
| Design agency profit margin | 15-25% | Promethean Research |
Graphic Designer Workforce
| Country | Designers | Notes |
|---|---|---|
| United States | 507,690 | BLS 2024 data |
| India | 300,000+ | On freelance platforms |
| United Kingdom | ~66,000 | ONS data |
- US employment projected to decline 2% (2022-2032), but 22,800 annual openings from turnover (BLS)
- Remote design jobs increased 150% from 2020 to 2025
- 67% of job listings require Figma as a skill, up from 30% in 2021
- 32% of listings mention AI tools (Midjourney, DALL-E, Firefly), up from 3% in 2023
- Motion design required in 45% of senior roles
Graphic Designer Salaries
| Role / Level | US Salary | Source |
|---|---|---|
| Entry-level | $42,000-$48,000 | Indeed |
| Median (all) | $58,910 | BLS |
| Top 10% | $98,260+ | BLS |
| UX/UI Designer | $85,000-$110,000 | Glassdoor |
| Creative Director | $138,000 | Glassdoor |
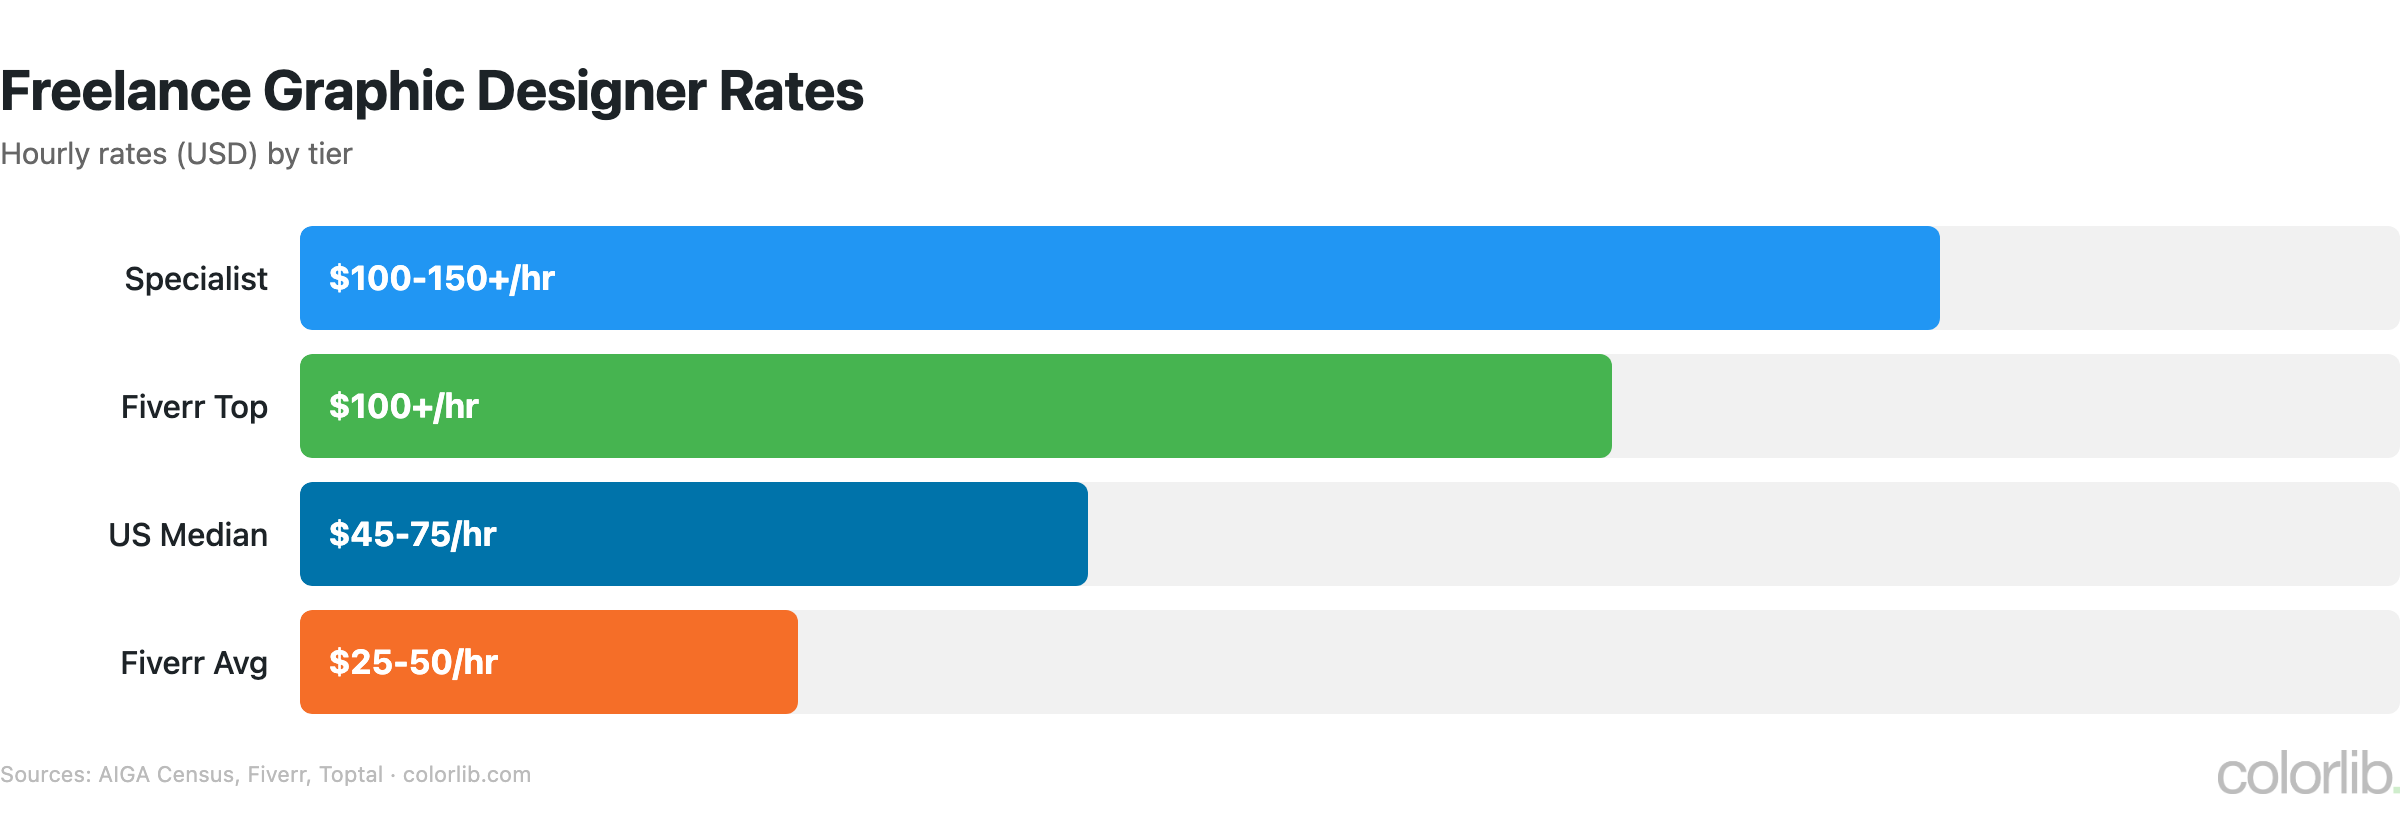
| Freelance (median) | $45-$75/hour | AIGA Census |
| Freelance (specialist) | $100-$150+/hour | AIGA Census |
| UK median | £30,000-£35,000 | Glassdoor UK |
- Highest-paying US states: Washington $74,400, New York $72,340, Massachusetts $71,560
- Remote designers earn 5-10% less than in-office — gap is narrowing
- Brand designer roles up 28% in job postings since 2022
Design Tools Market Share
| Tool | Users / Subscribers | Revenue | Trend |
|---|---|---|---|
| Canva | 190M+ MAU | $2.5B+ (2024) | 🟢 Dominant in non-pro |
| Adobe CC | 30M+ subscribers | $14.4B (Digital Media) | — Stable, 26% market |
| Figma | 4M+ paying | $600M+ ARR | 🟢 70%+ of UI design |
| Procreate | 40M+ downloads | — | 🟢 #1 paid iPad app |
| Affinity (Canva) | 10M+ users | Acquired ~$400M | 🟢 Free tier boost |
| Sketch | Under 5% | — | 🔴 Down from 30% (2019) |
| InVision | Shut down (2024) | — | ⚫ Dead |
- Adobe attempted to acquire Figma for $20 billion — abandoned Dec 2023 due to regulatory concerns
- Canva acquired Affinity for ~$400 million in 2024
- Canva templates used 15 billion+ times since launch
- Figma Config conference: 10,000+ in-person attendees (2024)
AI in Graphic Design
| Statistic | Value | Source |
|---|---|---|
| Designers using AI tools | 75% (up from 35% in 2023) | AIGA |
| Adobe Firefly images generated | 12 billion+ | Adobe |
| Canva Magic Studio users | 100M+/month | Canva |
| Midjourney registered users | 16M+ | The Verge |
| AI image generation market (2024) | $400 million | Grand View |
| Projected by 2030 | $1.8 billion | Grand View |
| View AI as complement, not replacement | 67% | CreativeBloq |
| Companies replaced design tasks with AI | 36% | McKinsey |
| AI reduces routine task time | 50-80% | Adobe Research |
| Stock photo revenue decline | 20-30% (2024-2025) | Getty/Shutterstock |
| Job listings mentioning AI tools | 32% (up from 3% in 2023) | Indeed |
Freelance Graphic Design
| Statistic | Value | Source |
|---|---|---|
| Americans freelancing (2024) | 59 million | Upwork |
| Design rank among freelance skills | #3 most in-demand | Fiverr |
| Fiverr designer rates | $25-$50/hr (avg), $100+ (top) | Fiverr |
| 99designs total payouts | $400M+ to designers | 99designs |
| Upwork design job postings | 819,000 (2024) | Upwork |
| Specialist premium over generalist | 40-60% more | Toptal |
| Freelance designers working from home | 72% | FlexJobs |
Design Education
- 3,500+ graphic design degree programs in the US
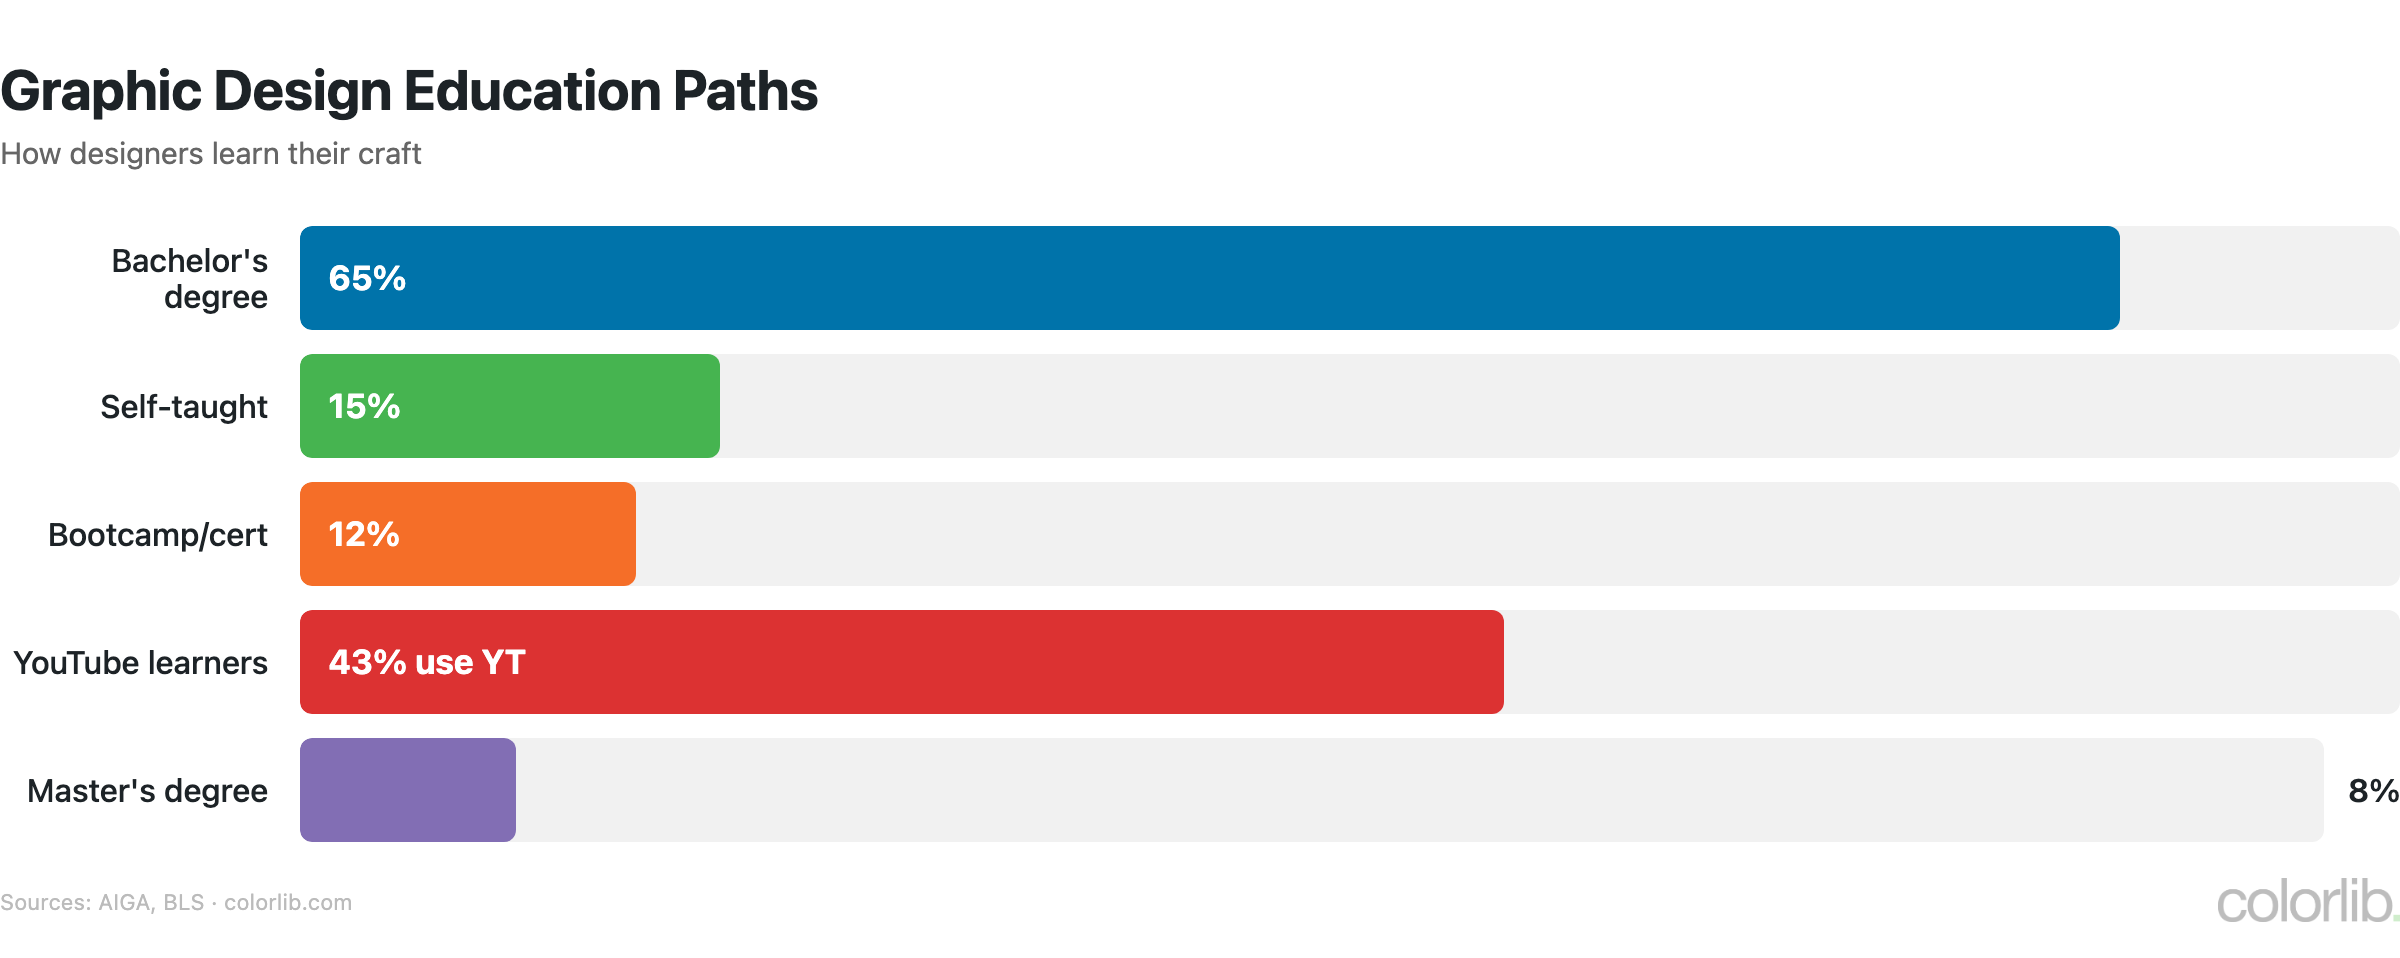
- 65% of professional designers have a bachelor’s degree; 15% are self-taught
- Online design courses: 300% enrollment growth (2020-2025)
- Google UX Design Certificate: 1 million+ completions
- Design bootcamps: $5-15K, report 85%+ job placement
- 43% of designers learn most skills from YouTube and free resources
UX/UI Design Statistics
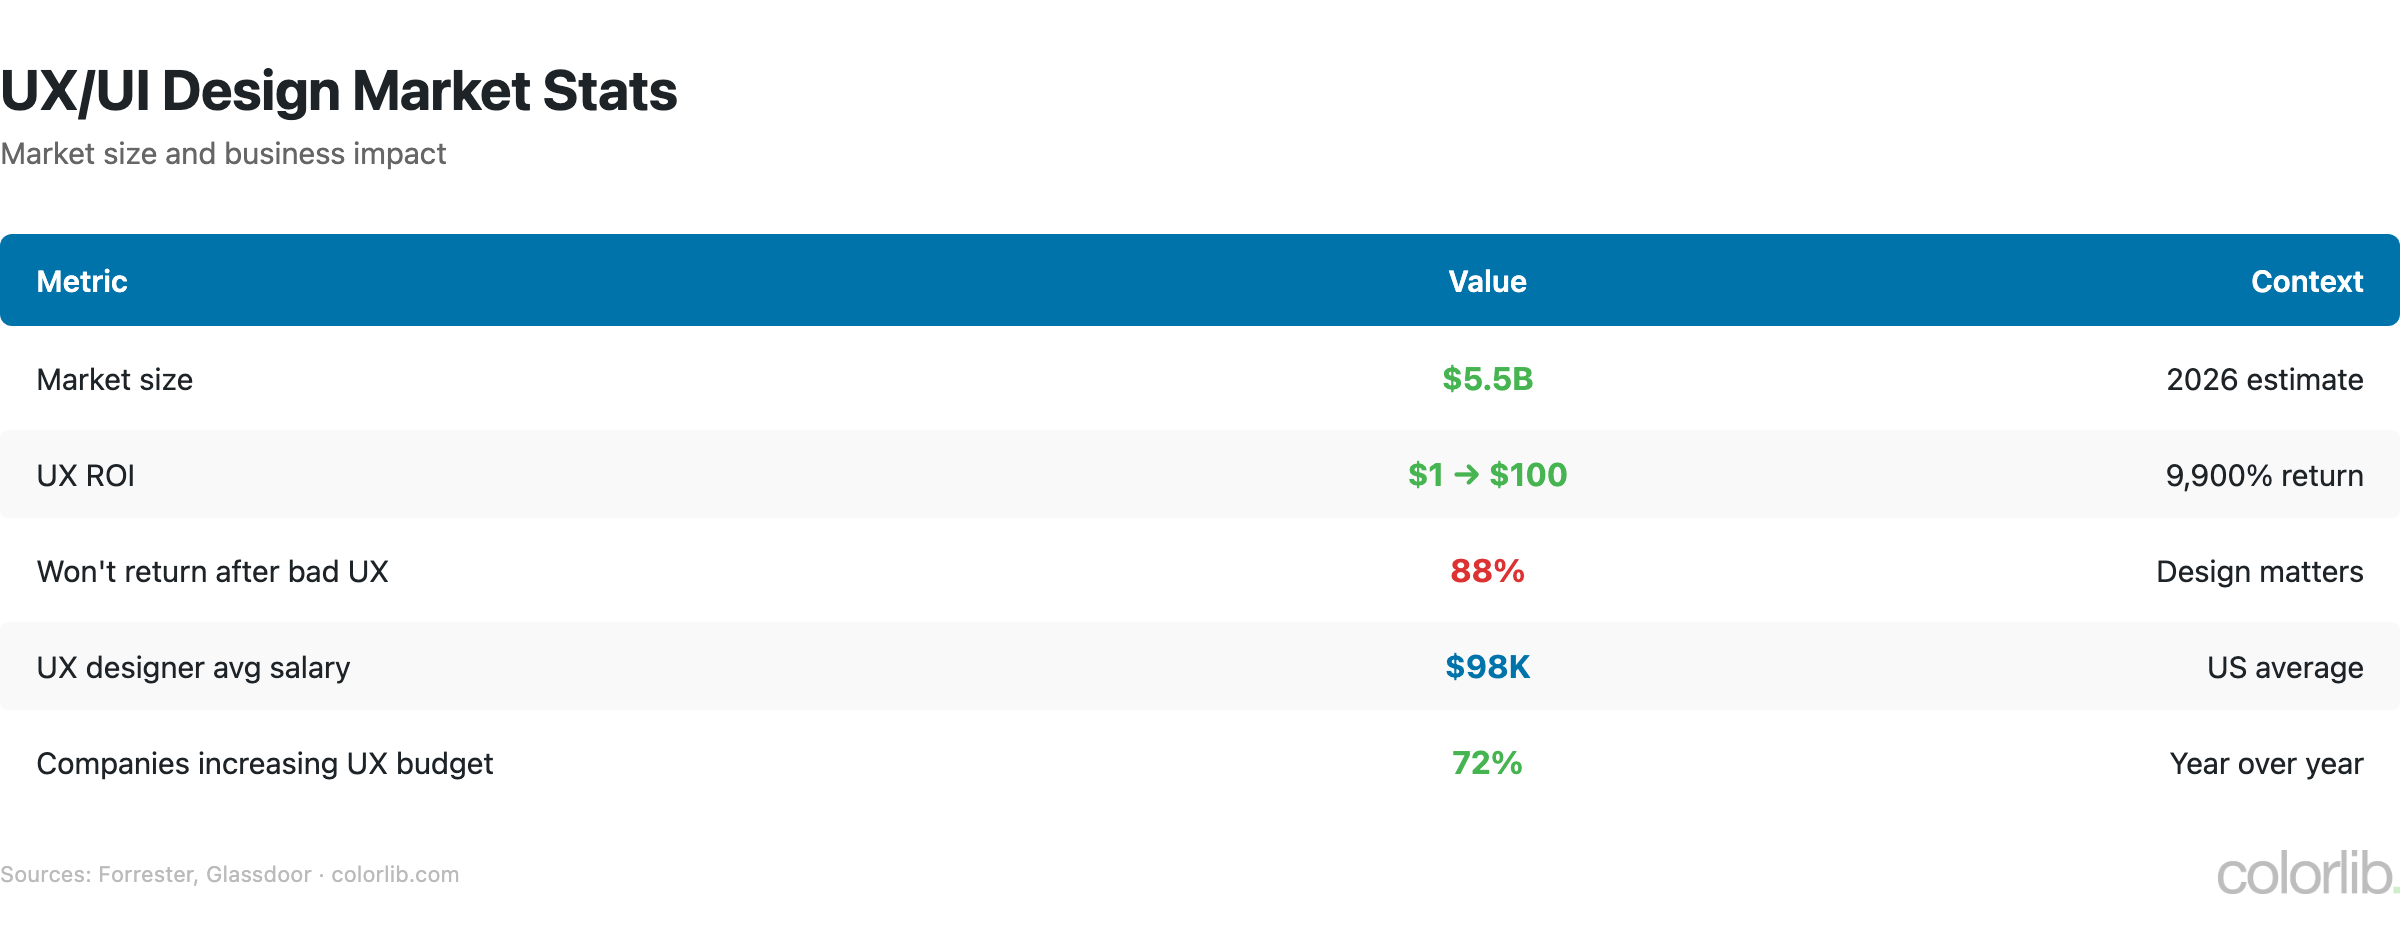
- UX market: $5.5 billion, growing at 14.5% CAGR
- $1 invested in UX returns $100 — 9,900% ROI (Forrester)
- 88% of consumers won’t return after a bad UX
- 70% of online businesses fail due to poor usability, not bad ideas
- Only 55% of companies conduct UX testing
- UX designer jobs grew 12% YoY (2024-2025)
Design Outsourcing
- 60% of businesses outsource at least some graphic design work
- Design outsourcing grew 25% from 2022 to 2025
- Outsourcing to India/Philippines costs 40-70% less than US agencies
- Unlimited design services (DesignPickle, Penji, Kimp): 100,000+ businesses served
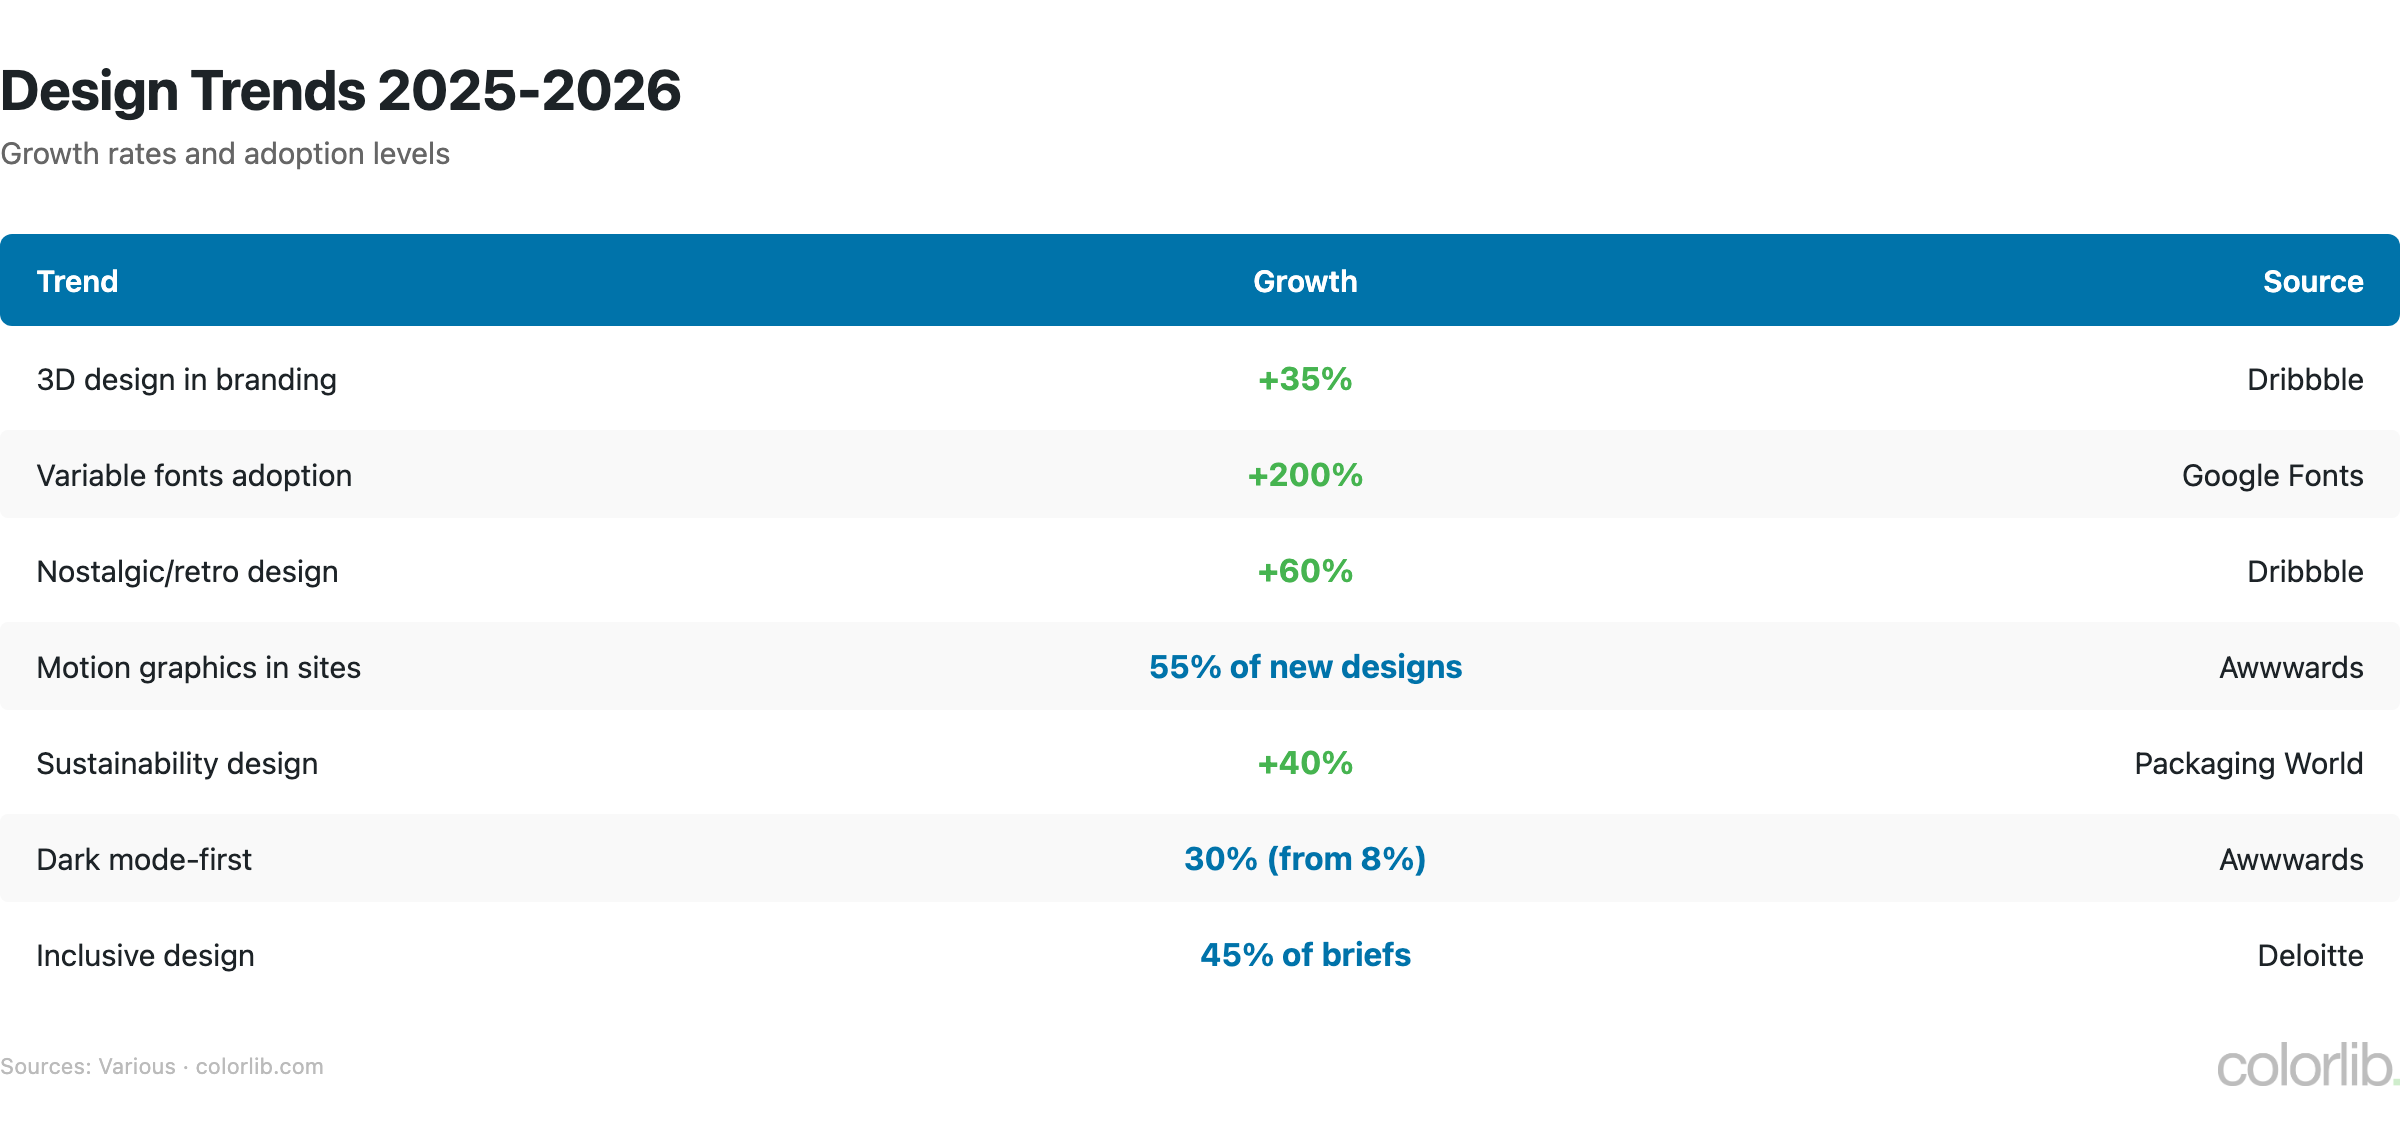
Design Trends 2025-2026
| Trend | Growth / Adoption | Source |
|---|---|---|
| 3D design in branding | +35% | Dribbble |
| Minimalist design (still #1) | 38% of clients request | 99designs |
| Variable fonts adoption | +200% | Google Fonts |
| Sustainability-focused design | +40% | Packaging World |
| Dark mode-first projects | 30% (up from 8% in 2021) | Awwwards |
| Nostalgic/retro design | +60% search volume | Dribbble |
| Motion graphics in websites | 55% of new designs | Awwwards |
| Inclusive design in enterprise | Required in 45% of briefs | Deloitte |
Key Takeaways
- The industry is growing ($45.8B → $78.3B by 2032) despite AI disruption fears. Design demand isn’t shrinking — it’s shifting.
- AI is a tool, not a replacement. 75% of designers use AI, but 67% view it as a complement. The demand is for designers who use AI effectively, not for AI alone.
- Figma won the tool war. 70%+ of collaborative UI design, while Sketch collapsed from 30% to under 5%. InVision shut down entirely.
- Specialization pays. Freelance specialists earn 40-60% more than generalists. UX/UI designers out-earn graphic designers by 50-80%.
- Self-taught is viable. 43% learn most skills from YouTube. Google’s UX Certificate hit 1M+ completions.
- Motion and 3D are the next frontier. Motion skills required in 45% of senior roles. 3D branding up 35%.
Sources
- Bureau of Labor Statistics — Graphic Designers
- Fortune Business Insights — Graphic Design Market
- AIGA Design Census
- UX Tools — Design Tools Survey 2024
- Canva Newsroom
- Adobe Investor Relations
- Upwork — Freelance Forward 2024
- McKinsey — State of AI
- Forrester — UX ROI Research
Frequently Asked Questions
How many graphic designers are there?
The US has 507,690 graphic designers (BLS 2024). India has 300,000+ on freelance platforms, and the UK has ~66,000. The global creative economy employs 30 million people.
What is the average graphic designer salary?
US median is $58,910. Top 10% earn $98,260+. UX/UI designers earn $85-110K. Creative directors earn a median of $138,000. Freelancers charge $45-75/hr (specialists $100-150+).
Is graphic design a dying career?
No. The market is projected to grow from $45.8B to $78.3B by 2032. While BLS projects a 2% employment decline, there are still 22,800 annual openings. The role is evolving — AI fluency, motion design, and UX skills are becoming essential.
What design tools are most popular in 2026?
Canva (190M+ users) leads for non-professionals. Adobe Creative Cloud (30M+ subscribers) remains the professional standard. Figma (4M+ paying) dominates collaborative UI/UX design. Sketch has fallen below 5% market share.
How is AI affecting graphic design jobs?
75% of designers now use AI tools, up from 35% in 2023. 36% of companies have replaced at least one design task with AI. However, 67% of designers view AI as a complement. The biggest impact: stock photo sites saw 20-30% revenue decline as AI-generated imagery replaces purchases. Job listings requiring AI skills went from 3% to 32% in two years.
What is the most in-demand design skill in 2026?
Figma proficiency appears in 67% of design job listings. Motion design is required in 45% of senior roles. AI tool fluency (32% of listings) is the fastest-growing requirement. UX/UI skills command the highest salaries.
Looking for design inspiration? Browse our Tailwind CSS templates, explore free admin dashboard templates, or check out our developer portfolio examples.
Related Posts


Comments (0)