
50+ Lead Generation Statistics Every Marketer Needs (2026)
61% of marketers have named generating traffic and leads as their biggest challenge, blended cost per lead ranges from $91 in ecommerce to $982 in higher education, and content marketing generates 3x more leads at 62% less cost than outbound. Here are 50+ lead generation statistics covering challenges, costs, top channels, landing pages, B2B vs. B2C, and AI automation for 2026.
Key Lead Generation Statistics (2026)
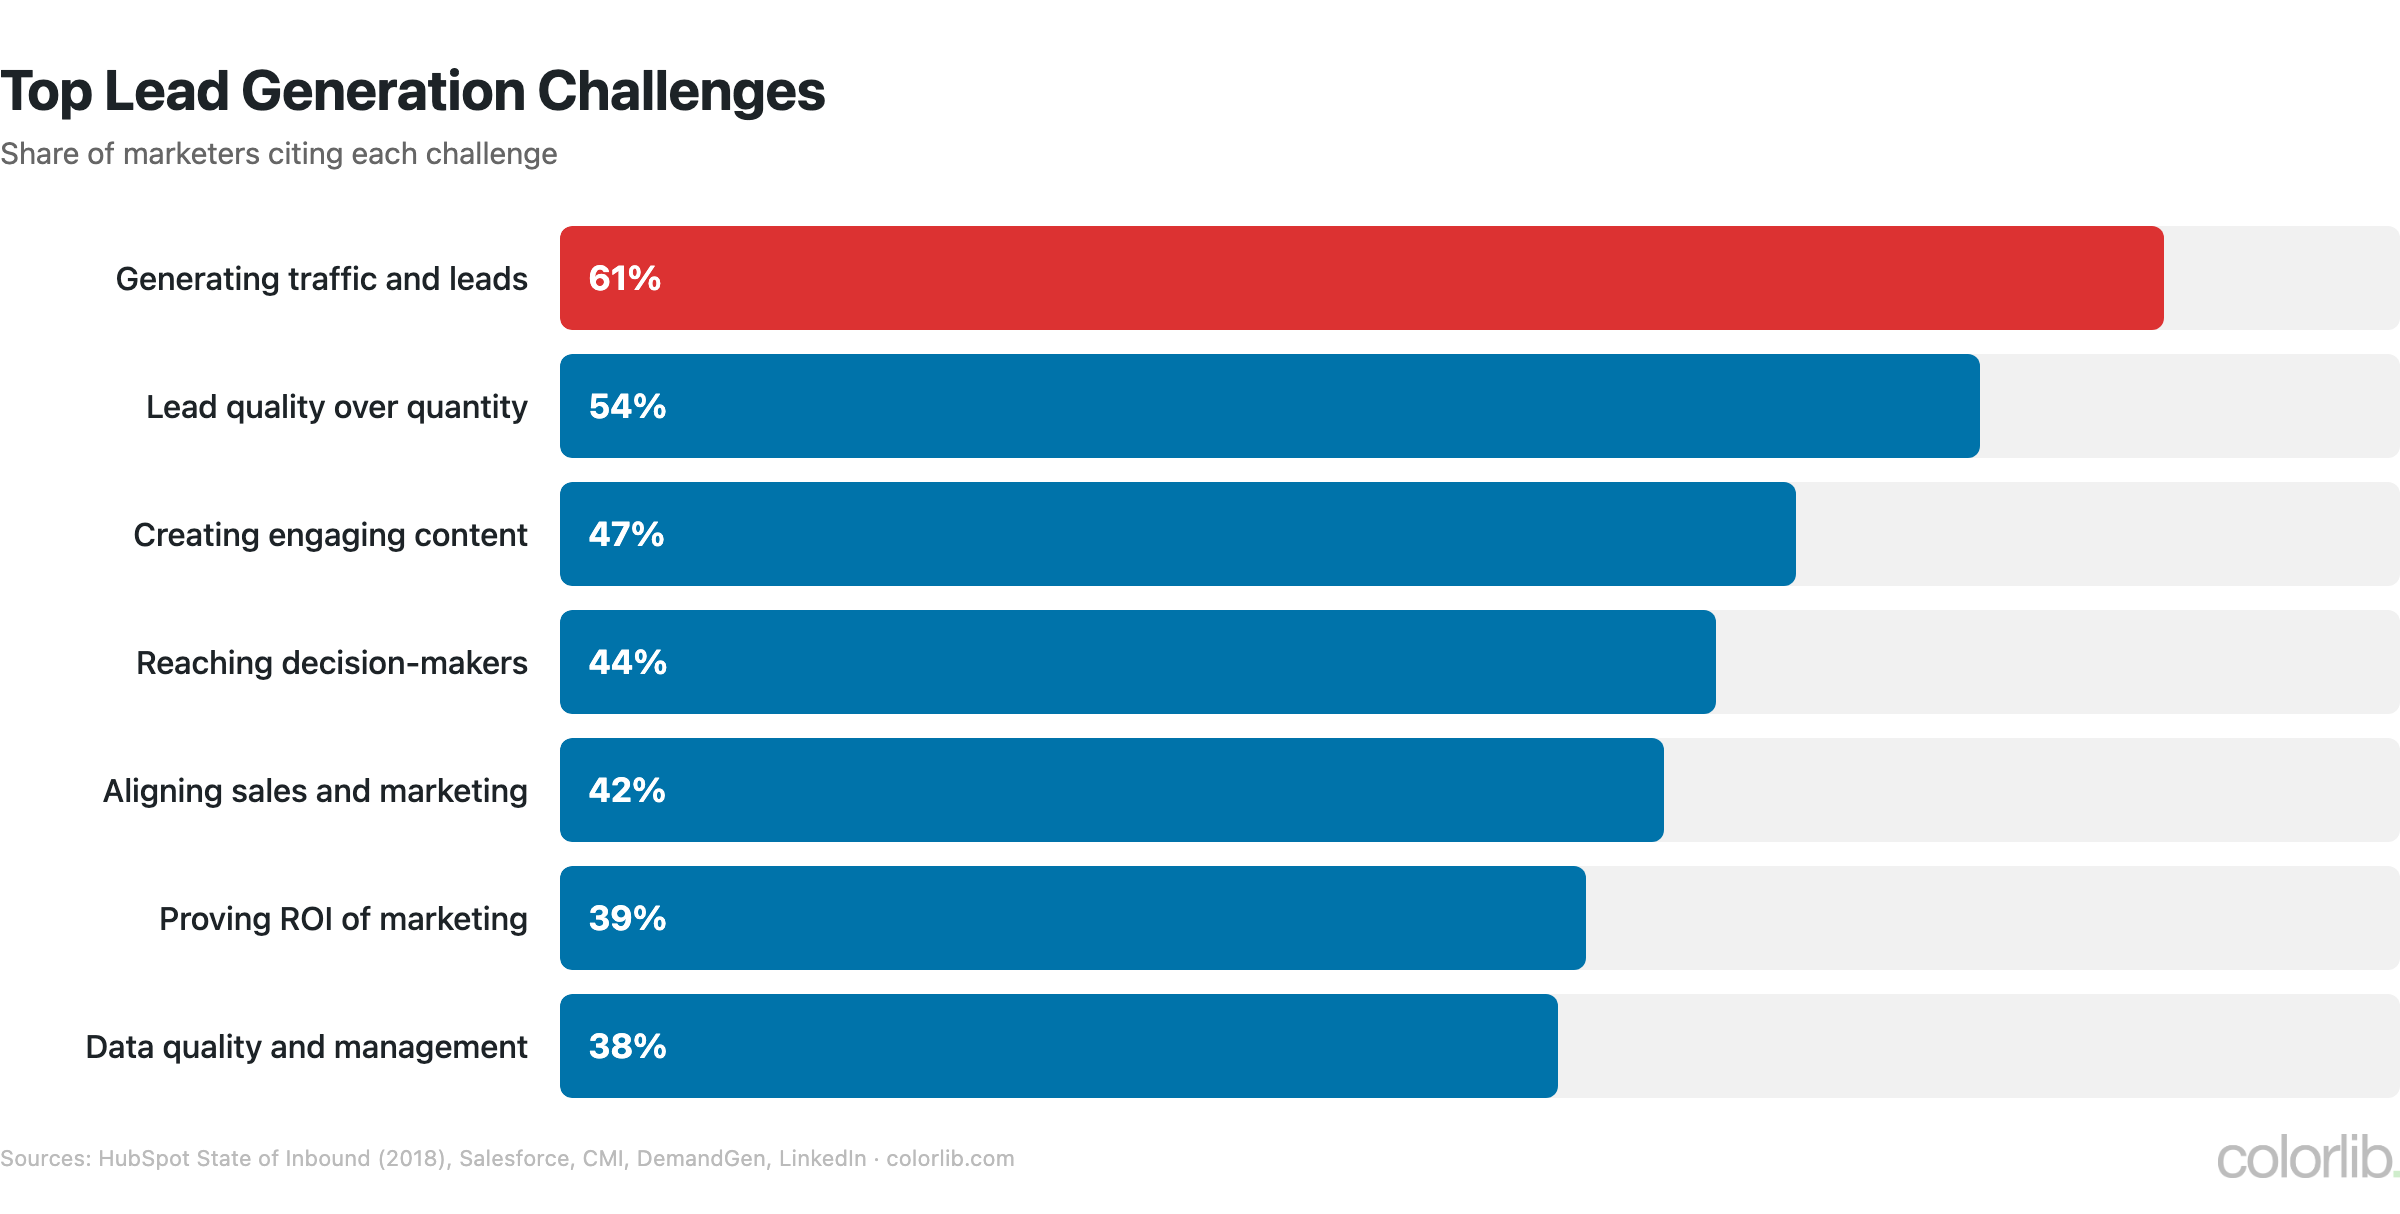
- 61% of marketers named generating traffic and leads their top challenge (HubSpot State of Inbound, 2018)
- Blended cost per lead: $91 to $982 across 30 industries (First Page Sage)
- Content marketing generates 3x more leads at 62% less cost (Demand Metric)
- Median landing page conversion rate: 6.6% across industries (Unbounce)
- Companies with 40+ landing pages get 12x more leads than those with 1-5 (HubSpot benchmark data)
- LinkedIn generates 80% of B2B social leads (LinkedIn)
- 80% of marketers use AI for content creation (HubSpot)
- Website, blog and SEO are the #1 ROI-driving channel (27% of marketers) (HubSpot)
Lead Generation Challenges
| Challenge | % of Marketers | Source |
|---|---|---|
| Generating traffic and leads | 61% | HubSpot State of Inbound (2018) |
| Proving ROI of marketing activities | 39% | HubSpot State of Inbound (2018) |
| Lead quality over quantity | 54% | Salesforce |
| Aligning sales and marketing | 42% | |
| Data quality and management | 38% | DemandGen |
| Creating engaging content | 47% | CMI |
| Reaching decision-makers | 44% | DemandGen |
- 54% of marketers prioritize lead quality over quantity — a shift from the volume-focused approach of previous years
- Only 27% of leads are sales-ready when first generated — the rest require nurturing (MarketingSherpa)
- Companies that align sales and marketing teams generate 208% more revenue from marketing efforts
- 79% of marketing leads never convert to sales, primarily due to lack of lead nurturing
- 57% of sales professionals say the sales cycle is getting longer (Salesforce State of Sales 2026), increasing the importance of sustained lead nurturing
Cost Per Lead by Industry
| Industry | Average CPL (blended paid + organic) | Source |
|---|---|---|
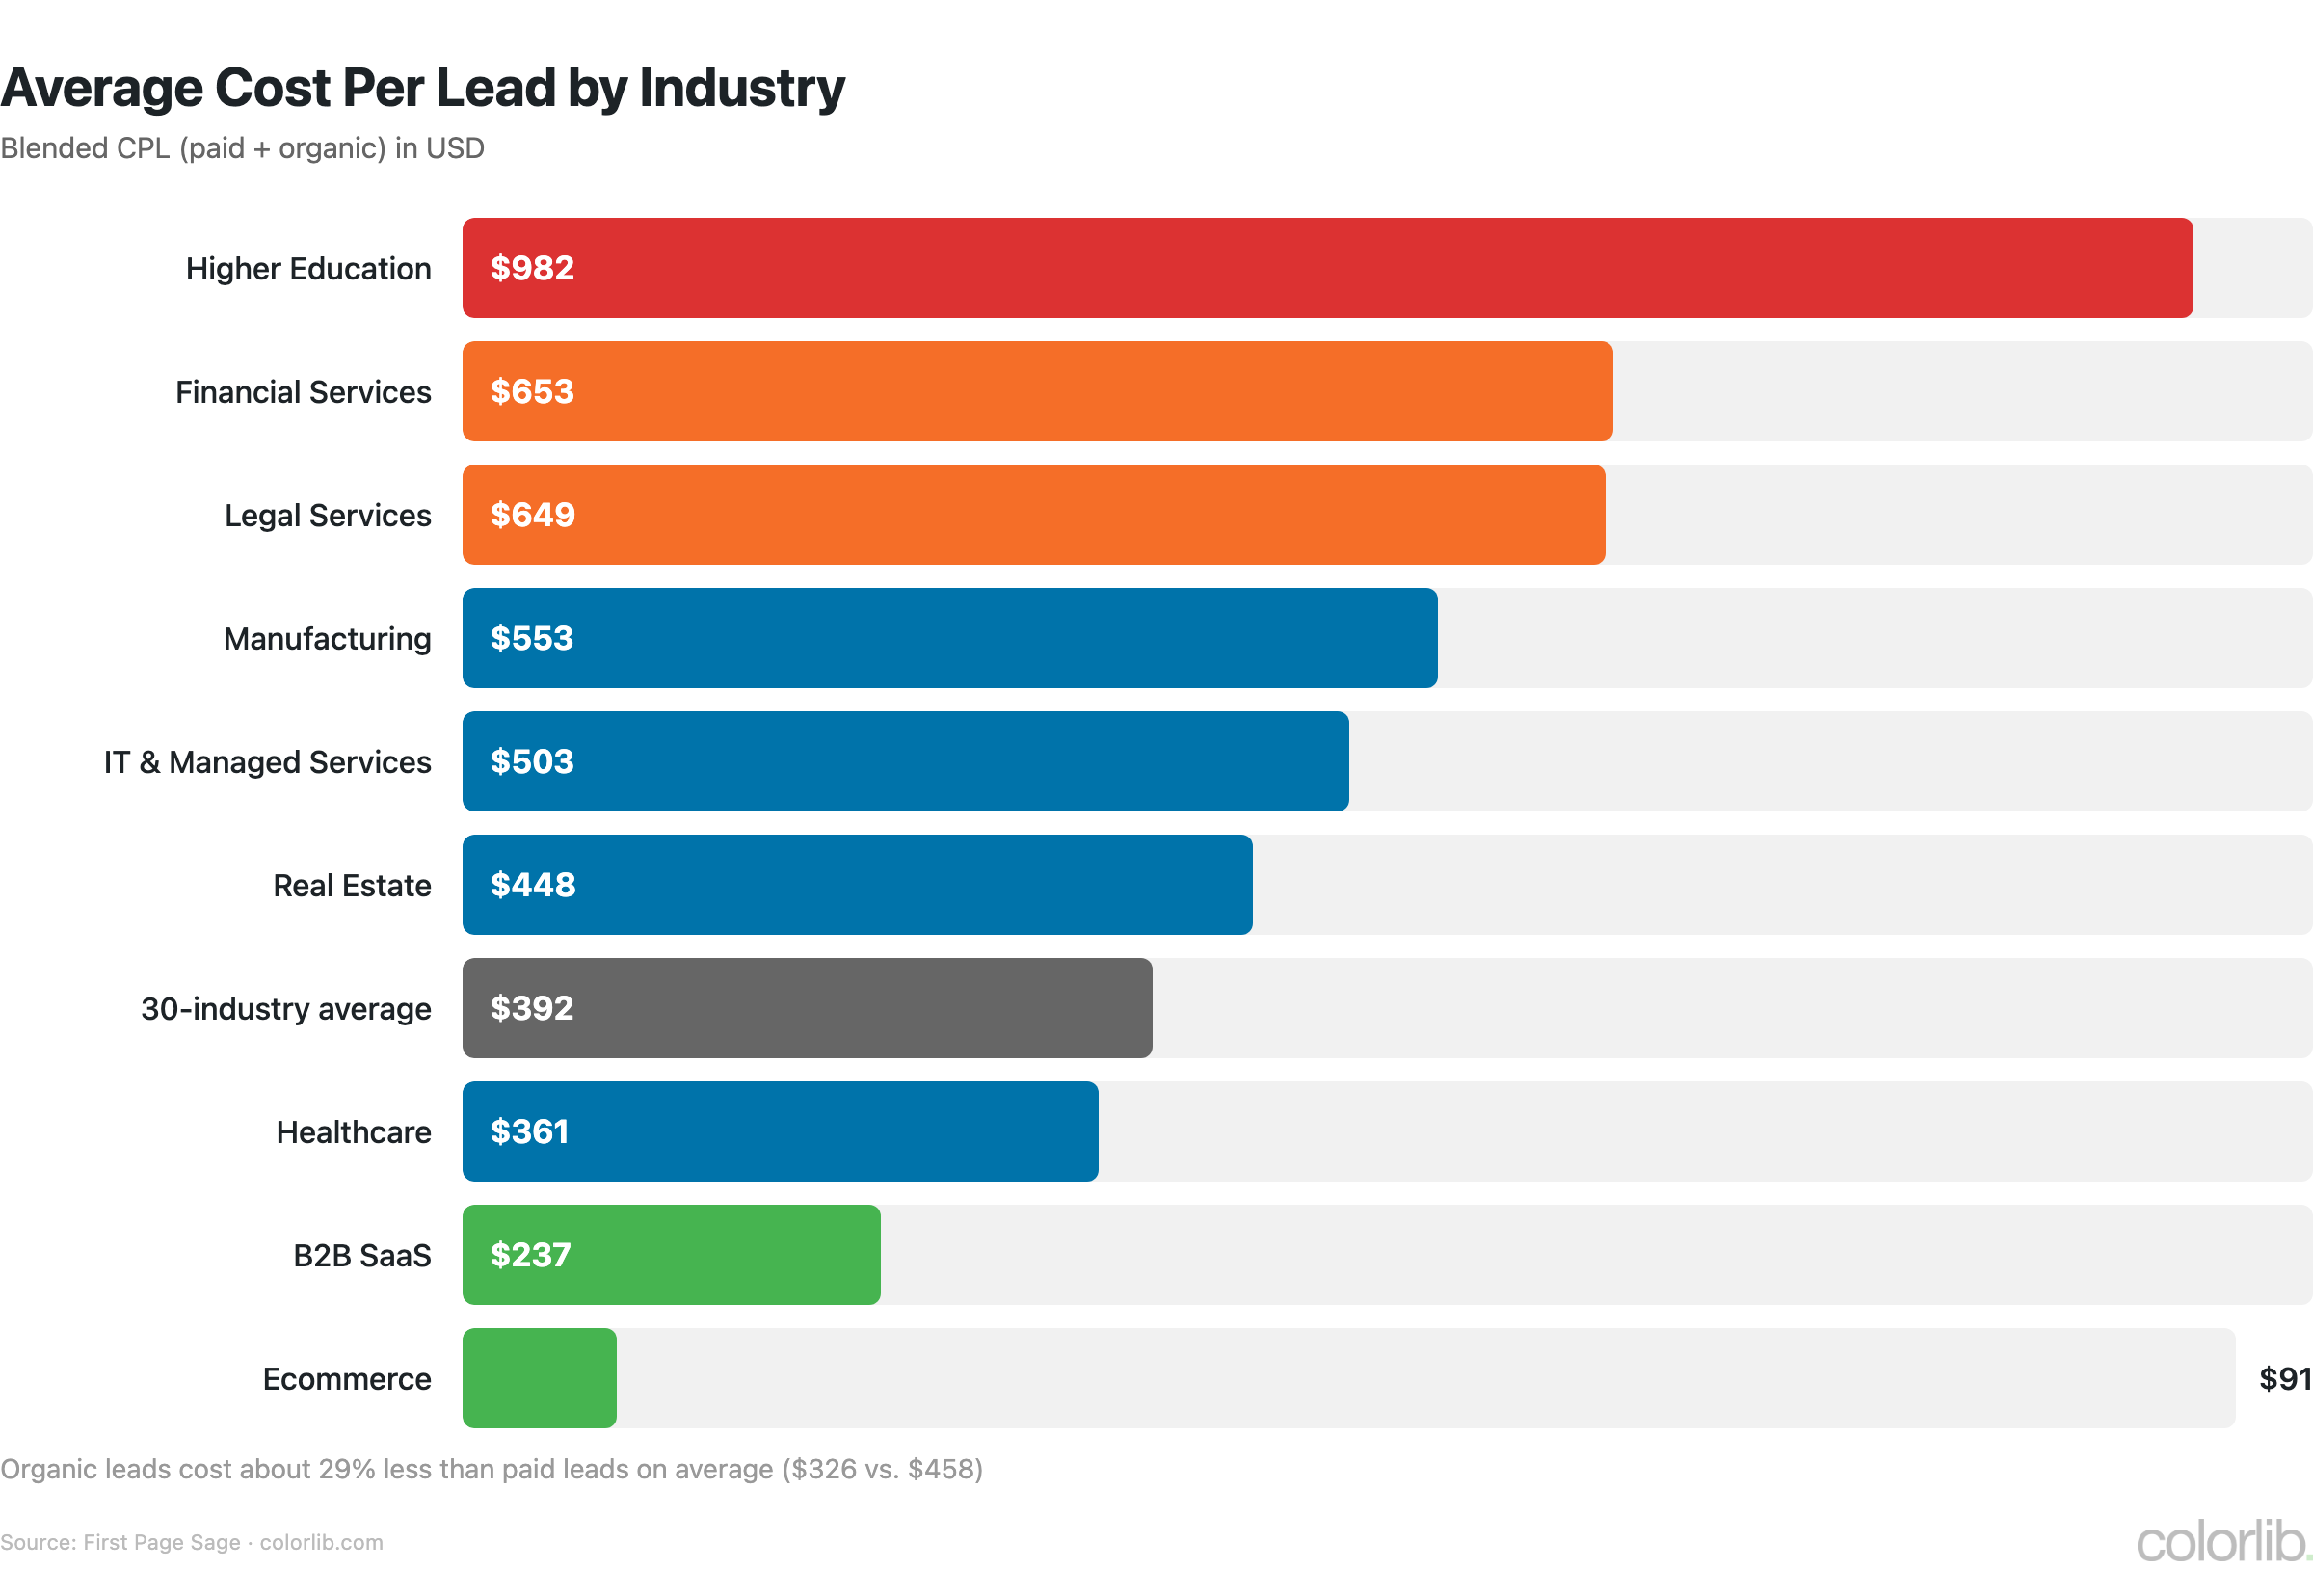
| IT & Managed Services | $503 | First Page Sage |
| Financial Services | $653 | First Page Sage |
| Healthcare | $361 | First Page Sage |
| Legal Services | $649 | First Page Sage |
| B2B SaaS | $237 | First Page Sage |
| Real Estate | $448 | First Page Sage |
| Higher Education | $982 | First Page Sage |
| Ecommerce | $91 | First Page Sage |
| Manufacturing | $553 | First Page Sage |
| Simple average of 30 industries | $392 | First Page Sage |
- Higher education leads are the most expensive at $982 blended CPL, followed by financial services ($653) and legal services ($649), where competition for high-value keywords is extreme
- Ecommerce has the lowest blended CPL at $91, closely followed by HVAC ($92)
- Organic leads cost about 29% less than paid leads on average across the 30 industries First Page Sage tracks ($326 vs. $458)
Top Lead Generation Channels
| Channel | Effectiveness Rating | Source |
|---|---|---|
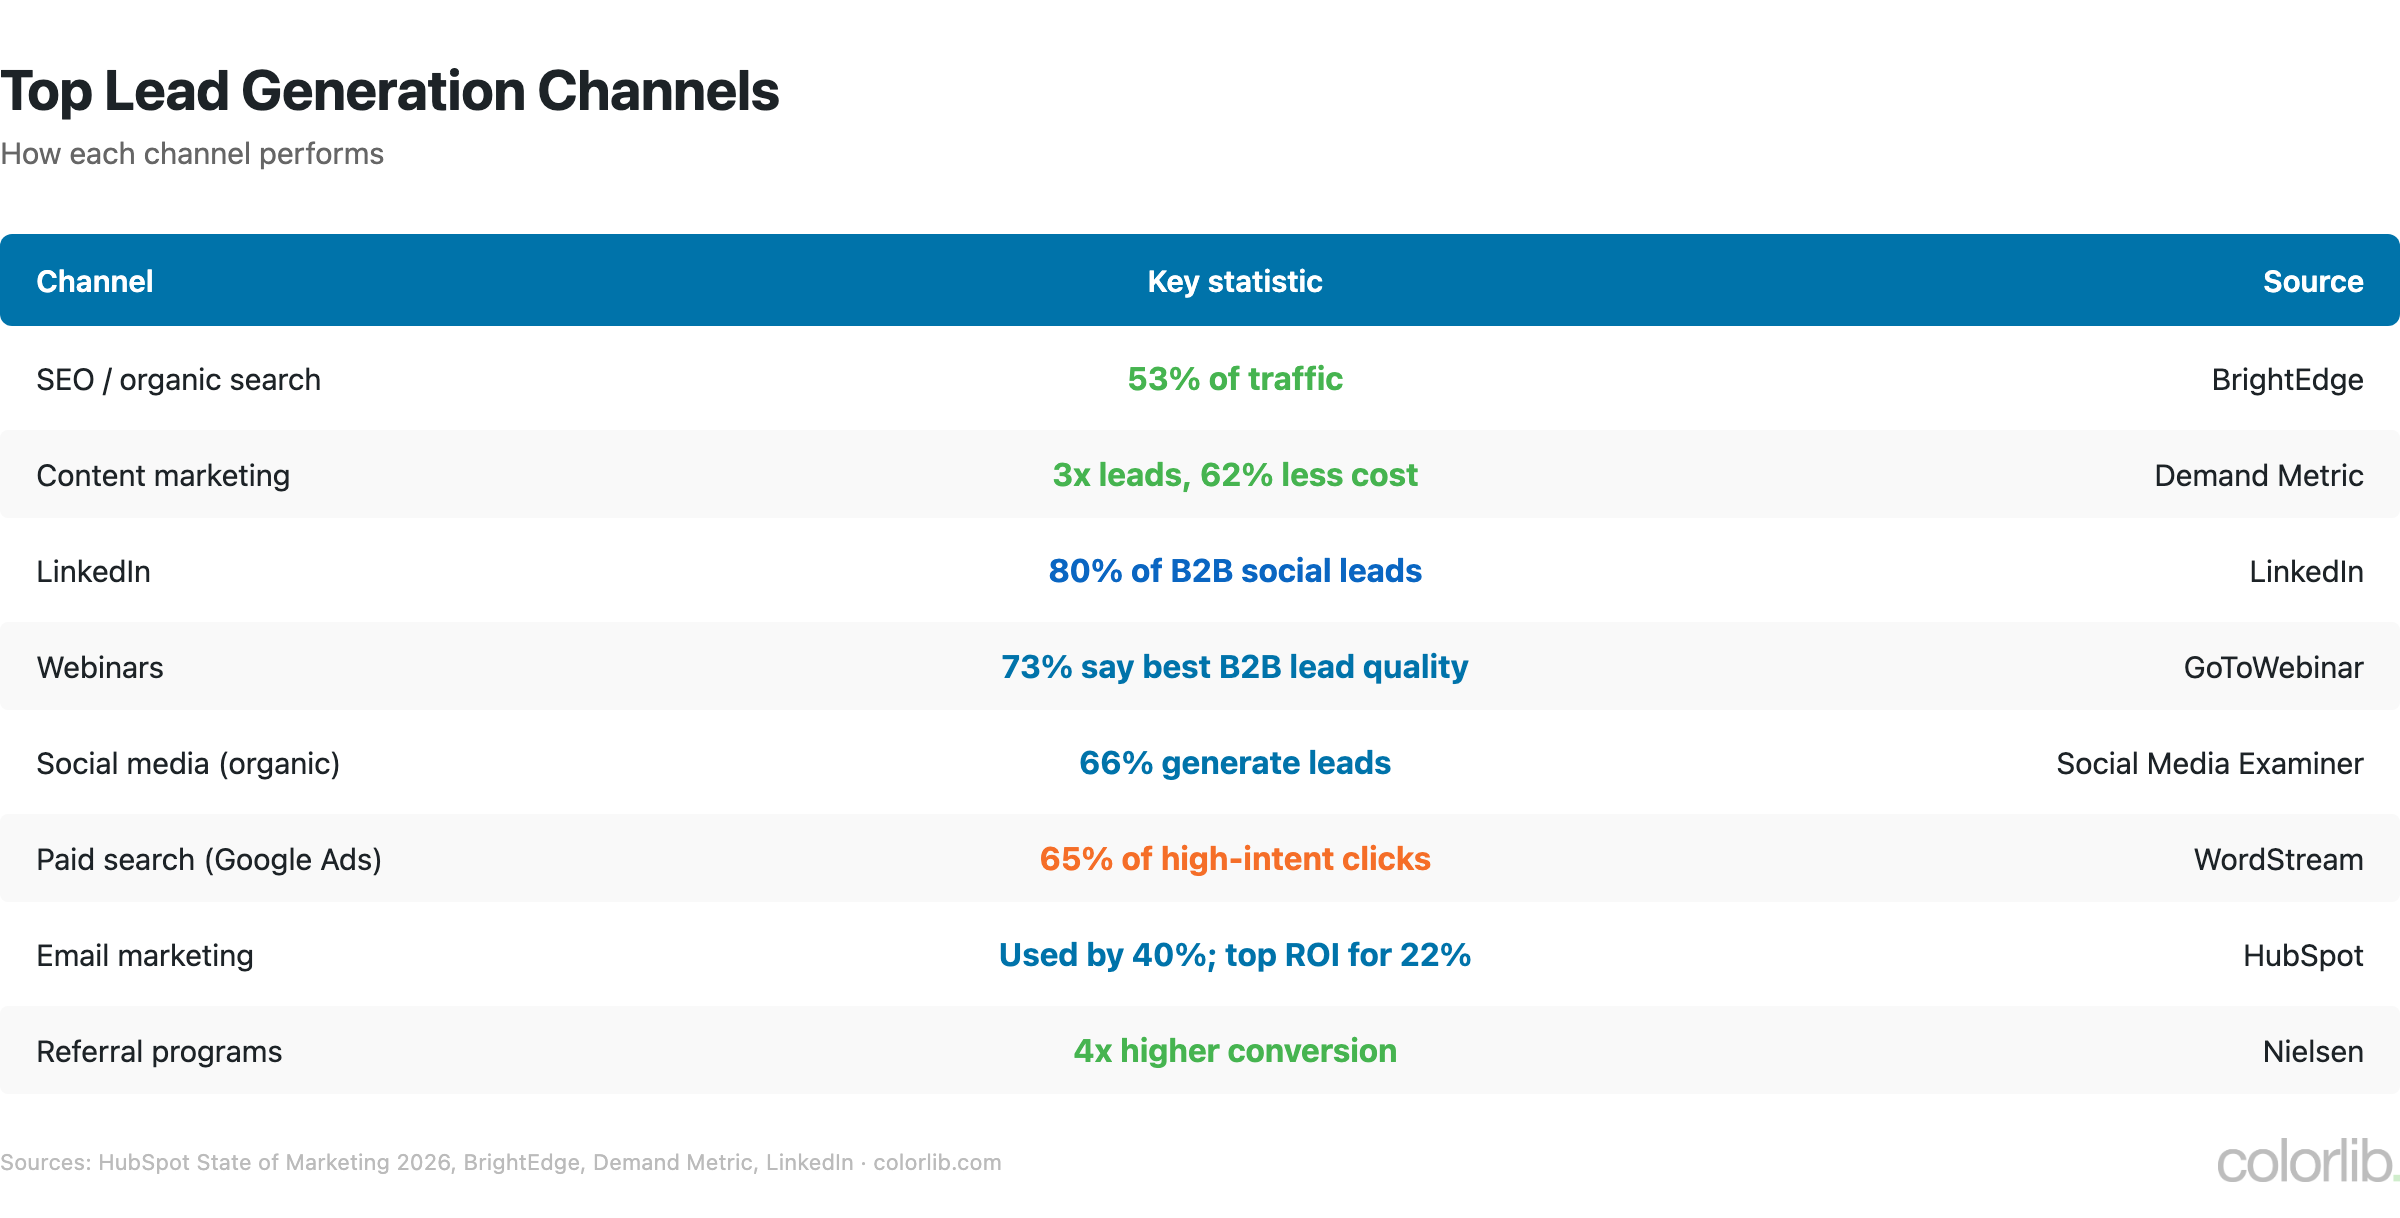
| Email marketing | Used by 40% of marketers; top ROI channel for 22% | HubSpot |
| SEO / Organic search | #1 for volume (53% of traffic) | BrightEdge |
| Content marketing | 3x more leads at 62% less cost | Demand Metric |
| 80% of B2B social leads | ||
| Webinars | 73% say best for quality B2B leads | GoToWebinar |
| Paid search (Google Ads) | 65% of high-intent clicks | WordStream |
| Social media (organic) | 66% of marketers generate leads | Social Media Examiner |
| Referral programs | 4x higher conversion than other channels | Nielsen |
- Email ties with organic social as the #2 most-used marketing channel (40% of marketers), and 22% rank it among their top ROI channels; website, blog and SEO rank #1 at 27% (HubSpot State of Marketing 2026)
- Webinars generate the highest quality B2B leads, with 20-40% of attendees becoming qualified prospects
- Referral leads convert at 3.6% — 4x higher than the average across all channels (0.9%)
- 84% of B2B decision-makers start the buying process with a referral, making word-of-mouth the most trusted channel
- Multi-channel lead gen strategies produce 300% higher response rates than single-channel approaches
Landing Page Statistics
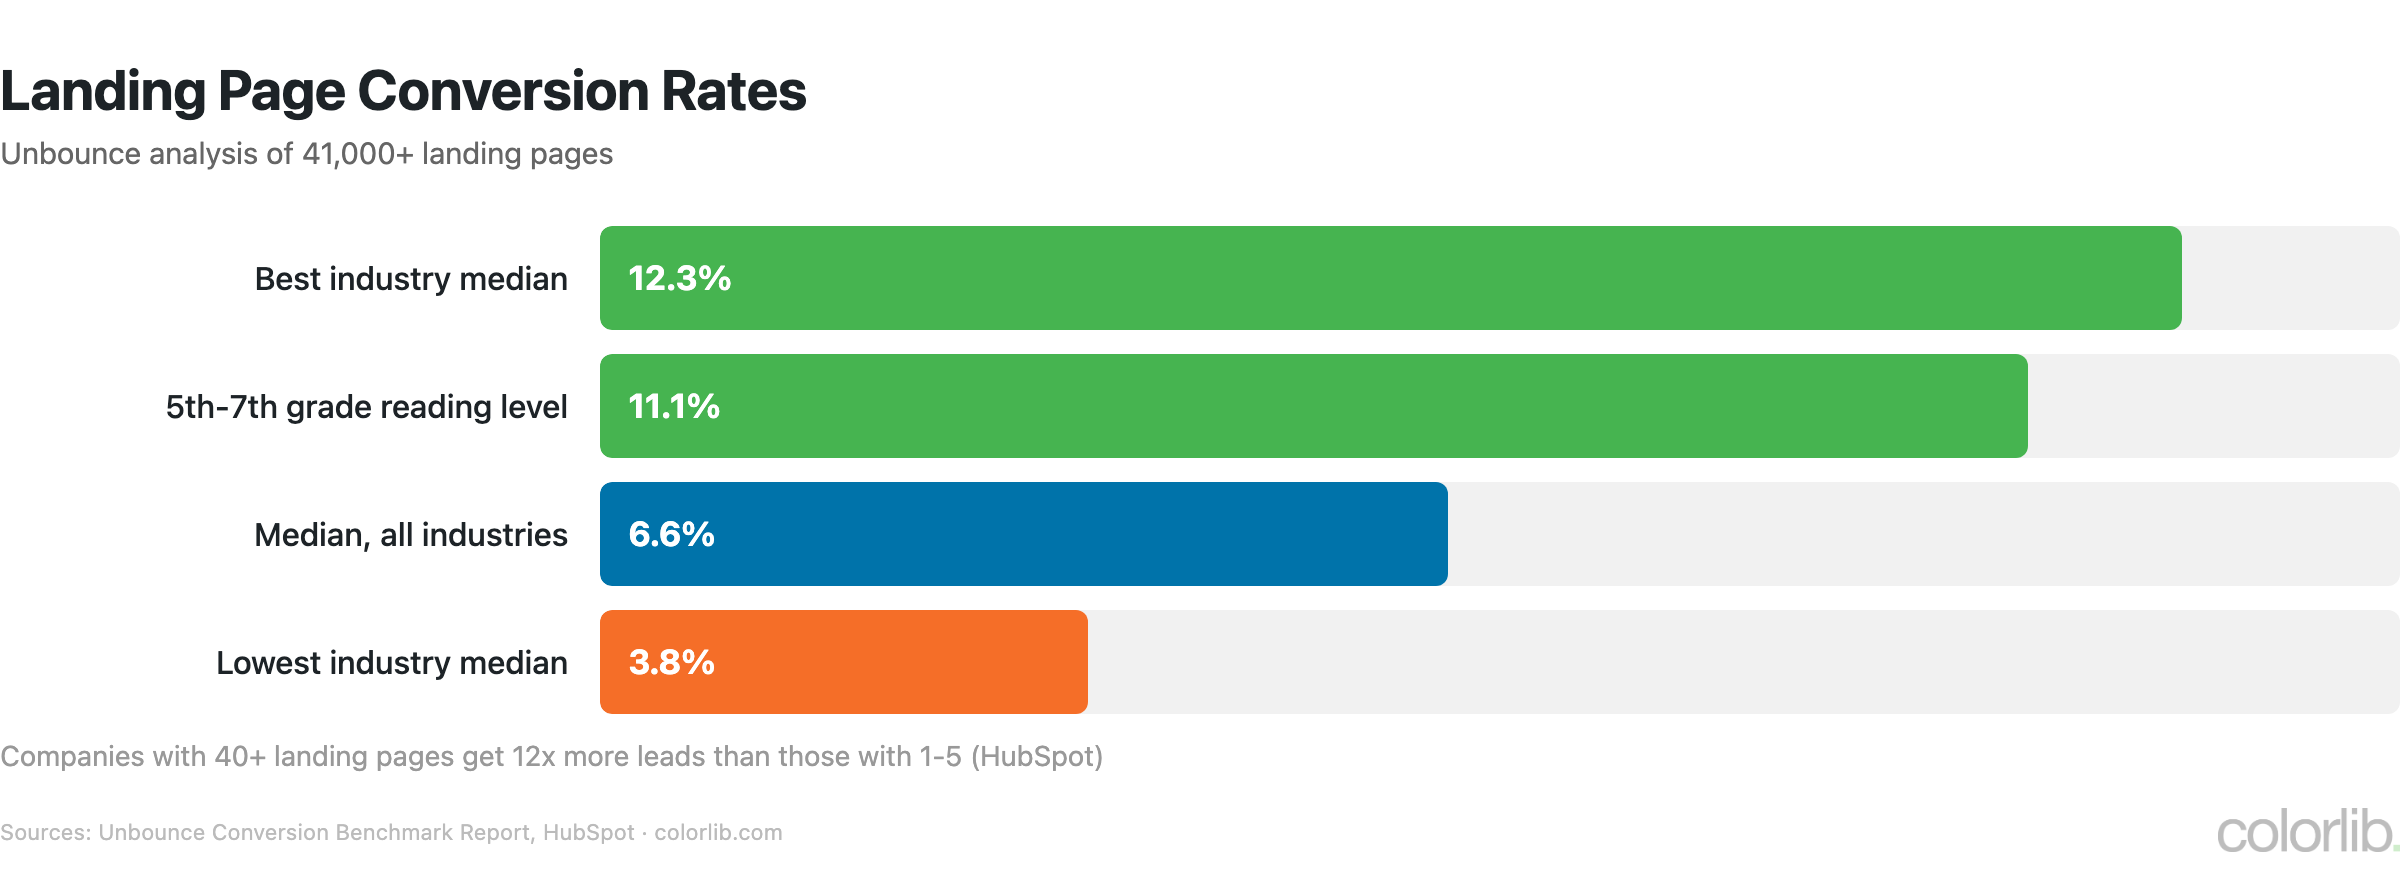
| Metric | Value | Source |
|---|---|---|
| Median landing page conversion rate | 6.6% | Unbounce |
| Median conversion range by industry | 3.8% to 12.3% | Unbounce |
| Pages written at a 5th-7th grade reading level | 11.1% conversion | Unbounce |
| Companies with 40+ landing pages | 12x more leads | HubSpot benchmark data |
| A/B tested landing pages | 12% higher conversion | VWO |
| Page load speed impact | Every 1s delay = 7% fewer conversions | Aberdeen Group (2008) |
- The median landing page converts at 6.6% across industries, and pages written at a 5th-7th grade reading level convert at 11.1% — 56% higher than pages written at an 8th-9th grade level (Unbounce, 41,000+ landing pages)
- Removing navigation from a landing page doubled conversions (+100%) in a widely cited Yuppiechef A/B test
- Adding social proof (testimonials, logos) increases landing page conversions by 34%
- Long-form landing pages (below the fold) generate 220% more leads than short above-the-fold CTAs for complex offers
- Personalized landing pages based on referral source convert 2x better than generic pages
B2B vs. B2C Lead Generation
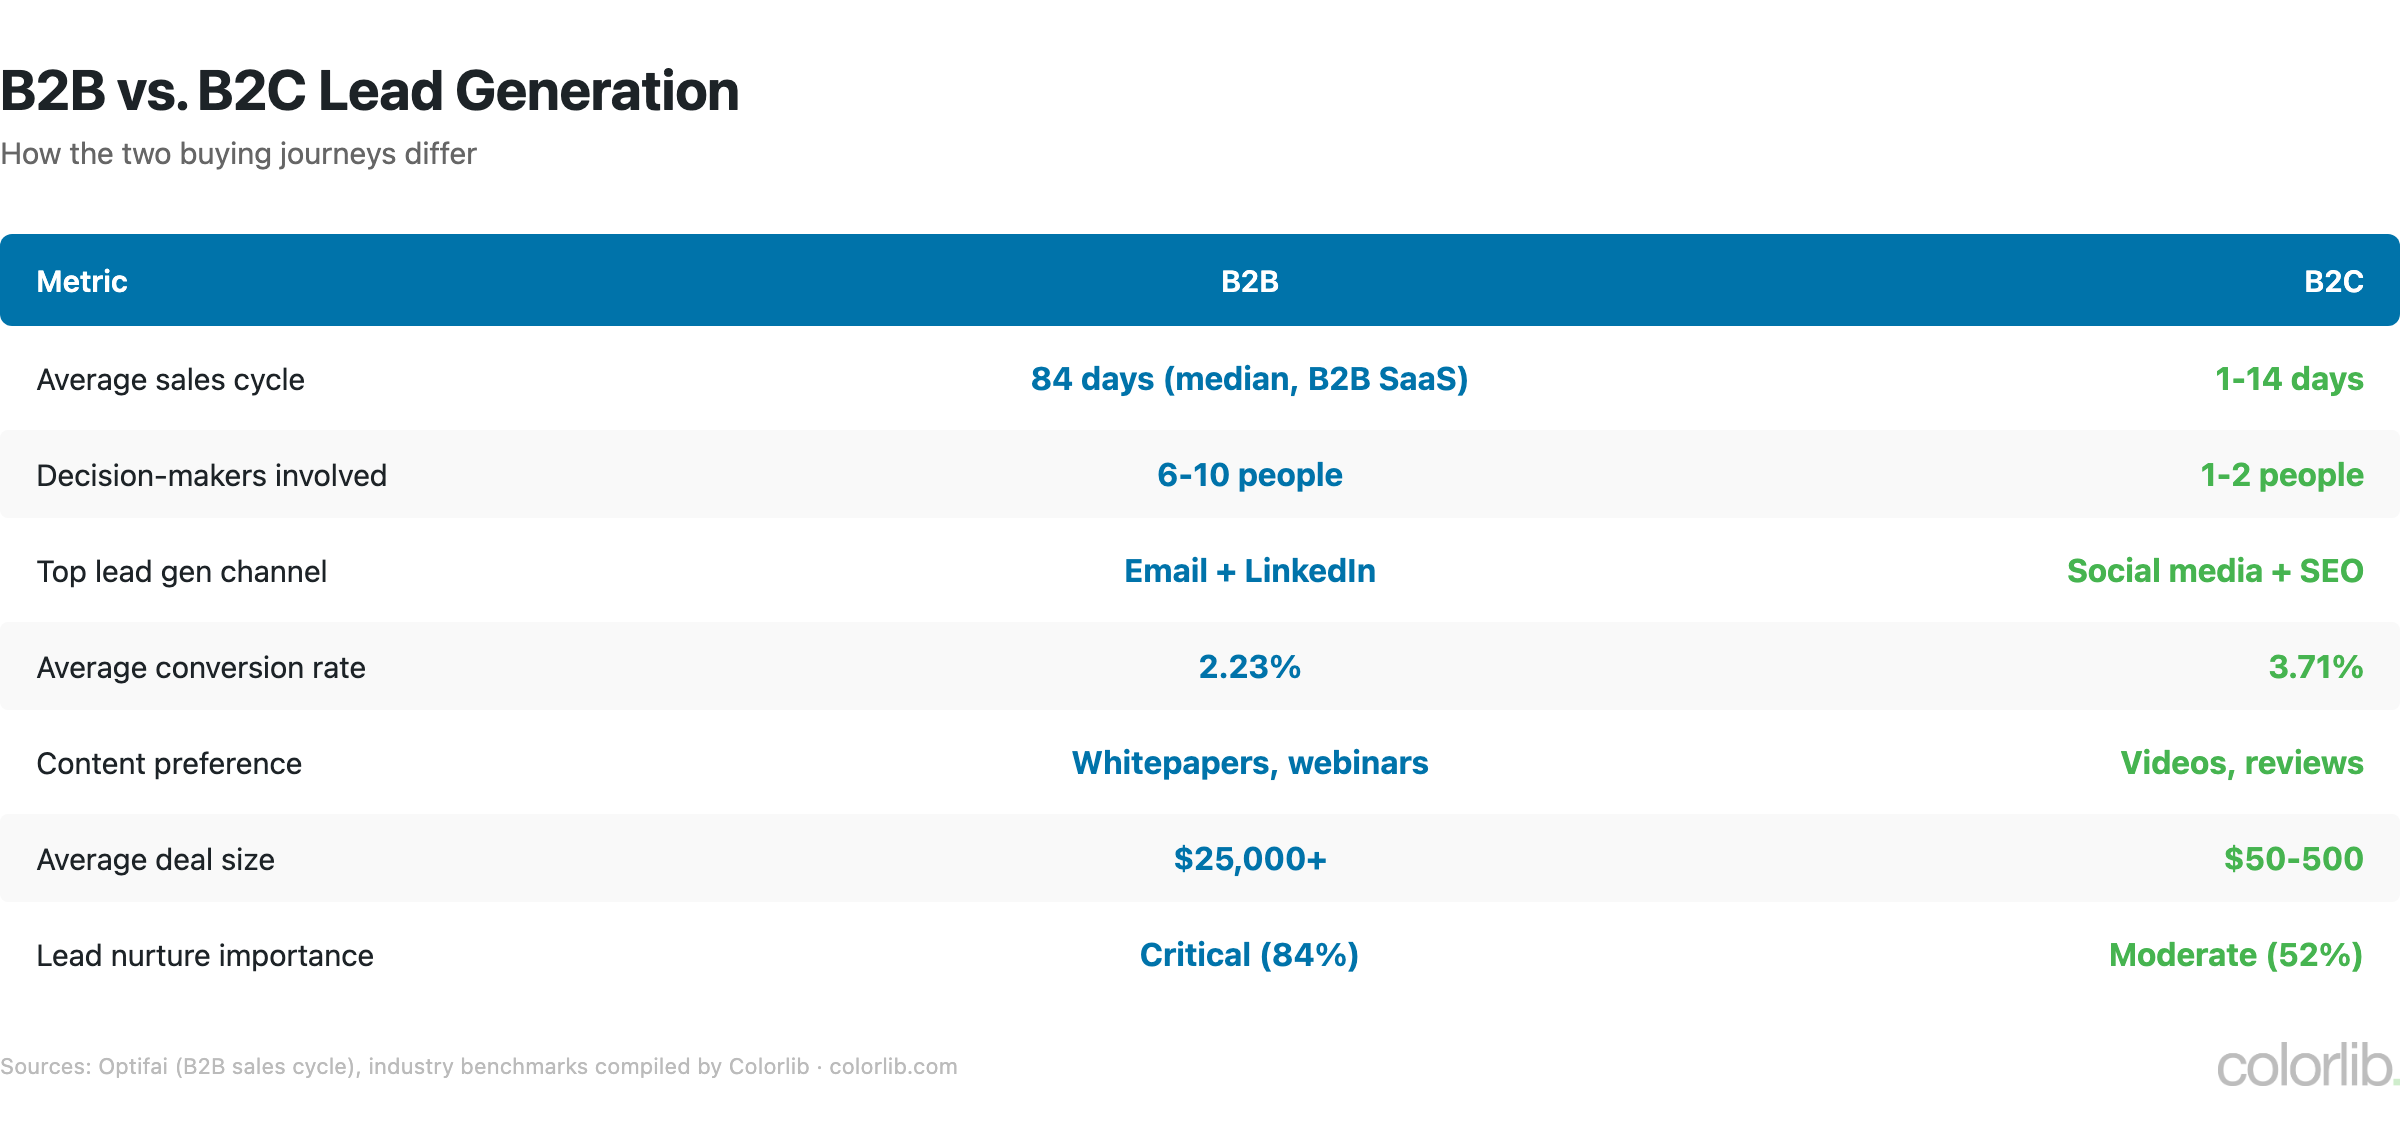
| Metric | B2B | B2C |
|---|---|---|
| Average sales cycle | 84 days (median, B2B SaaS) | 1-14 days |
| Decision-makers involved | 6-10 people | 1-2 people |
| Top lead gen channel | Email + LinkedIn | Social media + SEO |
| Average conversion rate | 2.23% | 3.71% |
| Content preference | Whitepapers, webinars | Videos, reviews |
| Average deal size | $25,000+ | $50-500 |
| Lead nurture importance | Critical (84%) | Moderate (52%) |
- B2B purchases now involve an average of 6-10 decision-makers, up from 5-6 five years ago
- 77% of B2B buyers say their last purchase was “very complex or difficult”
- B2C impulse purchases account for 40% of all ecommerce spending
- B2B leads nurtured with targeted content produce 20% more sales opportunities
- The B2B buyer journey is now 70% complete before a prospect contacts sales (Forrester)
AI & Automation in Lead Generation
| Tool / Tactic | Impact | Source |
|---|---|---|
| Marketing automation | 451% increase in qualified leads | Annuitas Group |
| Automated email nurture | 2x conversion vs. manual | Omnisend |
| Marketers satisfied with how they use data for personalization | 1 in 4 | Salesforce |
| Marketers using AI for content creation | 80% | HubSpot |
| Marketers using AI for media production | 75% | HubSpot |
- Marketing automation delivers a 451% increase in qualified leads — the single largest impact of any lead gen technology
- AI lead scoring prioritizes the top 20% of leads that typically generate 80% of revenue
- 80% of marketers use AI for content creation, including lead magnets like ebooks, guides and templates, and 75% use it for media production (HubSpot State of Marketing 2026)
- Companies using marketing automation see a 14.5% increase in sales productivity and a 12.2% reduction in marketing overhead
Key Takeaways
- Lead gen is the #1 marketing challenge. 61% of marketers named it their top challenge in HubSpot’s State of Inbound survey. Only 27% of leads are sales-ready — nurturing is non-negotiable.
- CPL varies wildly by industry. $91 for ecommerce, $982 for higher education. Know your benchmark, then optimize relentlessly.
- Content marketing is the best value. 3x more leads at 62% less cost. Pair it with SEO and you have the most cost-effective lead engine available.
- Landing pages are conversion machines. 40+ pages = 12x more leads. The median page converts at 6.6%, and simple, readable copy converts best.
- Marketing automation is a game-changer. 451% more qualified leads. Companies using it see 14.5% higher sales productivity.
- Quality beats quantity. 54% of marketers now prioritize lead quality. AI, automation, and targeted nurture sequences are the tools closing the gap.
Sources
- HubSpot — State of Marketing Report
- First Page Sage — Average Cost Per Lead by Industry
- Demand Metric — Content Marketing ROI
- HubSpot — Marketing Statistics
- Unbounce — Conversion Benchmark Report (2024)
- LinkedIn — B2B Marketing Solutions
- Salesforce — State of Marketing (10th edition)
- Forrester — B2B Buyer Journey Research
- Annuitas Group — Marketing Automation Study
Frequently Asked Questions
What is the average cost per lead?
Blended cost per lead (paid and organic) averages about $392 across the 30 industries First Page Sage tracks, but it varies dramatically by sector: ecommerce leads average just $91, while higher education leads cost $982 and legal services $649. B2B SaaS leads average $237. Organic leads cost about 29% less than paid leads on average, making SEO one of the most cost-effective long-term strategies. For related data, see our digital marketing statistics.
What is the best channel for B2B lead generation?
Website, blog and SEO efforts are the #1 ROI-driving channel (27% of marketers), with email used by 40% of marketers and ranked a top ROI channel by 22% (HubSpot State of Marketing 2026). LinkedIn is the dominant social platform, generating 80% of B2B social leads. Webinars are rated highest for lead quality, with 20-40% of attendees becoming qualified prospects. The most effective approach combines email, content marketing, and LinkedIn into an integrated strategy.
How many landing pages should a business have?
Research shows that companies with 40+ landing pages generate 12x more leads than those with 1-5 pages. More landing pages means more targeted offers for different audiences, keywords, and campaign types. The median landing page converts at 6.6% across industries, and pages written at a 5th-7th grade reading level convert at 11.1% (Unbounce).
Does marketing automation really improve lead generation?
Yes — companies using marketing automation see a 451% increase in qualified leads, 14.5% higher sales productivity, and a 12.2% reduction in marketing overhead. Automated email nurture sequences convert at 2x the rate of manual sends. AI lead scoring helps prioritize the top 20% of leads that typically generate 80% of revenue. See our sales statistics for how this impacts the sales pipeline.
For more business data, explore our digital marketing statistics, sales statistics, and online shopping statistics.

Related Posts




Comments (0)