Website Statistics (How Many Websites Are There?)
Wondering how many websites there are out there? Find out as we explore some of the most eye-opening website statistics.
The World Wide Web has come a long way since its inception. There are over a billion websites out there, and that figure is growing daily.
In this post, we’ll examine stats and facts that tell us more about the internet’s growth over time and the most popular websites. We’ll also reveal useful website benchmarks and recent trends that web and business owners need to know.
Ready? Let’s get started!
Website statistics (top picks)
- There are over 1.2 billion total websites…
- …and around 200 million active websites
- Around 157,000 new websites are made every single day
- 98% of small businesses have their own website
- Google is the most popular website in the world, with 1.1 trillion visits
- 53.96% of all website traffic happens on mobile
- 64.1% of all website traffic happens on Chrome
- There are over 628 million registered website domains
- 43% of websites are built on WordPress, making it the most popular CMS
- Nginx is the most popular website server and is used in 27% of all cases
- The average website conversion rate is 1.3%
- The average website bounce rate is 44.1% on desktop and 52.9% on mobile
- The first ever website went live in August, 1991
How many websites are there?
There are over 1.2 billion websites, but only around 199 million are active. According to Netcraft’s latest survey, widely considered the most reputable source.
However, it’s worth noting that figures vary depending on what source you look at. For example, according to Internet Live Stats, there were 1.88 billion websites last year. But again, over 75% of those sites were deemed inactive.
Number of websites by year
If we look at historical data on the number of websites, we can track the growth of the internet over time.
Here’s a breakdown of the number of websites each year according to Netcraft’s survey:
| Year* | Total number of websites (hostnames) | Total number of active websites |
| 2024 | 1.2 billion | 200 million |
| 2023 | 1.19 billion | 199.7 million |
| 2022 | 1.17 billion | 199 million |
| 2021 | 1.2 billion | 199.5 million |
| 2020 | 1.3 billion | 189 million |
| 2019 | 1.52 billion | 182.2 million |
| 2018 | 1.81 billion | 171.6 million |
| 2017 | 1.8 billion | 172.4 million |
| 2016 | 906.6 million | 170.3 million |
| 2015 | 876.8 million | 177.1 million |
| 2014 | 861.4 million | 180.1 million |
| 2013 | 629.9 million | 186.8 million |
| 2012 | 582.7 million | 182.4 million |
| 2011 | 273.3 million | 101.8 million |
*Data has been taken from the January monthly survey for each year, except for the latest March 2023 survey, as noted in the table above.
The general trend shows that active websites have increased substantially over the last decade, with the greatest leaps occurring between 2011 and 2012, and between 2016 and 2017.
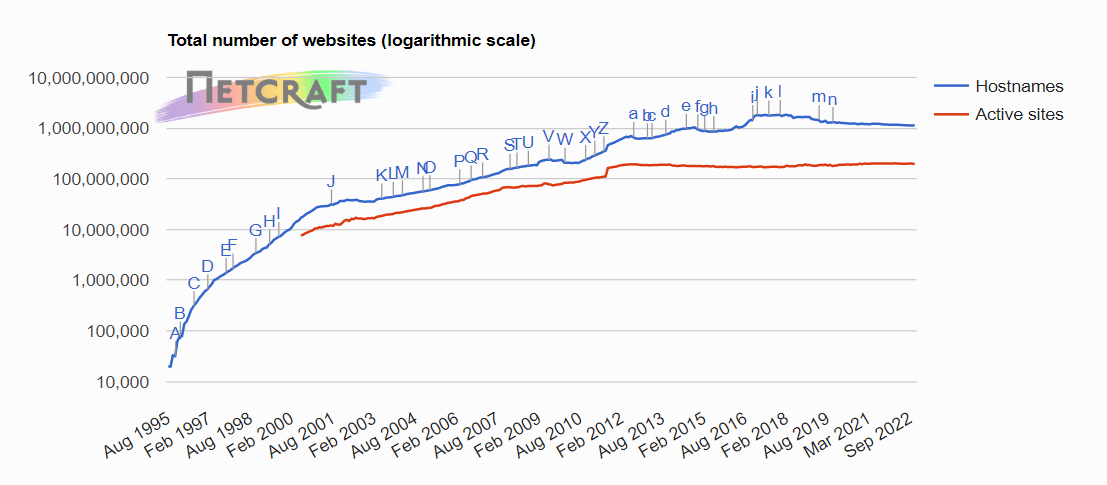
However, it’s also clear that this growth has not been linear. There have been periodic declines in total and active sites, most notably between 2013 and 2016.
Notably, these periodic drops don’t necessarily reflect a true decline in the number of websites. They can be caused by many factors including changes in how Netcraft handles wildcard hostnames.
To count active sites, Netcraft retrieves the front page from each hostname on an IP address and looks for unique content. This allows them to exclude sites from a standard or computer-filled template, providing a more accurate picture of the web than counting hostnames or distinct IP addresses.
How many websites are there in the US?
It’s difficult to know how many websites there are in the US, as it depends on how you determine a website’s location.
Websites aren’t technically located in any country—they exist virtually and don’t have a tangible, physical presence. But they can be hosted and managed in specific countries.
That said, the best way we can categorize websites by country is probably by looking at the number of registered domains. This doesn’t exactly reflect the number of websites in each country, but it’s a good estimation.
In that case, there are 136.3 million websites in the US, which represents 21.6% of all domains registered in the country.
Number of website domains by country:
| Country | Number of domains | Share of total domains |
| USA | 136.3 million | 21.6% |
| China | 20.5 million | 3.2% |
| Canada | 16.6 million | 2.6% |
| Iceland | 15.5 million | 2.5% |
| Netherlands | 8.4 million | 1.3% |
| France | 7.7 million | 1.2% |
| Germany | 6.7 million | 1.1% |
| UK | 6.6 million | 1% |
| Japan | 6.3 million | >1% |
How many websites are made per day?
According to our calculations, around 157,000 websites are made every day. That works out at around 6,530 new websites every hour, 109 every minute, and 2 every second. So by the time you’ve finished reading this article, there will already be hundreds of new sites on the web.
But note that these are just estimations.
There is no good data on the number of websites made per day, so we had to calculate it ourselves using data from Netcraft. The latest March 2023 survey showed an increase of 4.7 million websites, so we extrapolated the daily figure from this.
How many website pages are there?
According to the current daily estimate by WorldWideWebSize, over 3.14 billion website pages are indexed on search engines like Google.
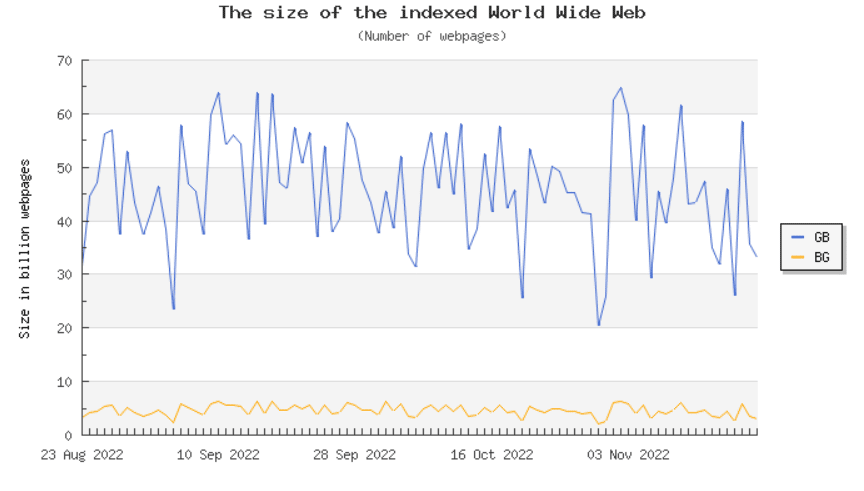
However, as this excludes web pages that aren’t indexed, the total number of web pages is likely significantly higher. Other sources put estimations at over 50 billion.
And throughout the entire web history, there have been many more website pages. Over 766 billion web pages are archived by the Internet Archive Way Back Machine.
What percentage of businesses have a website?
According to a recent survey, 98% of small business owners have a website.
Interestingly, this is up substantially from previous years. A previous study from 2021 estimated that only 71% of small businesses had a website. And in 2018, that figure was even lower at just 50%.
The increase may have something to do with the coronavirus pandemic. Global lockdowns forced businesses to adapt and emphasize digital marketing more to continue connecting with customers who could no longer visit them in-store.
Sources: Internet Archive: Wayback Machine, WorldWideWebSize, Statista, Domain Name Stat, ICANN, Expert Market
How many websites are in English?
According to data from W3Tech, 60.3% of all websites are in English, making it by far the most common language used on the Internet. Around 5.4% of websites are in Russian, making it the second most common language on the web.
Top 10 most used languages on websites:
- English – 60.3%
- Russian – 5.4%
- Spanish – 4.1%
- German – 3.4%
- Frech – 3.2%
- Turkish – 3%
- Japanese – 2.8%
- Persian – 2.5%
- Chinese – 1.7%
- Italian – 1.5%
Source: W3Tech1
What’s the most popular website in the world?
Google is the most popular website in the world by a large margin. It has more than twice as many total visits as its nearest competitor, YouTube, which also happens to be owned by Google.
The number of visits each website gets depends on what data source and time period you look at. Here’s a breakdown of the top 10 most popular websites according to Similarweb and Semrush, alongside their website traffic.
Most popular websites by traffic (Similarweb):
- Google – 1.1 trillion
- YouTube – 408.9 billion
- Facebook – 265.8 billion
- Twitter – 78.9 billion
- Instagram – 74.2 billion
- Baidu – 67.1 billion
- Wikipedia – 66.9 billion
- Yahoo – 43.5 billion
- Yandex – 43.1 billion
- XVideos – 40.8 billion
Most popular websites by traffic (Semrush):
- Google – 45.4 billion
- YouTube – 14.3 billion
- Facebook – 11.7 billion
- Wikipedia – 6 billion
- Amazon – 3.1 billion
- Instagram – 3.1 billion
- Yahoo – 2.6 billion
- Yandex – 2.4 billion
- Twitter- 2.4 billion
- Pornhub – 2.3 billion
As you can see, there’s a lot of overlap between both sources. In both cases, the top 10 most popular websites are dominated by three distinct categories: search engines, social media platforms, and adult websites.
Sources: Similarweb, Semrush
Website traffic statistics
More than half of all website traffic now comes through mobile devices. This is in stark comparison to a decade or so ago when the vast majority of website traffic happened on desktops.
And this has sparked a dramatic shift in website design—mobile responsiveness is now a top priority.
Website traffic by device
Here’s a breakdown of total website traffic by the device as of 2022:
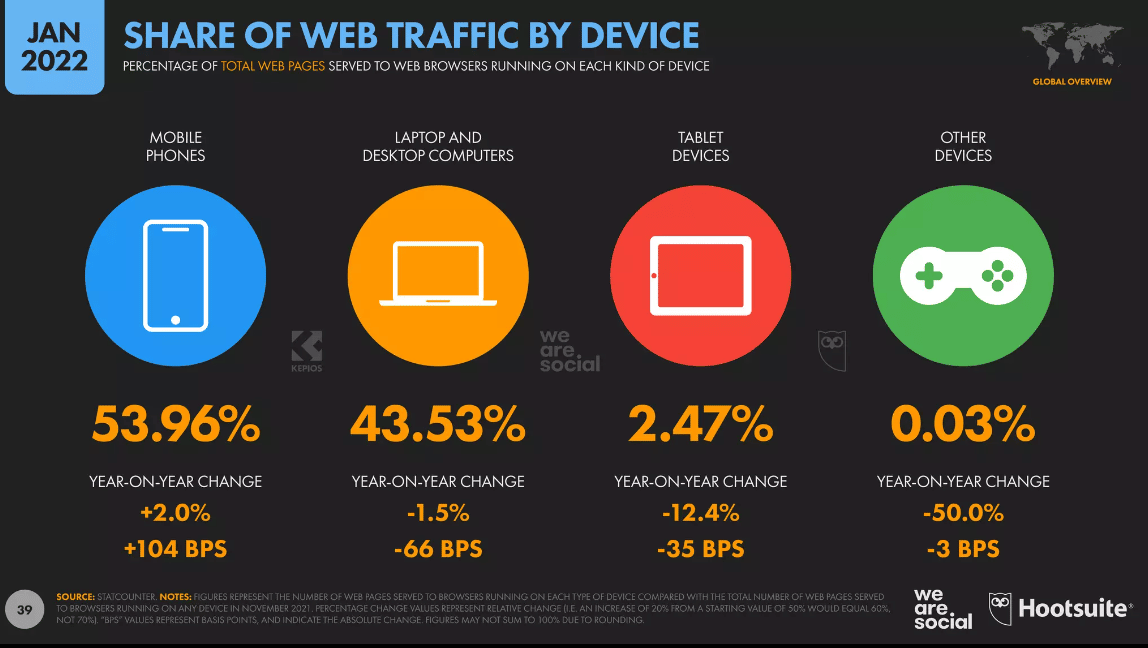
- 53.96% of website traffic happens on mobile phones.
- 43.53% of website traffic happens on laptop/desktop computers
- 2.47% of website traffic happens on tablets
- 0.03% of website traffic on other devices (e.g. game consoles)
But interestingly, while 53.96% is the global average share of mobile website traffic, this figure varies from country to country.
For example in Nigeria, a whopping 83.5% of website traffic comes from mobile. While in Denmark, only 27.4% of website traffic happens on mobile devices. In the USA, the share of mobile website traffic is 46.5%—a little below the global average.
Mobile share of website traffic over time:
- 2021 – 54.4%
- 2020 – 52.4%
- 2019 – 52.6%
- 2018 – 47.1%
- 2017 – 51%
- 2016 – 48.3%
- 2015 – 38.4%
- 2014 – 31.3%
- 2013 – 20%
- 2012 – 12.9%
- 2011 – 7.2%
Website traffic by browser
Chrome is the clear market leader when it comes to internet browsers and accounts for over half of all website traffic. Here’s a breakdown of website traffic by browser:
- Chrome – 64.1%
- Safari – 19.2%
- Microsoft Edge – 4.2%
- Firefox – 3.9%
- Samsung Internet – 2.8%
- Opera – 2.3%
- UC Browser – 0.9%
- Other – 2.5%
Most visited types of websites (and apps)
Chat and messaging websites and apps get the most website traffic. Over 95% of internet users visit this type of website/app every month. Unsurprisingly, social networks and search engines are also very popular.
The figures below represent the percentage of all internet users that have visited each type of website in the last month.
Top 10 most visited website types:
- Chat and messaging – 95.6%
- Social networks – 95.2%
- Search engines – 83.6%
- Shopping, actions, and classifieds – 58.1%
- Maps and location-based services – 56.9%
- Email – 46.9%
- News – 42.3%
- Weather – 41.9%
- Entertainment – 40.5%
- Games – 34.8%
Source: DataReportal
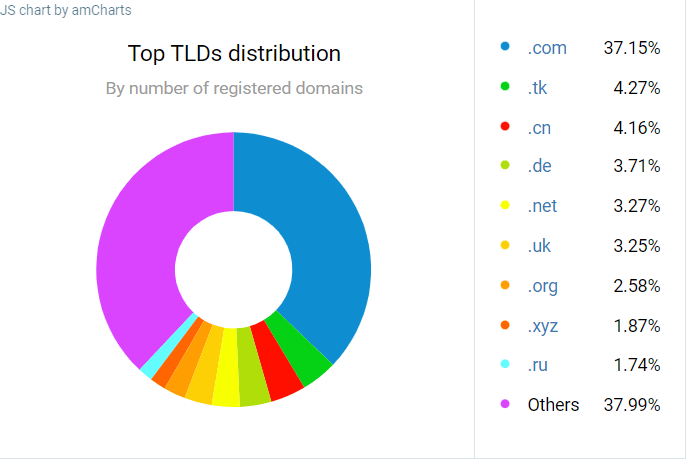
Website domain statistics
There are currently over 628.5 million registered domains, up from 438.4 million at the end of 2021 and 201.6 million at the end of 2020.
Interestingly, the USA has more registered domains than any other country (135.2 million, or 21.5% of the market share).
And .com is the most popular top-level domain (TLD), accounting for 233.6 million or 37.16% of all registered domains.
GoDaddy most popular domain registrar, with 77.2 million registrations and a 12.27% market share
Sources: Domain Name Stat, ICANN
Website software statistics
WordPress is the most popular software for building and managing websites, and Nginx is the most popular website server software. Shopify is the most popular software used to build ecommerce websites.
What is the most popular website CMS?
Over 43% of websites are built on WordPress, making it the most popular website CMS.
Top 10 most popular website CMS software (by % of total websites):
- WordPress – 43%
- Shopify – 4.1%
- Wix – 2.3%
- Squarespace – 2%
- Joomla – 1.7%
- Drupal – 1.2%
- Adobe Systems – 1.1%
- Google Systems – 0.9%
- Bitrix – 0.8%
- Webflow – 0.6%
What is the most popular web server software?
Nginx is the most widely used web server software, with a market share of 26.61%. Apache comes second at 21.40%
Most popular web servers (by market share):

- Nginx – 21%
- Apache – 19%
- Cloudflare – 11%
- Openresty – 11%
- Google – 5%
- Litespeed – 4%
- Microsoft – 2%
Website benchmarks
Next, let’s look at some website statistics that you can use as benchmarks to measure your own performance against.
These are the average metrics based on a study of over 1,800 websites:
- Website conversion rate – 1.3% (1.9% desktop, 1% mobile)
- Pages per session – 2.6
- Sessions per user – 1.4
- Bounce rate (from desktop Google search) – 44.1%
- Bounce rate (from mobile Google search) – 52.9%
- Time to full page load – 4.5 seconds
- Delay before page content – 2 seconds
- Use of internal search – 3.5%
Source: Littledata
Website downtime statistics
There were over 2.57 billion minutes of website downtime last year, collectively. To put that into perspective, you could watch a feature-length movie over 14 million times in that amount of time.
On average, there are around 14,000 website outages every hour.
Key statistics:
- 71% of surveyed companies have experienced unplanned website downtime
- 100% of surveyed companies have experienced planned downtime
- 80% of websites that don’t use an uptime monitoring tool find out about downtime from their customers
- 32% of people don’t know what downtime means
- Only 11% of people will revisit a website that they couldn’t access one time
- 32% of small companies experience downtime at least 18 times per month
Sources: Pingdom1, Pingdom2, StatusCake
What was the first website ever made?
The first website ever made was a static page that provided information on the World Wide Web project. It went live on August 6, 1991, and was made by Tim Berners-Lee. The project ran on a NeXT computer at CERN, and the website address was http://info.cern.ch/hypertext/WWW/TheProject.html
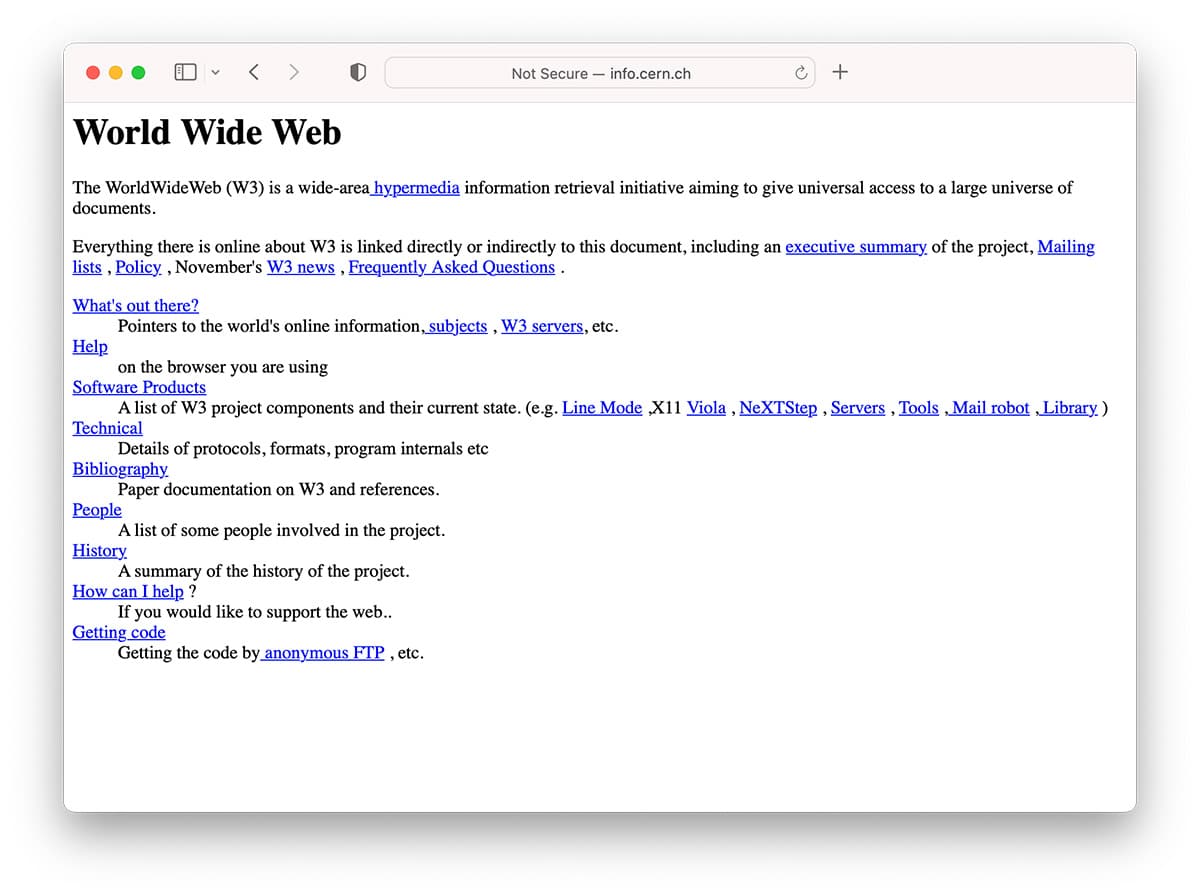
You can still browse it by clicking the link above; it was restored by CERN in 2013. Check it out—it’s fascinating!
A history of websites
Below, we’ve put together a timeline that illustrates some key milestones in developing websites and the world wide web in general. Let’s begin at the beginning.
1991 – The first website was created
1991 was the birth of the website, but the first ever site to go live looked nothing like websites as we know them today.
Initially, websites were built entirely through HTML, which meant design/layout opportunities were very limited. Those early sites were mostly text-based with few images and no real layout—just blocks of paragraph text and headings.
1993 – The web goes public
On 30 April 1993, CERN put the World Wide Web software into the public domain, which allowed the web to flourish.
Shortly after, all manner of websites started popping up.
By November of that year, the first-ever search engine website ALIWEB! was launched. It linked to the web’s best websites on one page (there weren’t many back then) and looked nothing like modern search engines.
By the end of 1993, there were already 623 websites. It might seem like a lot, but it’s an incredibly minuscule amount compared to the billions of sites on the web today.
1996 – Flash bursts onto the scene
1996 saw the introduction of two transformative new technologies: CSS and Flash.
Flash transformed the world of website design and allowed people to add interactive content and animations to their sites.
Meanwhile, CSS made it much easier to structure website design and separated the HTML content from its presentation.
In 1996, both the Amazon and eBay websites were also launched, which would soon become ecommerce giants.
1998 – Google was launched
On September 4, 1998, Google Beta went live. This was the precursor to the search engine giant that is now the world’s most visited website.
Around a year later, another notable website was launched—PayPal—though it didn’t really take off until the year 2000.
2003 – WordPress was launched
In 2003, the open-source free CMS WordPress was launched.
This was an important milestone in web development and design as it made it much easier for beginners to build and manage their own websites, and opened the doors for a flood of amateur web admins to burst onto the scene.
2004 – The birth of web 2.0
The phrase web 2.0 was first coined this year.
The term represented the second stage of the internet, in which websites were said to transition from static, boring web pages to interactive sites that emphasized user-generated content, rich applications, ease of use, and social interactions.
Unsurprisingly, the year of web 2.0 was also the year the first mainstream social networks began to appear. Facebook was launched in 2004, but it didn’t really start to take off until 2006.
By the end of this year, there were already over 51 million websites.
2010 – Responsive web design
By now, mobile phones were increasingly being used to browse the web. The iPhone had launched a few years before (in 2007), and mobile devices were becoming increasingly sophisticated.
In response to the surge in mobile traffic, responsive web design emerged. The term was coined in 2010 as web designers hurried to adapt their sites to small and large screens.
2014 – HTML5
In 2014, W3C finally adopted a final recommendation for HTML5 markup language.
By this point, responsive web design was more or less commonplace. Around this time, we also started to see websites experiment with more ambitious designs, such as vertical scrolling, larger images, and parallax scrolling.
2017 – The Death of Flash
While Flash was so important to the internet in its early stages, we’d come full circle by 2017. HTML5 and WebGL had gradually replaced the technology by 2017, so Adobe announced Flash would be discontinued.
By now, the World Wide Web looks similar to today’s. There were over a billion websites, and modern web design was very sophisticated.
Sources: CERN, SMA Marketing, LinkedIn, h2o digital, Quibble
Final thoughts
That concludes our roundup of website statistics — we hope you found this interesting.
If you want to learn more about websites, we recommend checking out these web design statistics.
You can also learn more about the website builders designers use here. And if you want to know the best color for a website, check out these website color stats.
Enjoy!
Related Posts


Comments (0)