

40+ Online Shopping Statistics & Ecommerce Trends (2026)
Global retail ecommerce reached $6.4 trillion in 2025 and is forecast at $6.9 trillion in 2026, more than 3 billion people shop online, and cart abandonment still plagues retailers at 70.22%. Here are 40+ online shopping statistics covering market size, consumer behavior, mobile commerce, social commerce, payment trends, and returns for 2026.
Key Online Shopping Statistics (2026)
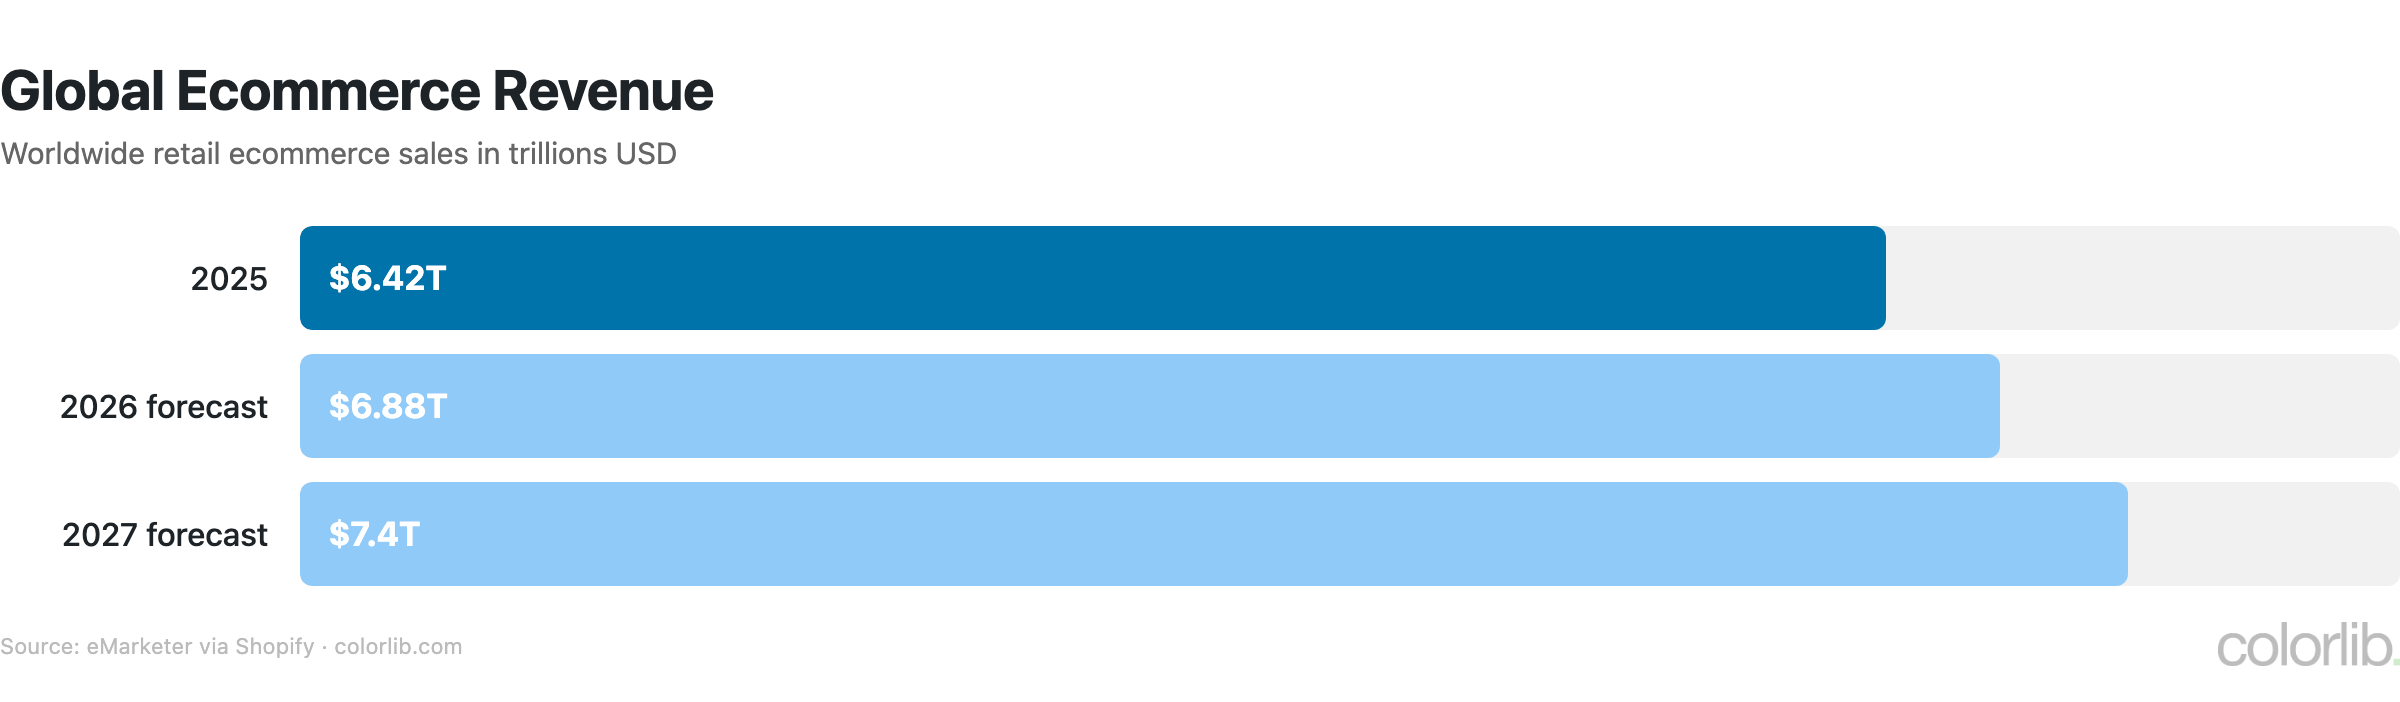
- Global retail ecommerce: $6.42 trillion in 2025, forecast at $6.88 trillion in 2026 and $7.4 trillion in 2027 (eMarketer via Shopify)
- Online shoppers worldwide: 3 billion+ in 2025 (eMarketer via Shopify)
- US ecommerce: $340 billion in Q2 2026 (seasonally adjusted), 17.1% of total retail sales (US Census Bureau via FRED)
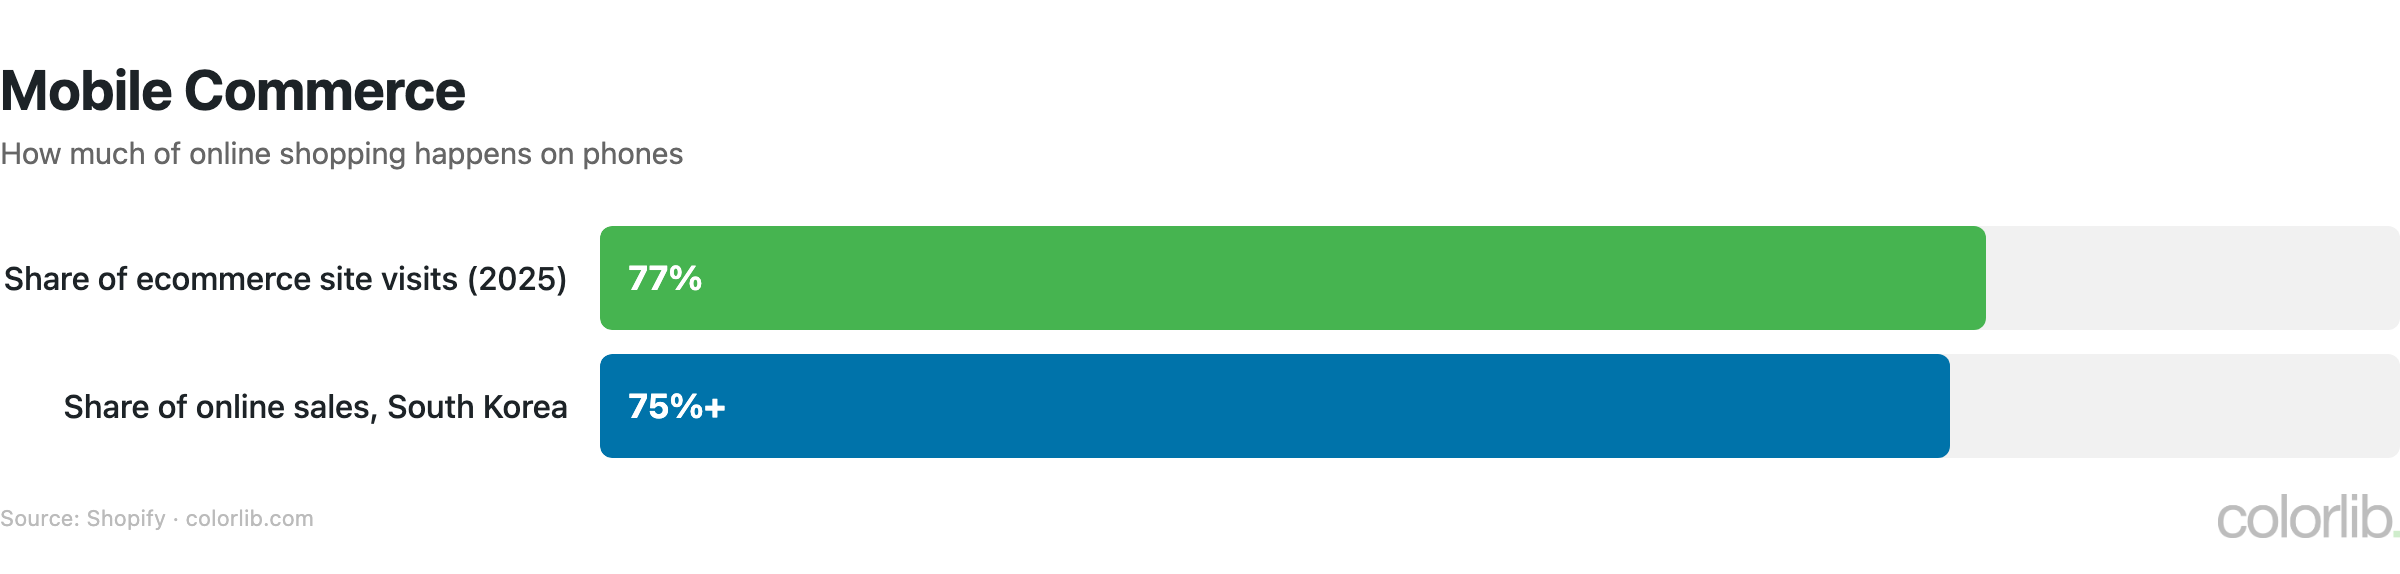
- Mobile phones drove 77% of ecommerce website visits in 2025 (Shopify)
- Cart abandonment rate: 70.22%, the average of 50 studies (Baymard Institute)
- Extra costs (shipping, tax, fees) are the top reason for checkout abandonment, cited by 40% of shoppers (Baymard Institute)
- US retail returns: $849.9 billion projected for 2025, with 19.3% of online sales returned (NRF)
Ecommerce Market Size & Growth
| Metric | Value | Source |
|---|---|---|
| Global retail ecommerce sales (2025) | $6.42 trillion | eMarketer via Shopify |
| Forecast global ecommerce (2026) | $6.88 trillion | eMarketer via Shopify |
| Forecast global ecommerce (2027) | $7.4 trillion | eMarketer via Shopify |
| US ecommerce sales (2025) | $1.23 trillion | US Census Bureau via FRED |
| US ecommerce sales (Q2 2026, seasonally adjusted) | $340 billion (+12% YoY) | US Census Bureau via FRED |
| Ecommerce share of total retail (worldwide, 2025) | 20.5% | eMarketer via Shopify |
| Ecommerce share of total retail (US, Q2 2026) | 17.1% | US Census Bureau via FRED |
| Global ecommerce growth rate | 6.8% (2025), 7.2% forecast (2026) | eMarketer via Shopify |
| Digital buyers worldwide (2025) | 3 billion+ | eMarketer via Shopify |
- US ecommerce grew from $1.17 trillion in 2024 to $1.23 trillion in 2025, and its share of total retail rose from 16.3% to 17.1% in the year to Q2 2026
- China, the US, and Western Europe together account for 80.5% of global ecommerce sales (eMarketer, 2025)
- The fastest-growing ecommerce markets in 2025 were the Philippines (+23%), Thailand (+20%), and Malaysia (+15.5%)
- Ecommerce is forecast to reach 21.1% of worldwide retail sales in 2026 and 22.5% by 2028
Consumer Behavior Statistics
| Behavior | Value | Source |
|---|---|---|
| Abandon checkout over extra costs (shipping, tax, fees) | 40% | Baymard Institute |
| Abandon checkout because delivery is too slow | 20% | Baymard Institute |
| Abandon checkout over an unsatisfactory returns policy | 13% | Baymard Institute |
| Say free returns matter when shopping online | 82% | NRF |
| Online sales returned (2025) | 19.3% | NRF |
| Returns that are fraudulent | 9% | NRF |
| Average cart, Shopify BFCM 2025 | $114.70 | Shopify |
- US retailers face an estimated $849.9 billion in returns in 2025 (NRF)
- 45% of shoppers consider it acceptable to “bend the rules” when returning items (NRF)
- 81 million+ shoppers bought from Shopify-powered brands over Black Friday-Cyber Monday 2025, spending a record $14.6 billion
Mobile Commerce Statistics
| Metric | Value | Source |
|---|---|---|
| Mobile share of ecommerce website visits (2025) | 77% | Shopify |
| Mobile share of online sales in South Korea | 75%+ | Shopify |
| Shop Pay conversion vs. guest checkout | Up to 50% higher | Shopify |
| Shop Pay GMV growth (2025) | +62% | Shopify |
- Phones now drive more than three in four visits to online stores, so mobile checkout speed is where most conversion gains are won or lost
- Accelerated checkouts such as Shop Pay, Apple Pay, and Google Pay cut form-filling on small screens; Shopify says Shop Pay converts up to 50% better than guest checkout
- Baymard estimates better checkout design alone could lift conversion rates by 35.26%
Social Commerce Statistics
| Platform / Metric | Value | Source |
|---|---|---|
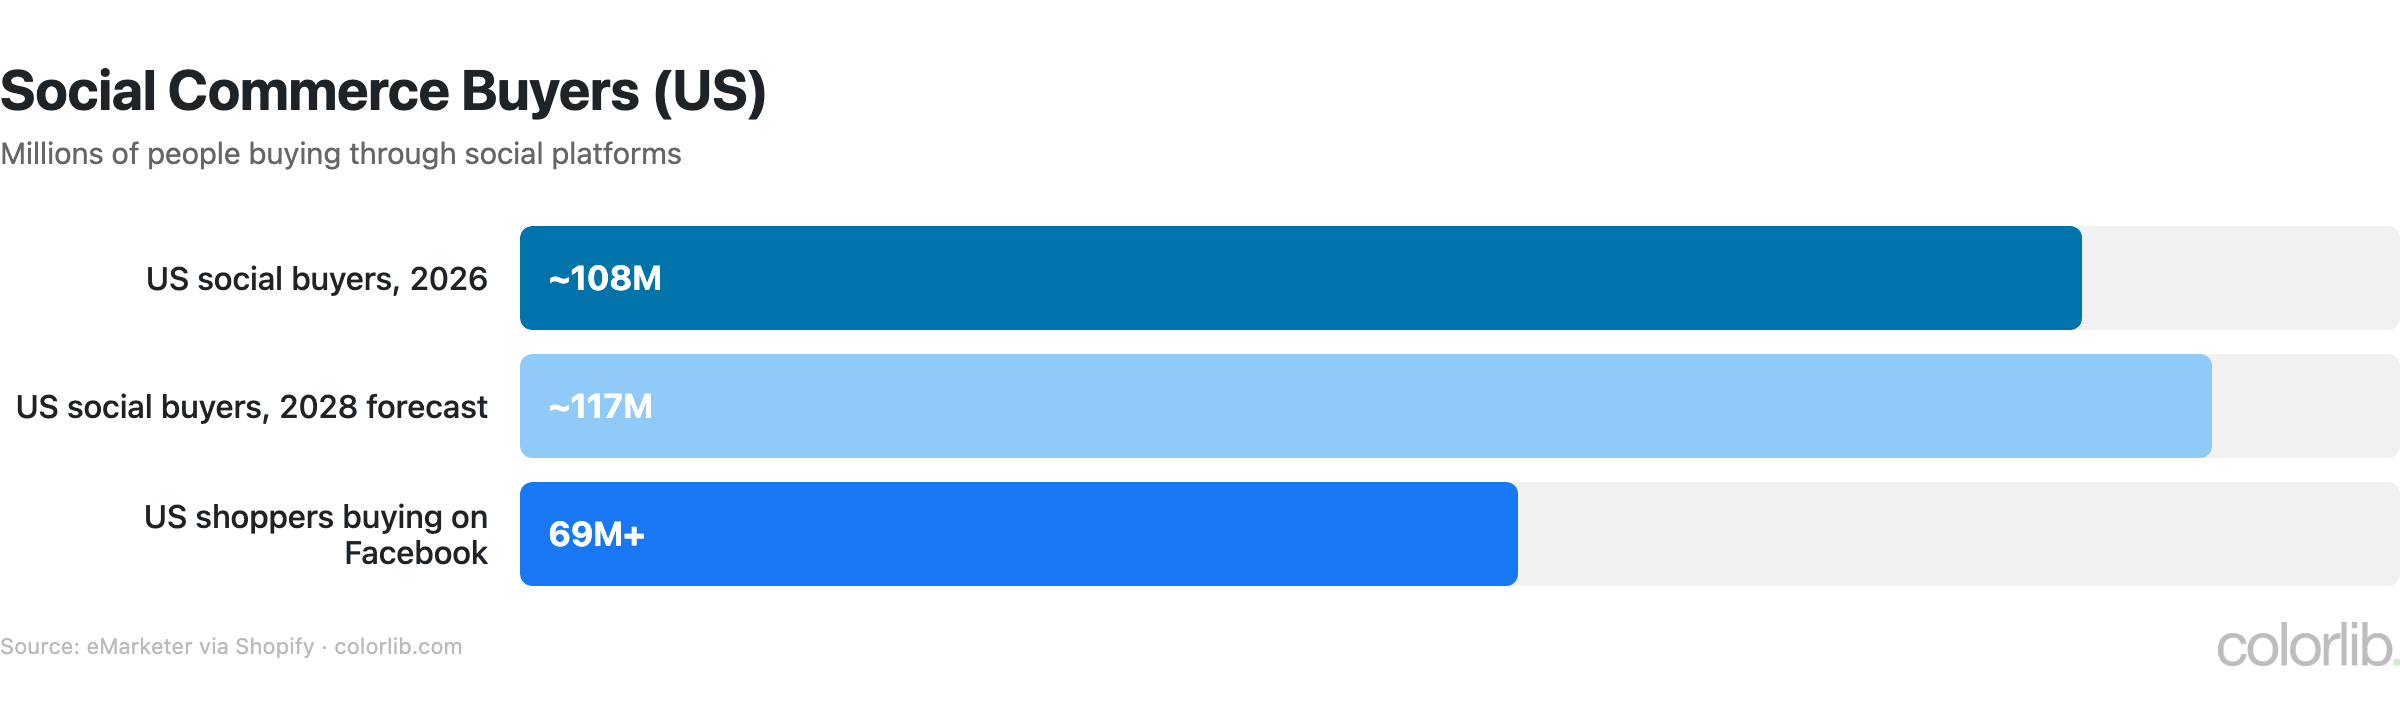
| US social buyers (2026) | ~108 million, rising to ~117 million by 2028 | eMarketer via Shopify |
| US social buyers who shop on TikTok (2026) | Over half | eMarketer via Shopify |
| US social buyers who shop on Instagram (2026) | About half | eMarketer via Shopify |
| US shoppers buying on Facebook | 69 million+ | eMarketer via Shopify |
| Gen Z who start product searches on TikTok | 23% | eMarketer via Shopify |
- TikTok Shop has become a major social commerce channel: over half of US social buyers are expected to shop on TikTok in 2026
- One in three shoppers have bought something based on a creator’s recommendation
- 46% of shoppers say short-form videos such as Reels, TikTok videos, and YouTube Shorts influence their purchases
Cart Abandonment Statistics
| Reason for Abandonment | Share of Shoppers | Source |
|---|---|---|
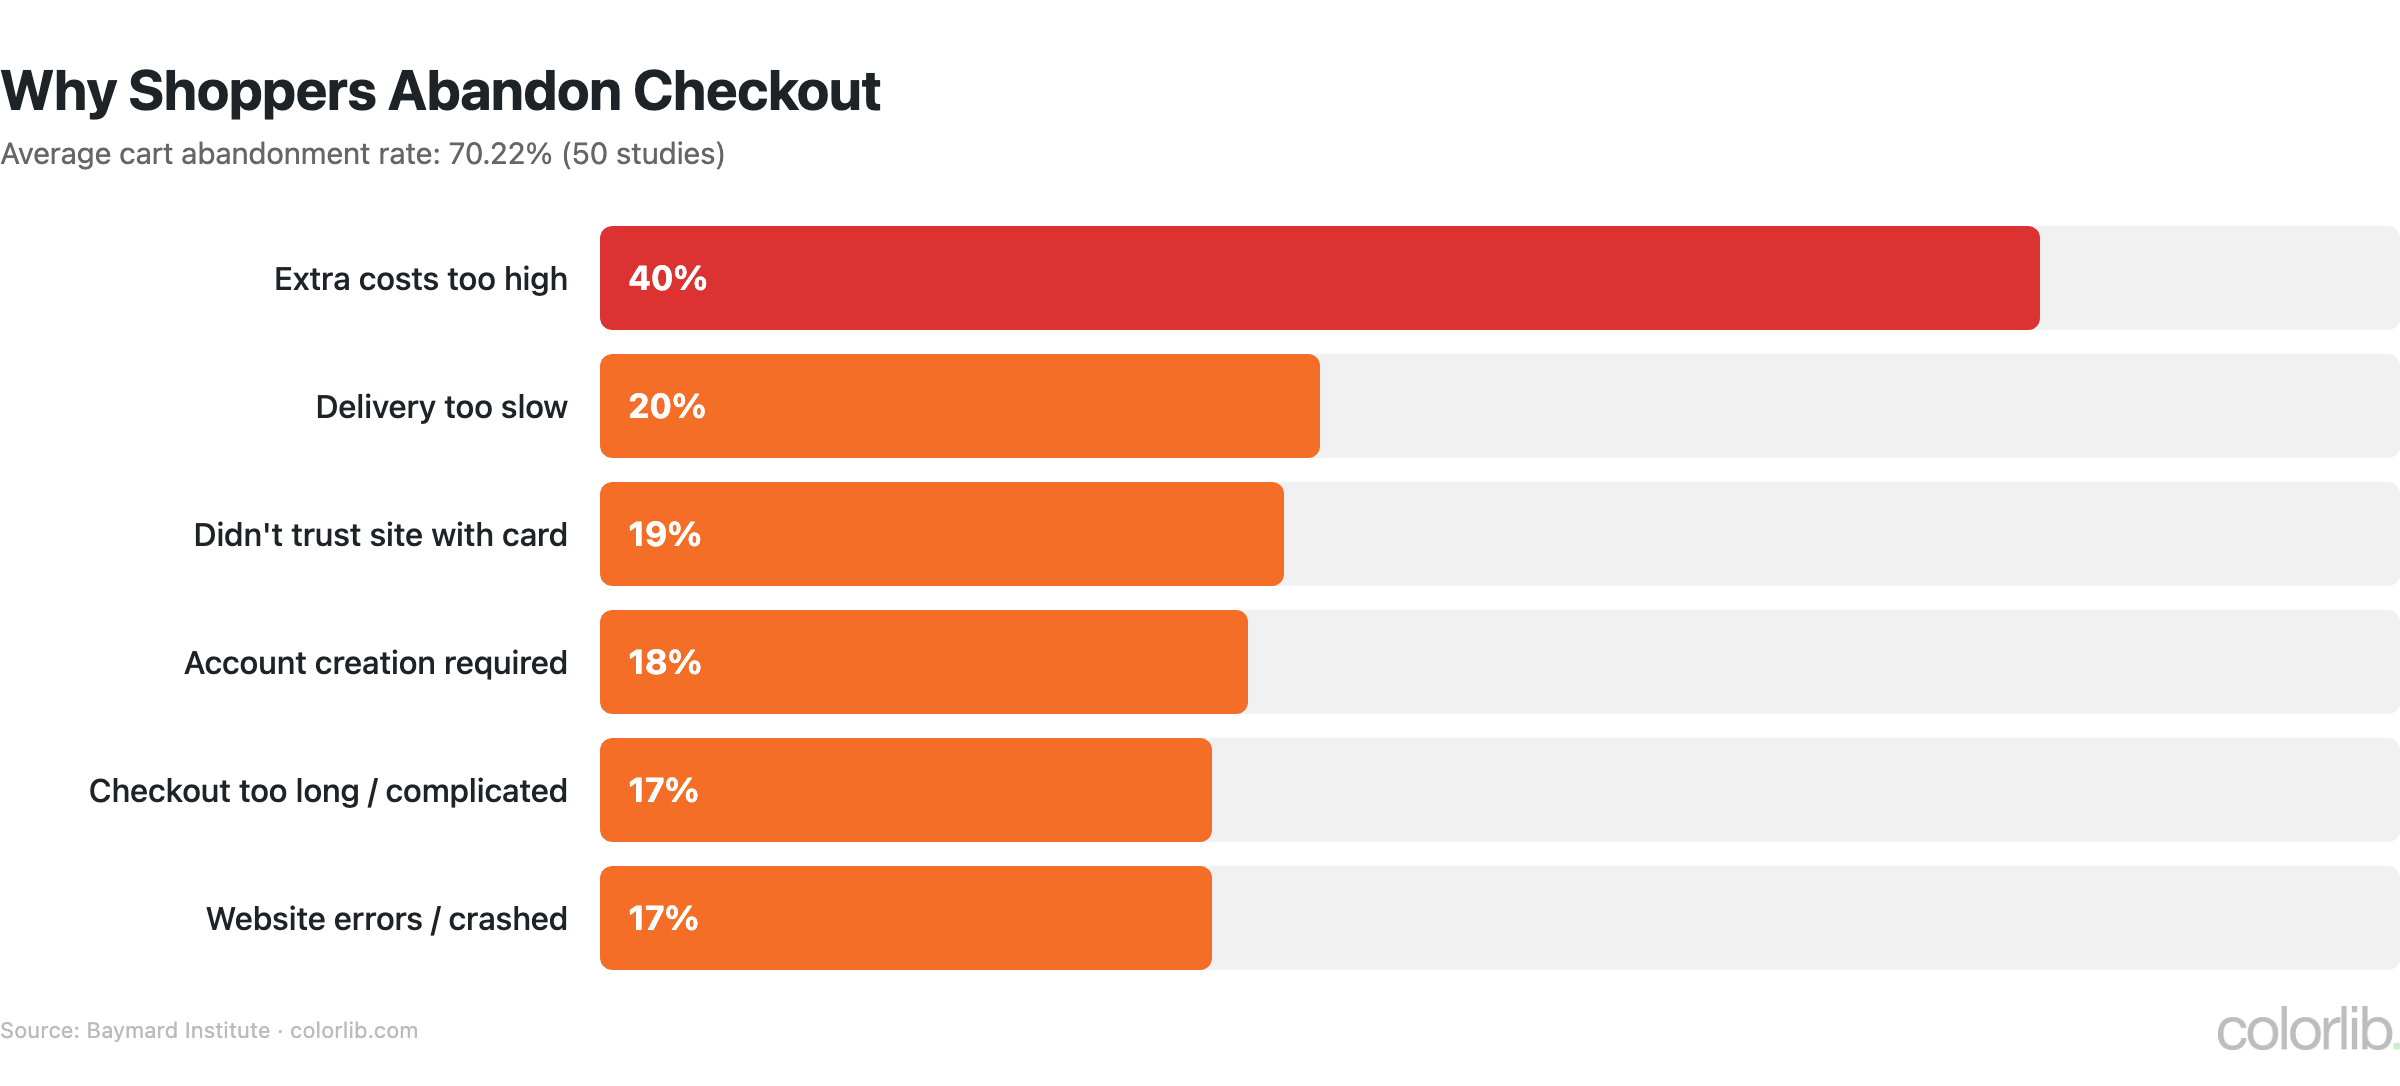
| Extra costs too high (shipping, tax, fees) | 40% | Baymard Institute |
| Delivery too slow | 20% | Baymard Institute |
| Didn’t trust site with credit card | 19% | Baymard Institute |
| Site required account creation | 18% | Baymard Institute |
| Checkout process too long / complicated | 17% | Baymard Institute |
| Website had errors / crashed | 17% | Baymard Institute |
- Average cart abandonment rate: 70.22%, based on 50 studies (Baymard Institute)
- Baymard estimates $260 billion in lost orders across the US and EU is recoverable through better checkout flow and design alone
- Better checkout design could raise conversion rates by 35.26% for the average large ecommerce site
- 13% of shoppers abandon over an unsatisfactory returns policy and 12% because they could not see the total cost up front
Payment Trends
| Payment Metric | Value | Source |
|---|---|---|
| Abandon checkout because they don’t trust the site with card details | 19% | Baymard Institute |
| Abandon checkout because their card was declined | 10% | Baymard Institute |
| Abandon checkout over too few payment methods | 9% | Baymard Institute |
| Shopify GMV processed through Shopify Payments (2025) | 65.6% | Shopify 10-K |
| Shop Pay GMV growth (2025) | +62% | Shopify |
- Payment trust is a conversion problem: 19% of shoppers abandon a checkout because they don’t trust the site with their card details
- Offering more payment options matters: 9% abandon because their preferred method is missing
- Accelerated wallets keep growing: Shop Pay GMV grew 62% in 2025, and Shopify Payments handled 65.6% of Shopify GMV
Key Takeaways
- Ecommerce is a $6.4T juggernaut. Global sales reached $6.42T in 2025 and are forecast at $6.88T in 2026 and $7.4T in 2027. Southeast Asia is the fastest-growing region.
- Mobile drives the traffic. Phones account for 77% of ecommerce site visits, so mobile checkout is the biggest revenue lever.
- Cart abandonment remains stubborn. 70.22% of carts are abandoned, and Baymard puts the recoverable value at $260B in the US and EU. Clear total costs, guest checkout, and fast wallets are the top fixes.
- US ecommerce keeps taking share. Online sales hit 17.1% of US retail in Q2 2026, up from 16.3% a year earlier.
- Social commerce is mainstream. About 108M Americans buy through social platforms, and over half of them shop on TikTok.
- Returns are a $850B cost. 19.3% of online sales are returned, and 82% of shoppers say free returns matter.
Sources
- Shopify — Global Ecommerce Sales (eMarketer forecast data)
- Baymard Institute — Cart Abandonment Statistics
- US Census Bureau Quarterly E-Commerce Report (via FRED)
- NRF — 2025 Retail Returns Landscape
- Shopify — Social Commerce Trends (eMarketer data)
- Shopify — BFCM 2025 Data
- Shopify — Q4 and Full Year 2025 Results
Frequently Asked Questions
How big is the global ecommerce market?
Global retail ecommerce reached $6.42 trillion in 2025 and is forecast to hit $6.88 trillion in 2026 and $7.4 trillion in 2027 (eMarketer). It represented 20.5% of all retail sales worldwide in 2025. China, the US, and Western Europe account for 80.5% of the total; US ecommerce alone was $1.23 trillion in 2025 (US Census Bureau). Growth is driven by mobile adoption, expanding digital payments, and emerging markets in Southeast Asia and Latin America.
Why do people abandon their online shopping carts?
The 70.22% cart abandonment rate is driven primarily by unexpected costs: 40% of shoppers abandon when shipping, tax, or fees push the total higher than expected. Other major reasons include slow delivery (20%), not trusting the site with card details (19%), forced account creation (18%), and a long or complicated checkout (17%). Free shipping, guest checkout, and one-click payment integrations are the most effective remedies.
What is social commerce and how big is it?
Social commerce is buying and selling products directly through social media platforms. About 108 million Americans are social buyers in 2026, a number eMarketer expects to reach about 117 million by 2028. Over half of US social buyers shop on TikTok, and about half on Instagram. For context on how advertising drives these sales, see our advertising statistics.
What percentage of online shopping happens on mobile?
Mobile phones drove 77% of ecommerce website visits in 2025, and in markets such as South Korea phones account for more than 75% of online sales. Mobile visitors still convert at lower rates than desktop shoppers, so faster mobile checkout and accelerated wallets such as Shop Pay (up to 50% better conversion than guest checkout) remain the biggest optimization opportunity.
For more on the business landscape, explore our digital marketing statistics, lead generation statistics, and sales statistics.

Related Posts





Comments (0)