50+ Internet Statistics: Users, Websites & Traffic (2026)
Last updated: March 2026
There are 5.52 billion internet users worldwide (68% of the global population), 1.9 billion websites exist but only 200 million are active, and 51.8% of all web traffic comes from bots. With the average person spending 6 hours 37 minutes online daily, global internet ad spending exceeding $740 billion, and 5G covering 45% of the world’s population, the internet continues to reshape every aspect of modern life. Here are 100+ internet statistics covering global users, website data, mobile trends, social media, infrastructure, and the digital economy for 2026.
Key Internet Statistics (2026)
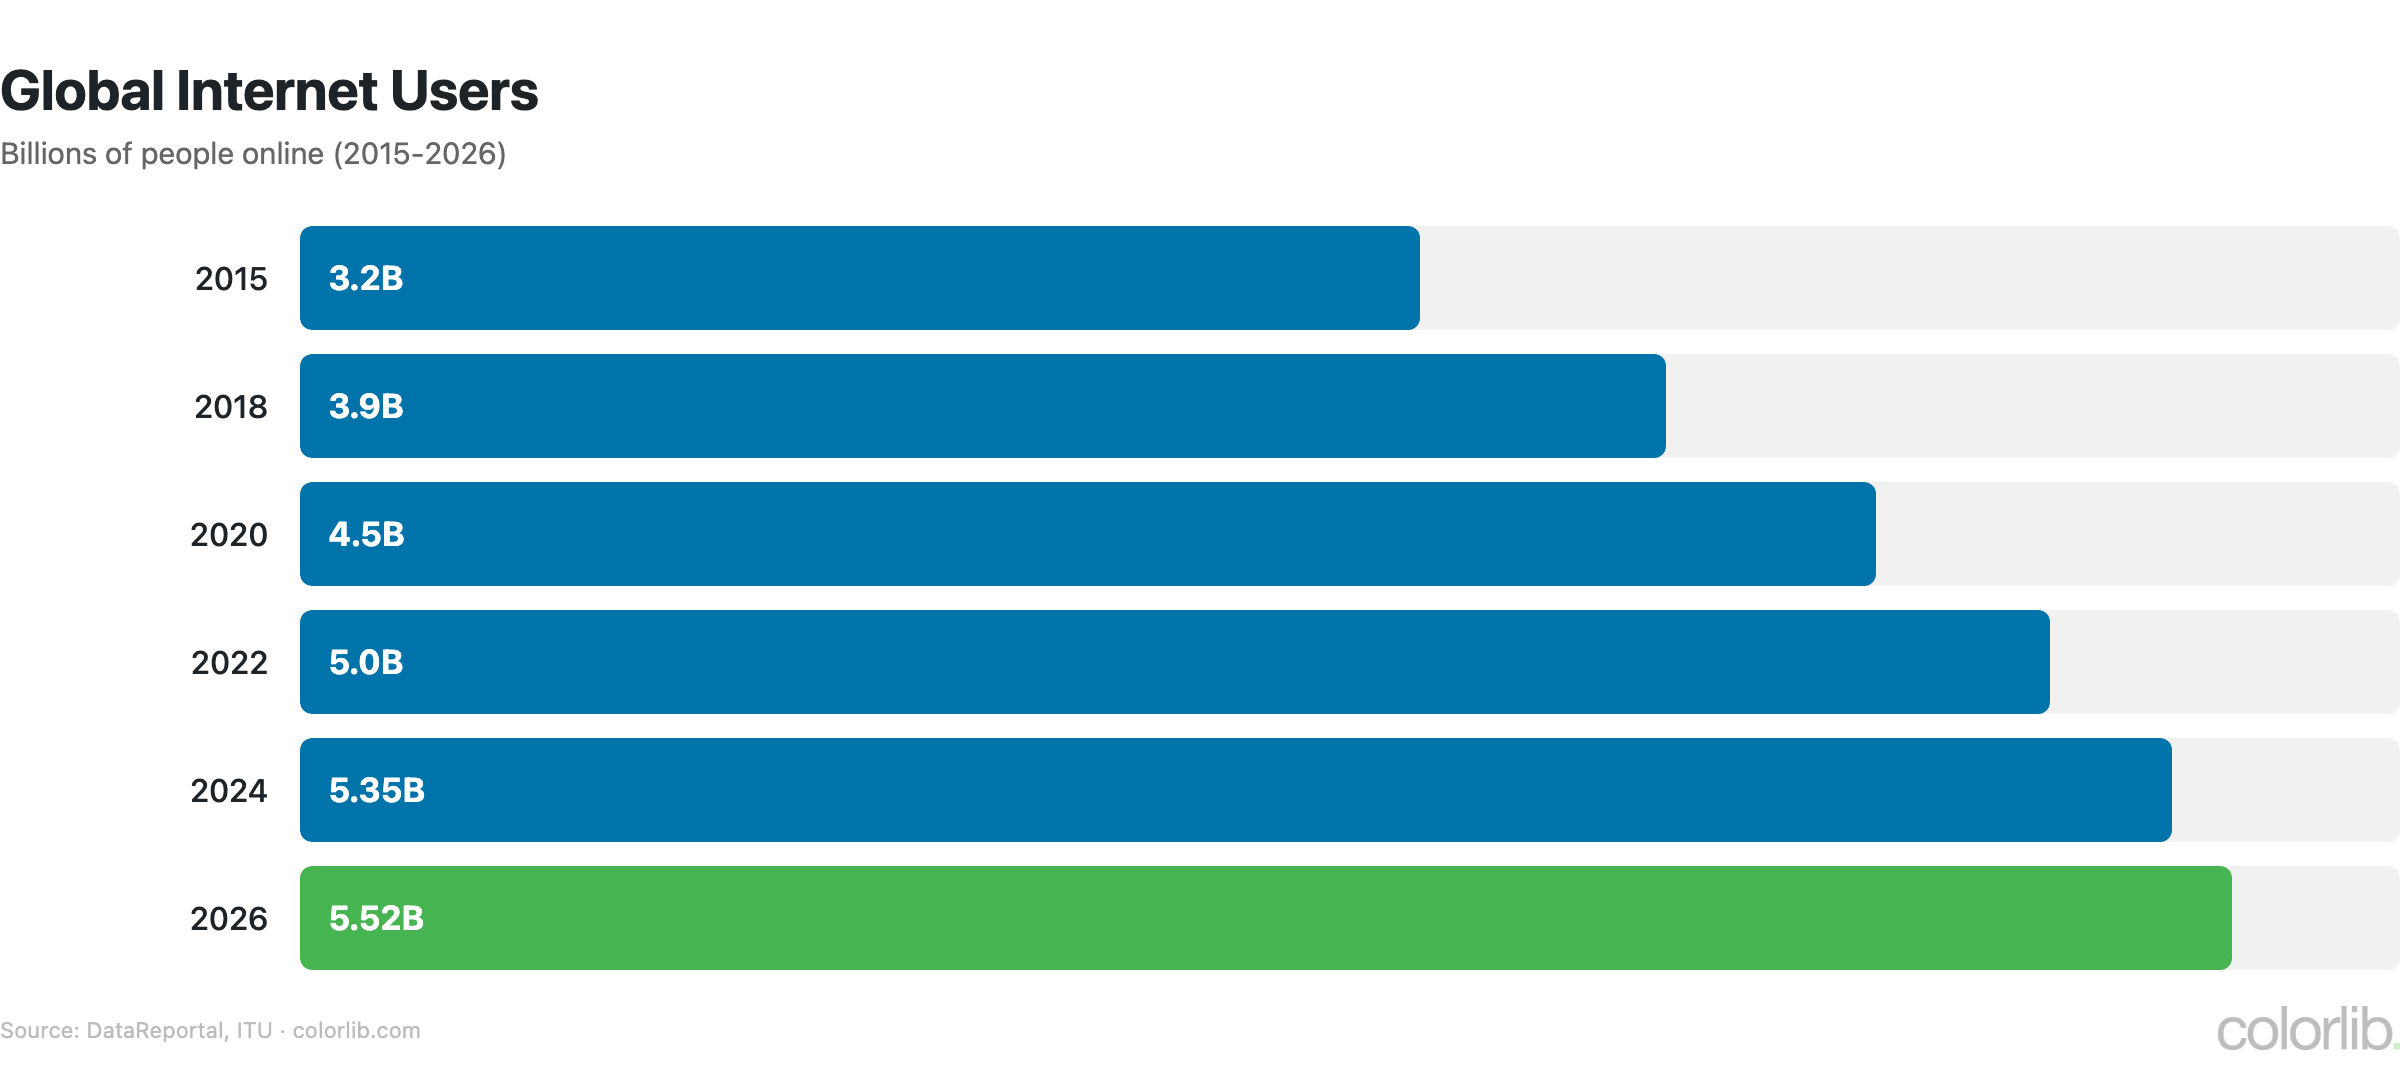
- 5.52 billion internet users (68% of world population) (DataReportal)
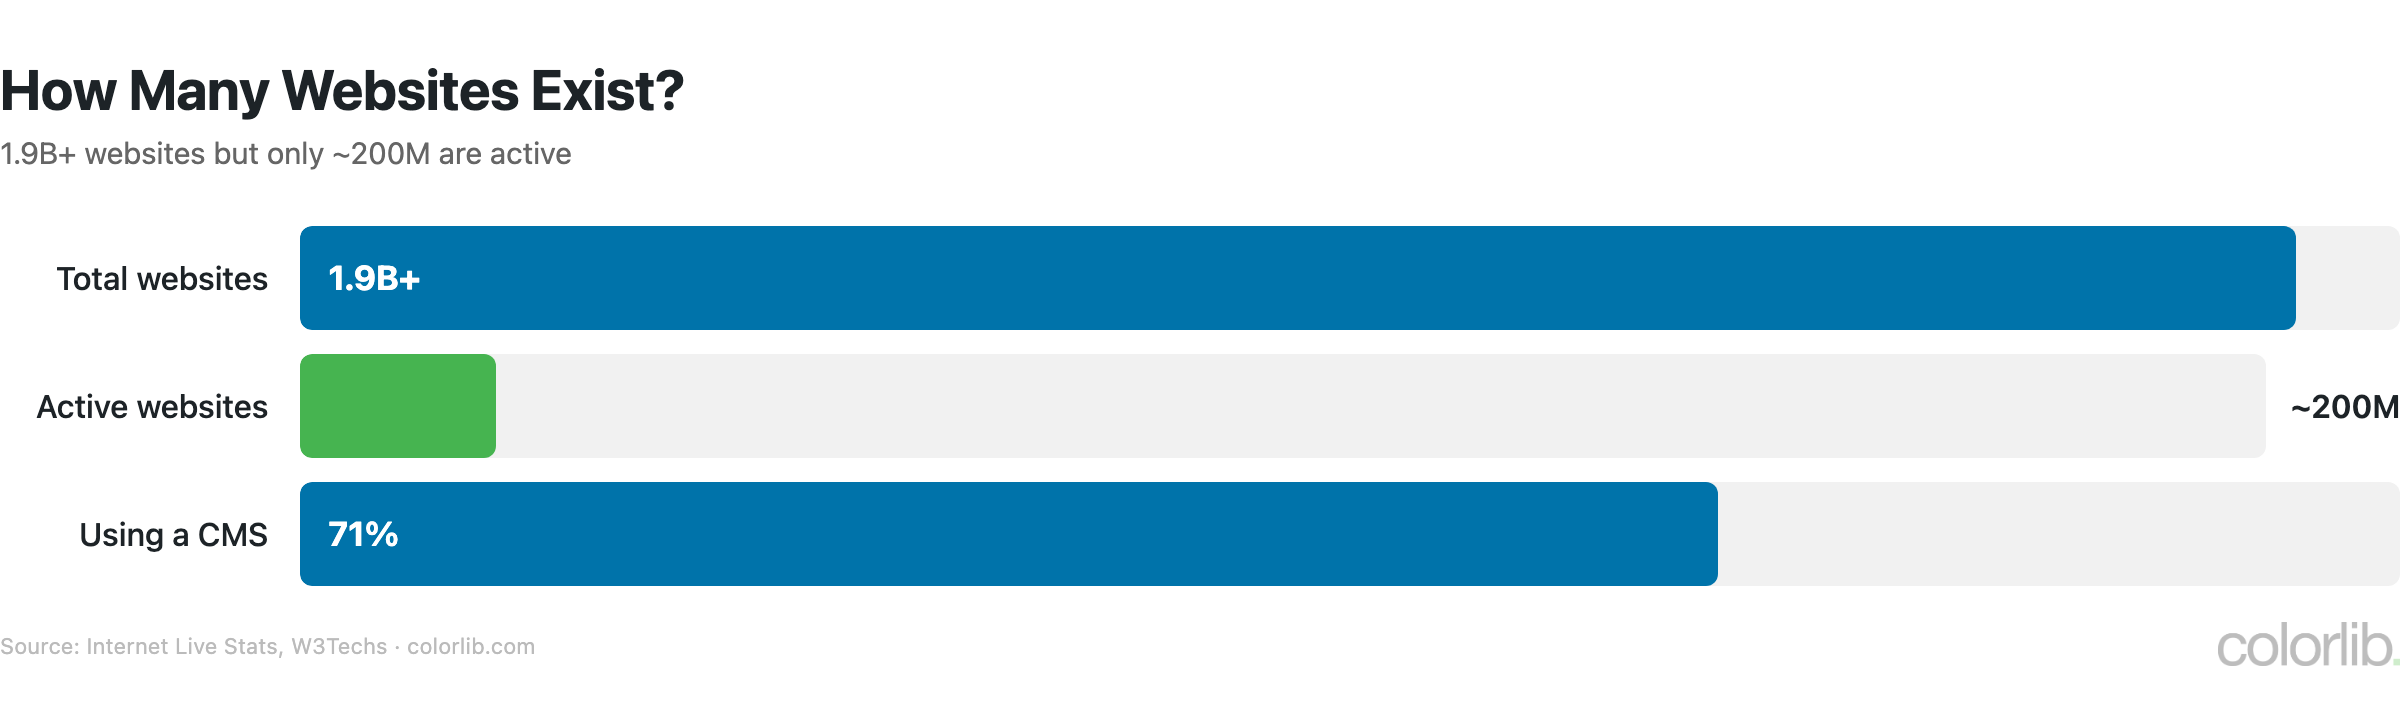
- 1.9 billion+ websites (only ~200 million active) (Internet Live Stats)
- 4.8 billion social media users (DataReportal)
- Average time online: 6h 37m per day (DataReportal)
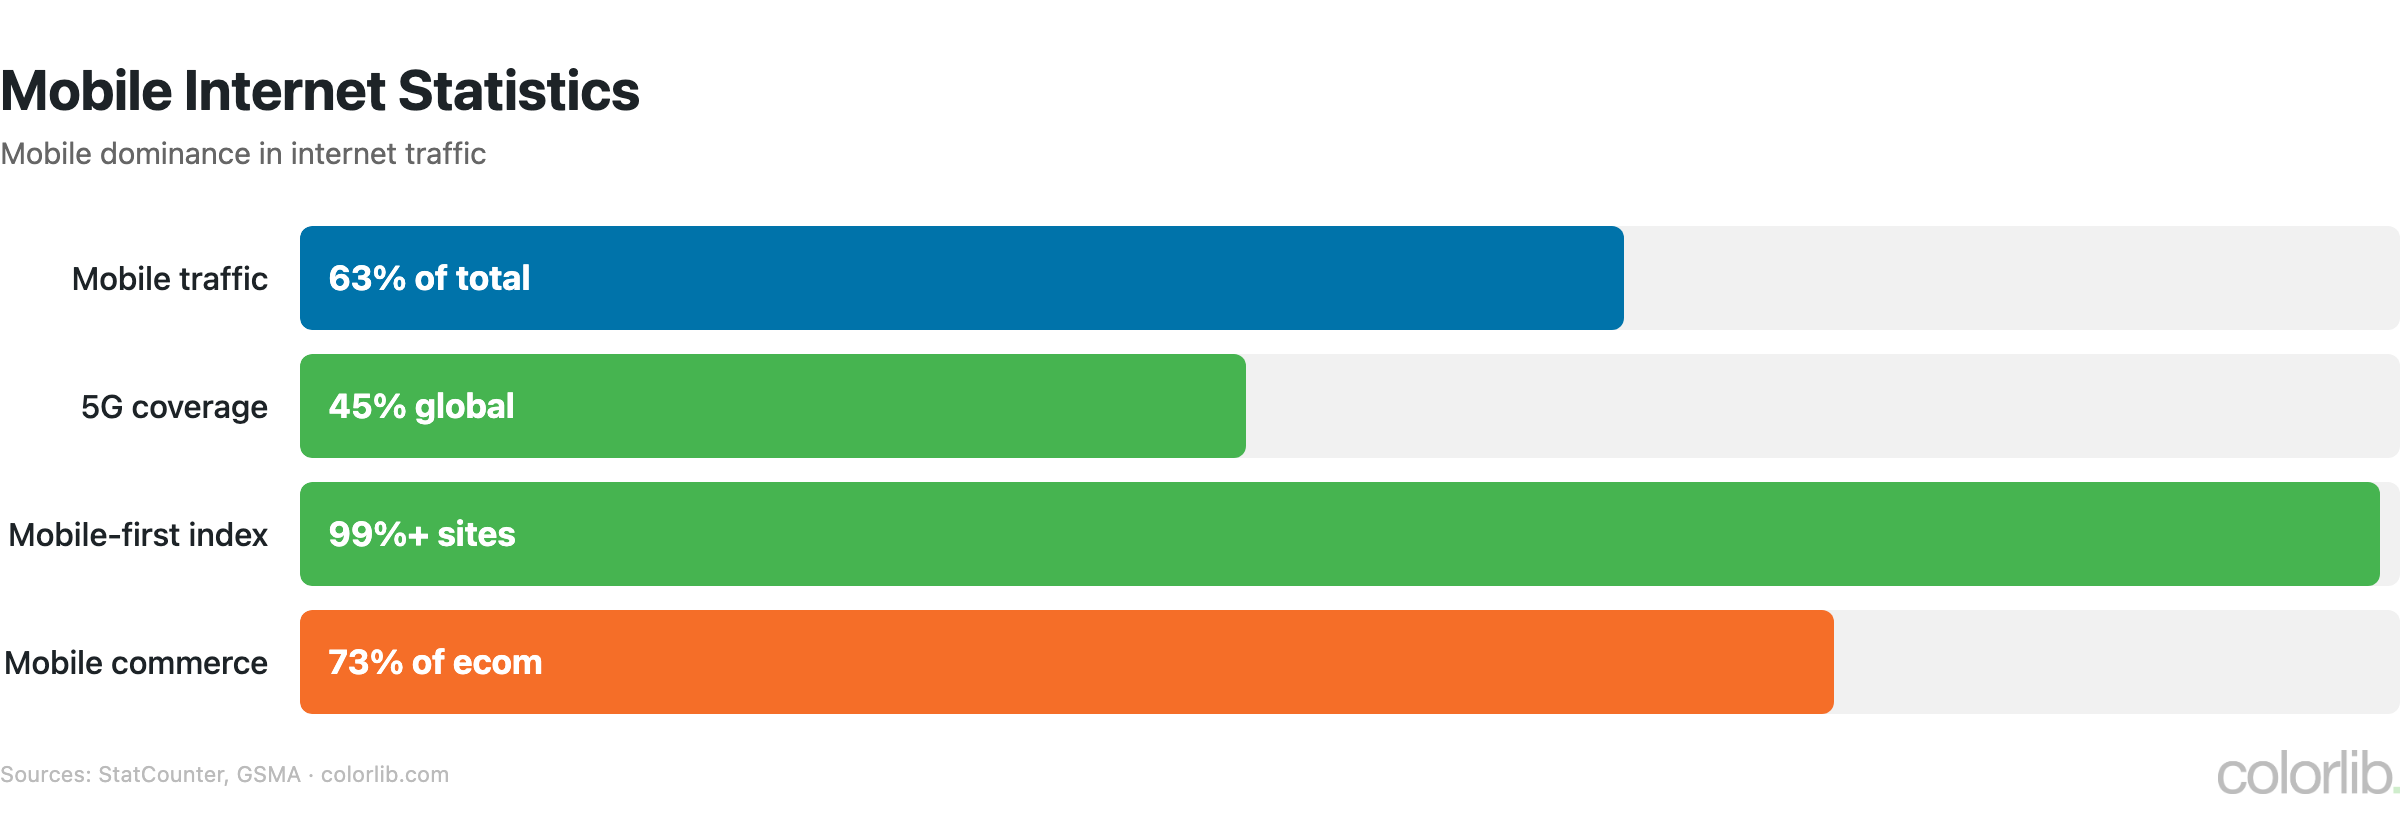
- Mobile: 60%+ of web traffic (StatCounter)
- Global internet ad spend: $740+ billion (Statista)
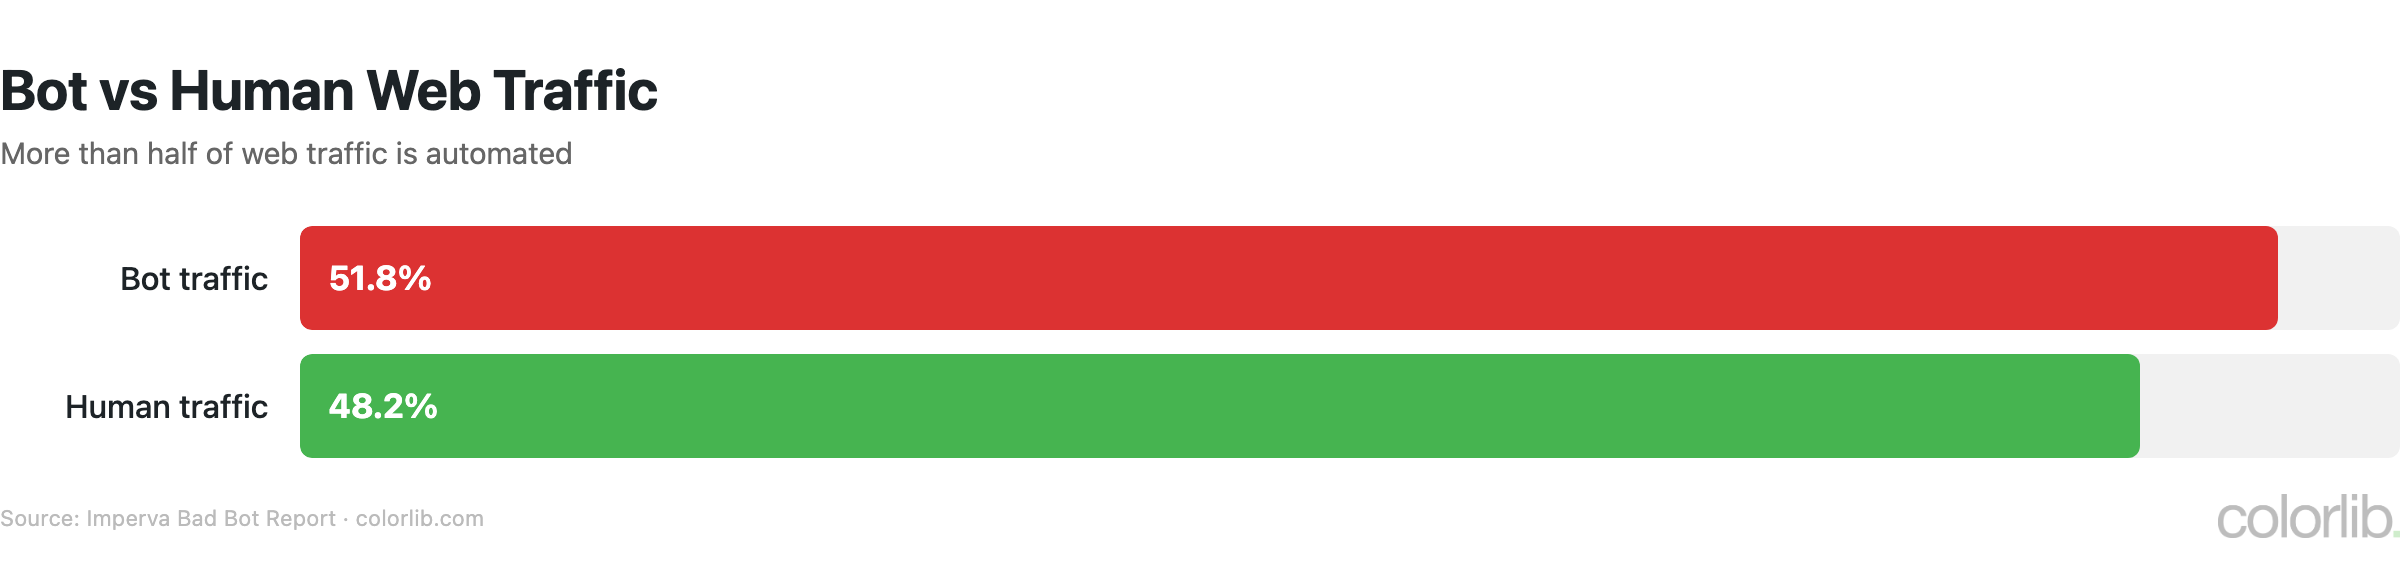
- Bot traffic: 51.8% of all web traffic (Imperva)
Global Internet Users
| Metric | Value | Source |
|---|---|---|
| Internet users worldwide | 5.52 billion | DataReportal |
| Internet penetration | 68% of world population | DataReportal |
| New users per day | ~640,000 | DataReportal |
| Non-connected population | 2.6 billion | ITU |
| Average daily time online | 6h 37m | DataReportal |
| Highest penetration: Northern Europe | 98% | ITU |
| Lowest penetration: Central Africa | 24% | ITU |
| China: internet users | 1.09 billion | CNNIC |
- 5.52 billion people are now online — 68% of the world’s 8.1 billion population, with approximately 640,000 new users connecting every day
- The digital divide persists: Northern Europe has 98% penetration while Central Africa sits at 24%, and 2.6 billion people remain offline
- The average internet user spends 6 hours 37 minutes online daily — equivalent to over 100 days per year spent on the internet
- China leads in absolute users with 1.09 billion, followed by India (900M+), the US (330M+), and Indonesia (210M+)
- Internet penetration growth is slowing from ~10% annually (2015-2020) to ~3-4% as easy-to-reach populations are already connected
Website Statistics
| Metric | Value | Source |
|---|---|---|
| Total websites | 1.9 billion+ | Internet Live Stats |
| Active websites | ~200 million | Netcraft |
| Domains registered | 360 million+ | Verisign |
| .com domains | 160 million+ | Verisign |
| WordPress market share | 42.6% | W3Techs |
| HTTPS adoption | 95%+ (top sites) | W3Techs |
| New websites per day | ~252,000 | Internet Live Stats |
| Average website lifespan | 2.7 years | Industry estimates |
- Of the 1.9 billion+ registered websites, only approximately 200 million (~10%) are active — the rest are parked domains, expired sites, or placeholder pages
- .com remains the dominant TLD with 160 million+ registrations, followed by country-code TLDs (.cn, .de, .uk, .org)
- WordPress powers 42.6% of all websites globally, making it the dominant web publishing platform by an enormous margin
- Approximately 252,000 new websites are created every day, but the average website lasts only 2.7 years before going offline
- For detailed platform data, see our how many websites are there and CMS market share analyses
Mobile Internet Statistics
| Metric | Value | Source |
|---|---|---|
| Mobile share of web traffic | 60%+ | StatCounter |
| Mobile internet users | 5.1 billion | DataReportal |
| Smartphone users worldwide | 4.8 billion | Statista |
| Average mobile screen time | 4h 37m/day | DataReportal |
| Mobile-only internet users | ~900 million | GSMA |
| 5G connections worldwide | 2.8 billion+ | GSMA |
| 5G population coverage | 45% | GSMA |
| Average mobile data usage | 19 GB/month | Ericsson |
- Mobile accounts for 60%+ of all web traffic globally, and 5.1 billion people access the internet via mobile devices
- Approximately 900 million people access the internet exclusively through mobile devices — desktop-only design excludes this entire audience
- Average mobile data consumption has reached 19 GB/month, up from 5 GB in 2020, driven by video streaming and social media
- 5G now covers 45% of the world’s population with 2.8 billion+ connections, enabling faster mobile web experiences
- Mobile screen time averages 4 hours 37 minutes daily, accounting for roughly 70% of total internet time
Social Media Usage Statistics
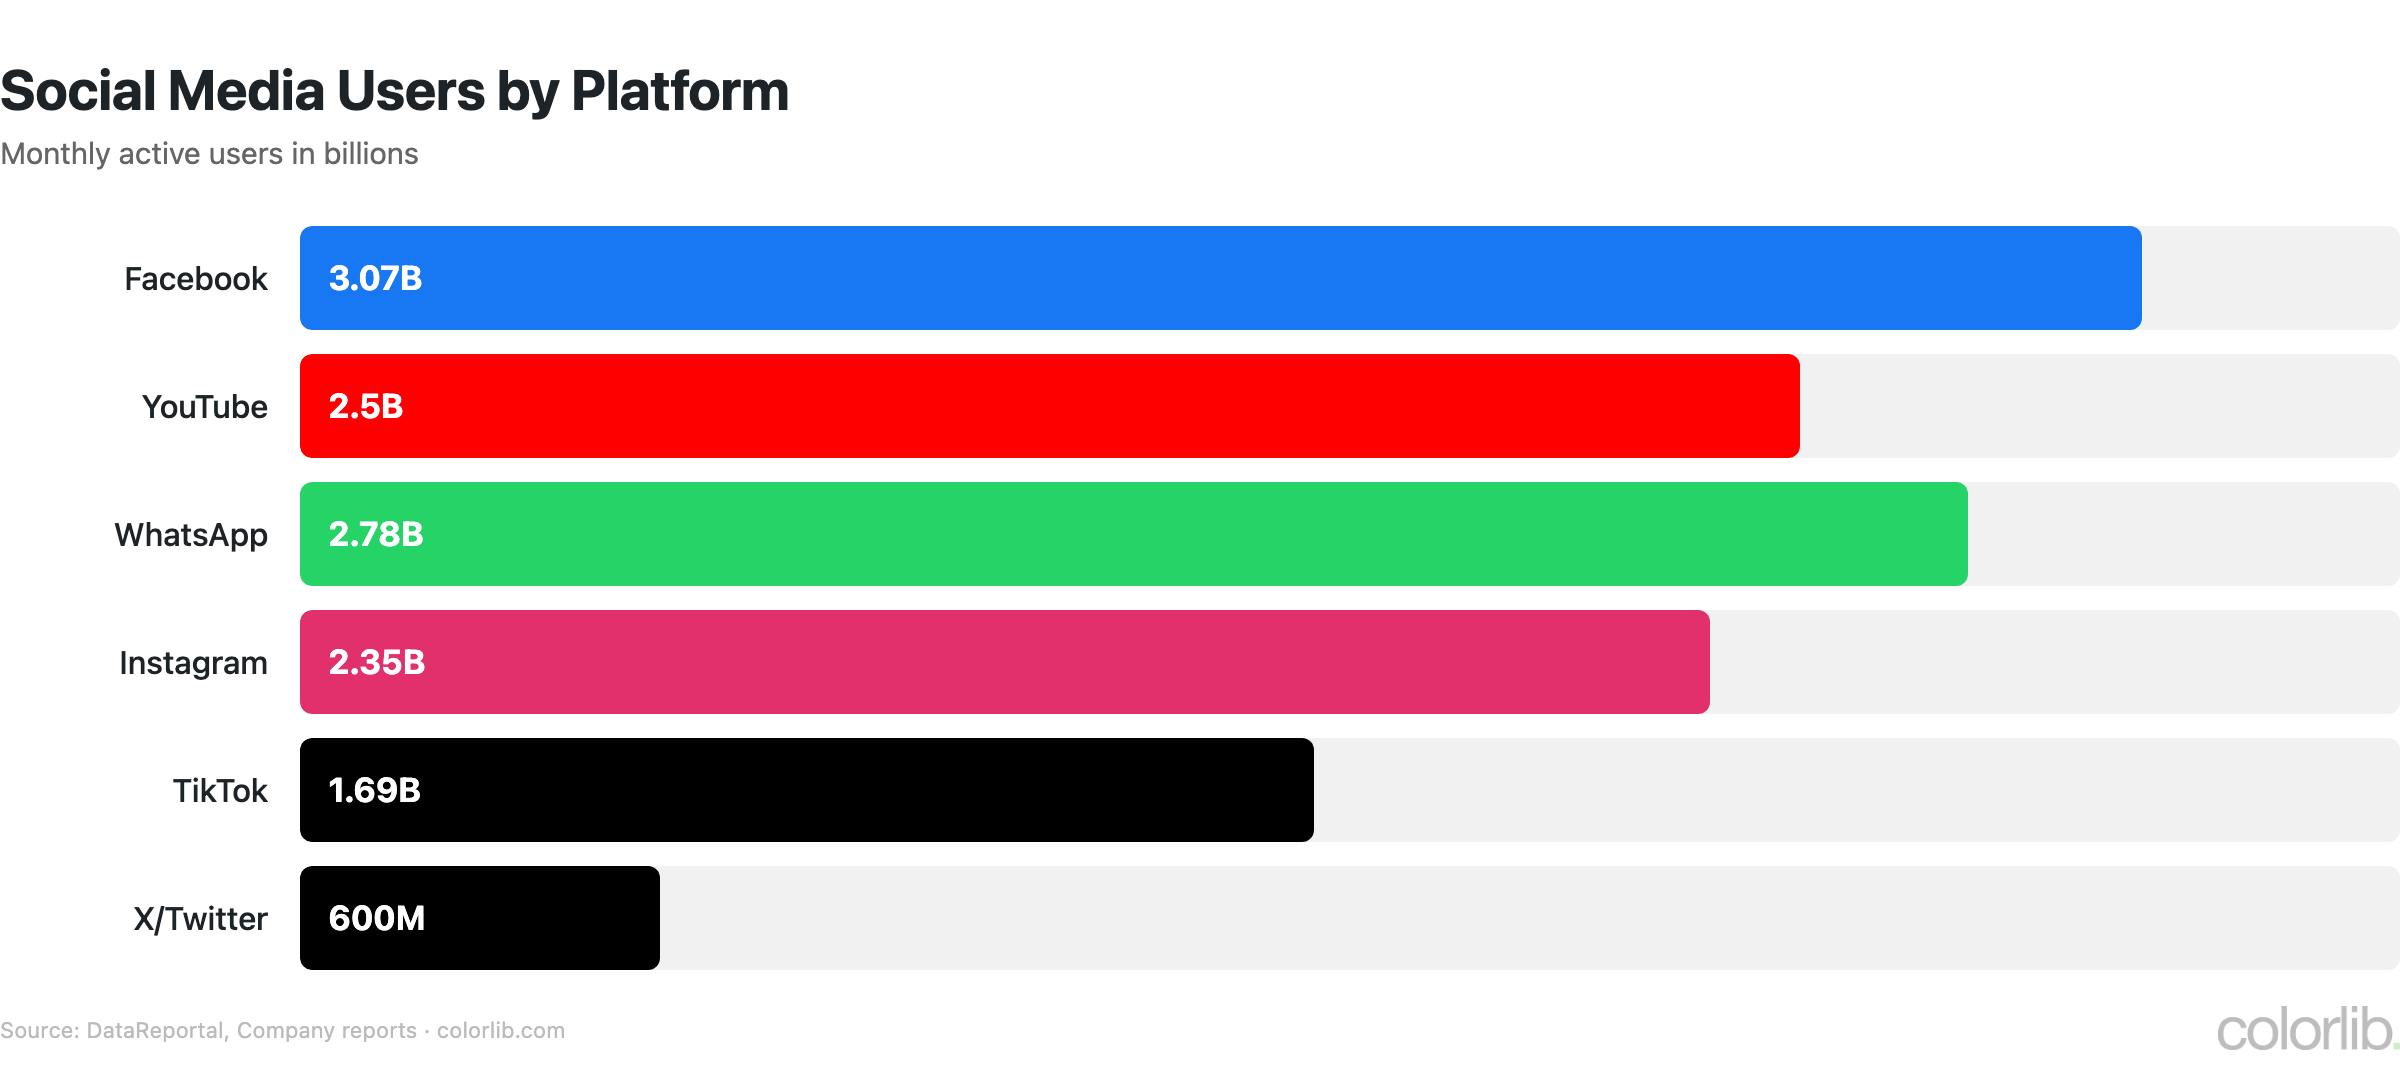
| Platform | Monthly Active Users | Trend |
|---|---|---|
| 3.07 billion | Growing (slowly) | |
| YouTube | 2.7 billion | Growing |
| 2.4 billion | Growing | |
| 2.04 billion | Growing | |
| TikTok | 1.6 billion | Growing (regulatory risk) |
| 1.35 billion | Stable (China) | |
| Telegram | 950 million | Growing rapidly |
| 900 million+ | Growing |
- 4.8 billion people use social media — nearly 60% of the world’s population and 87% of all internet users
- The average user has accounts on 6.7 different social media platforms and spends 2 hours 24 minutes on social media daily
- Facebook remains the largest platform at 3.07 billion MAU, but growth is concentrated in developing markets — engagement in North America is flat
- TikTok has reached 1.6 billion users despite ongoing regulatory threats in the US and other Western markets
- Social media drives only 5-8% of website traffic — organic search (53%) remains far more important for web publishers
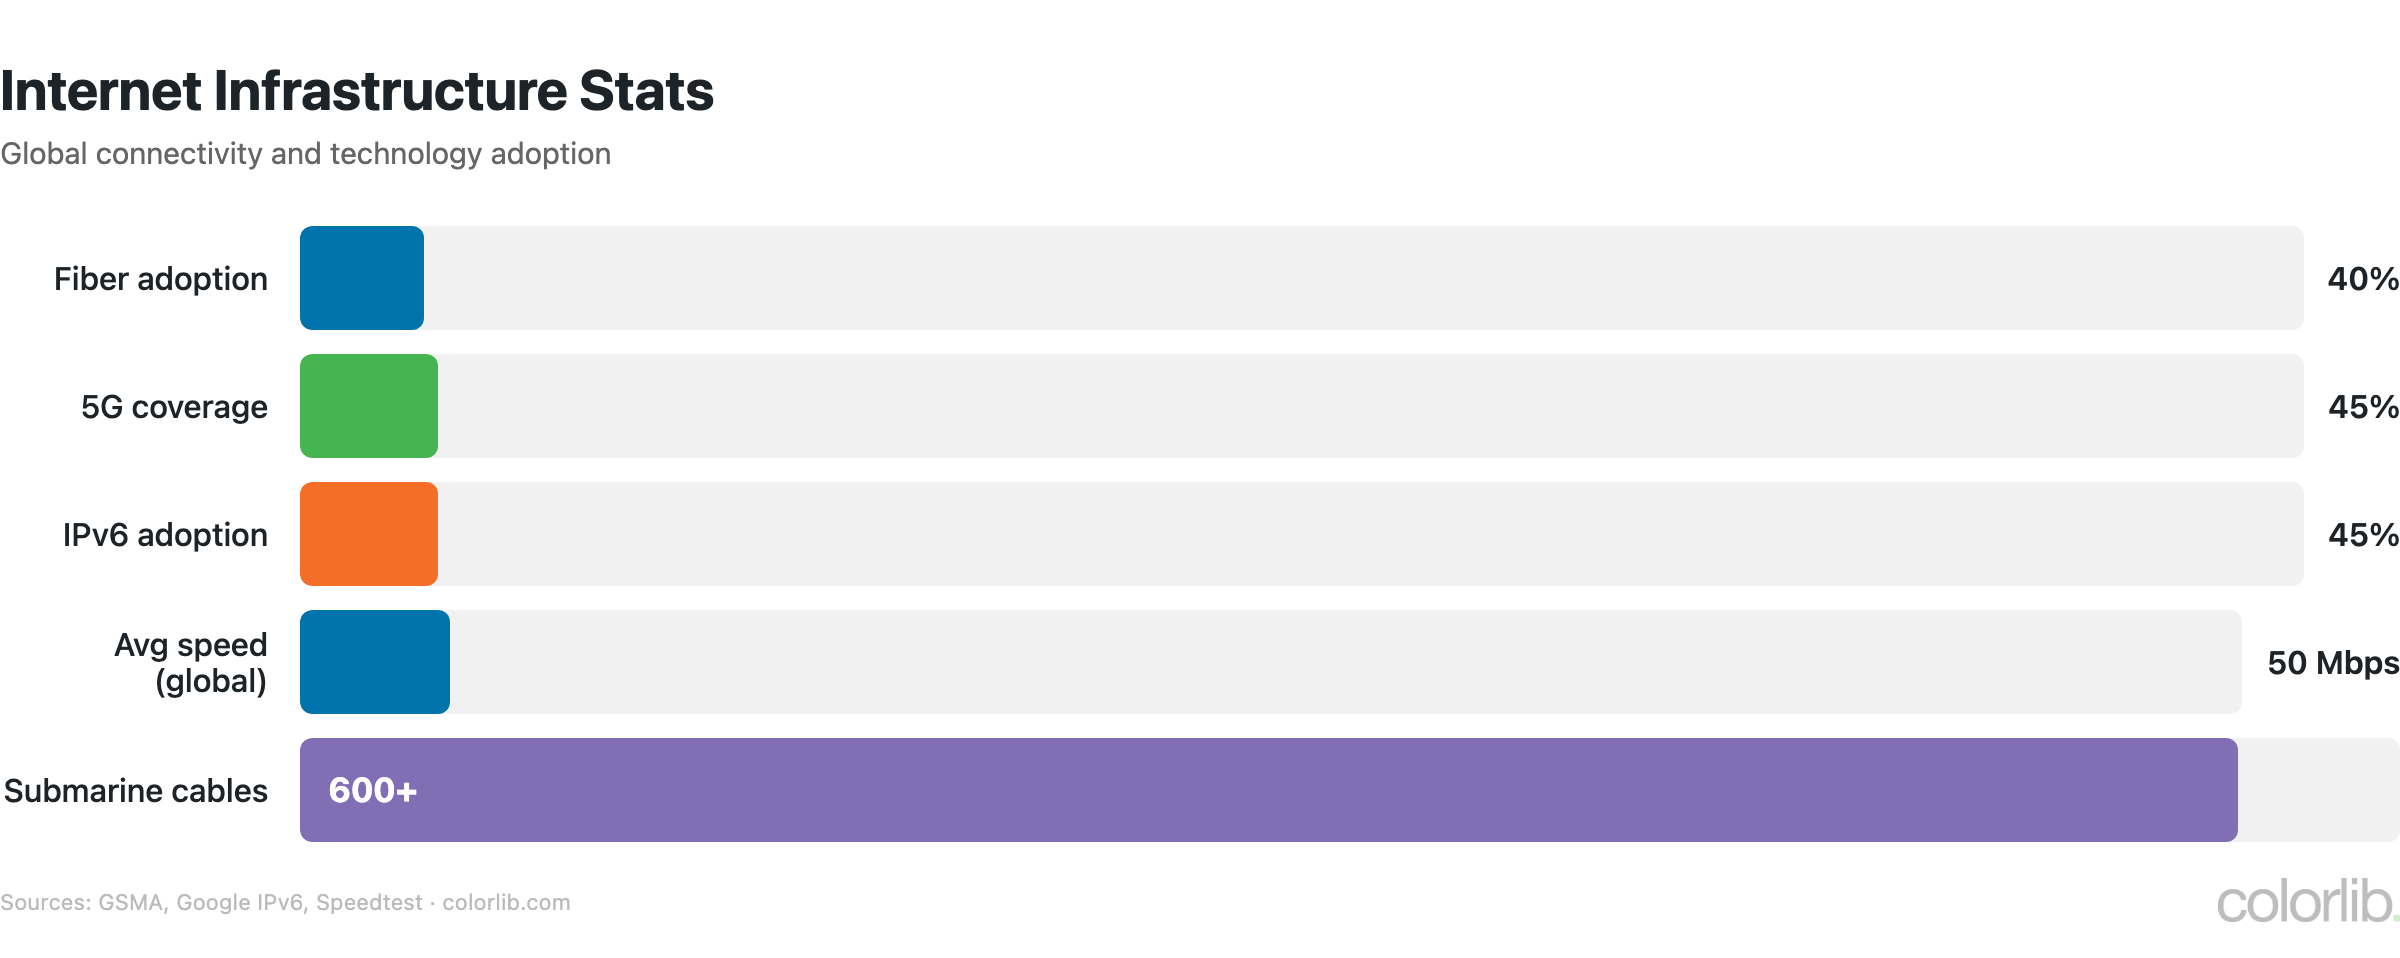
Internet Infrastructure Statistics
| Metric | Value | Source |
|---|---|---|
| Bot traffic share | 51.8% | Imperva |
| Bad bot traffic | 32% of all traffic | Imperva |
| Fiber optic coverage | 40%+ globally | ITU |
| 5G population coverage | 45% | GSMA |
| IPv6 adoption | 45% | Google IPv6 Stats |
| CDN adoption (top sites) | 70%+ | W3Techs |
| Average global download speed | 50-60 Mbps (fixed) | Ookla Speedtest |
| Submarine cables | 550+ active worldwide | TeleGeography |
- 51.8% of all web traffic comes from bots, with bad bots (scrapers, spam, attacks) accounting for 32% — more than half the internet isn’t human
- Fiber optic coverage has reached 40%+ globally, with South Korea (87%), Japan (80%), and China (75%) leading adoption
- IPv6 adoption has reached 45% of internet traffic, driven by mobile carriers and cloud providers — Google, Facebook, and Apple route 50%+ of traffic via IPv6
- The internet relies on 550+ submarine fiber optic cables spanning over 1.4 million kilometers — a single cable cut can disrupt entire regions
- 70%+ of top websites use CDNs (Cloudflare, Amazon CloudFront, Fastly), with Cloudflare alone serving 20%+ of all web traffic
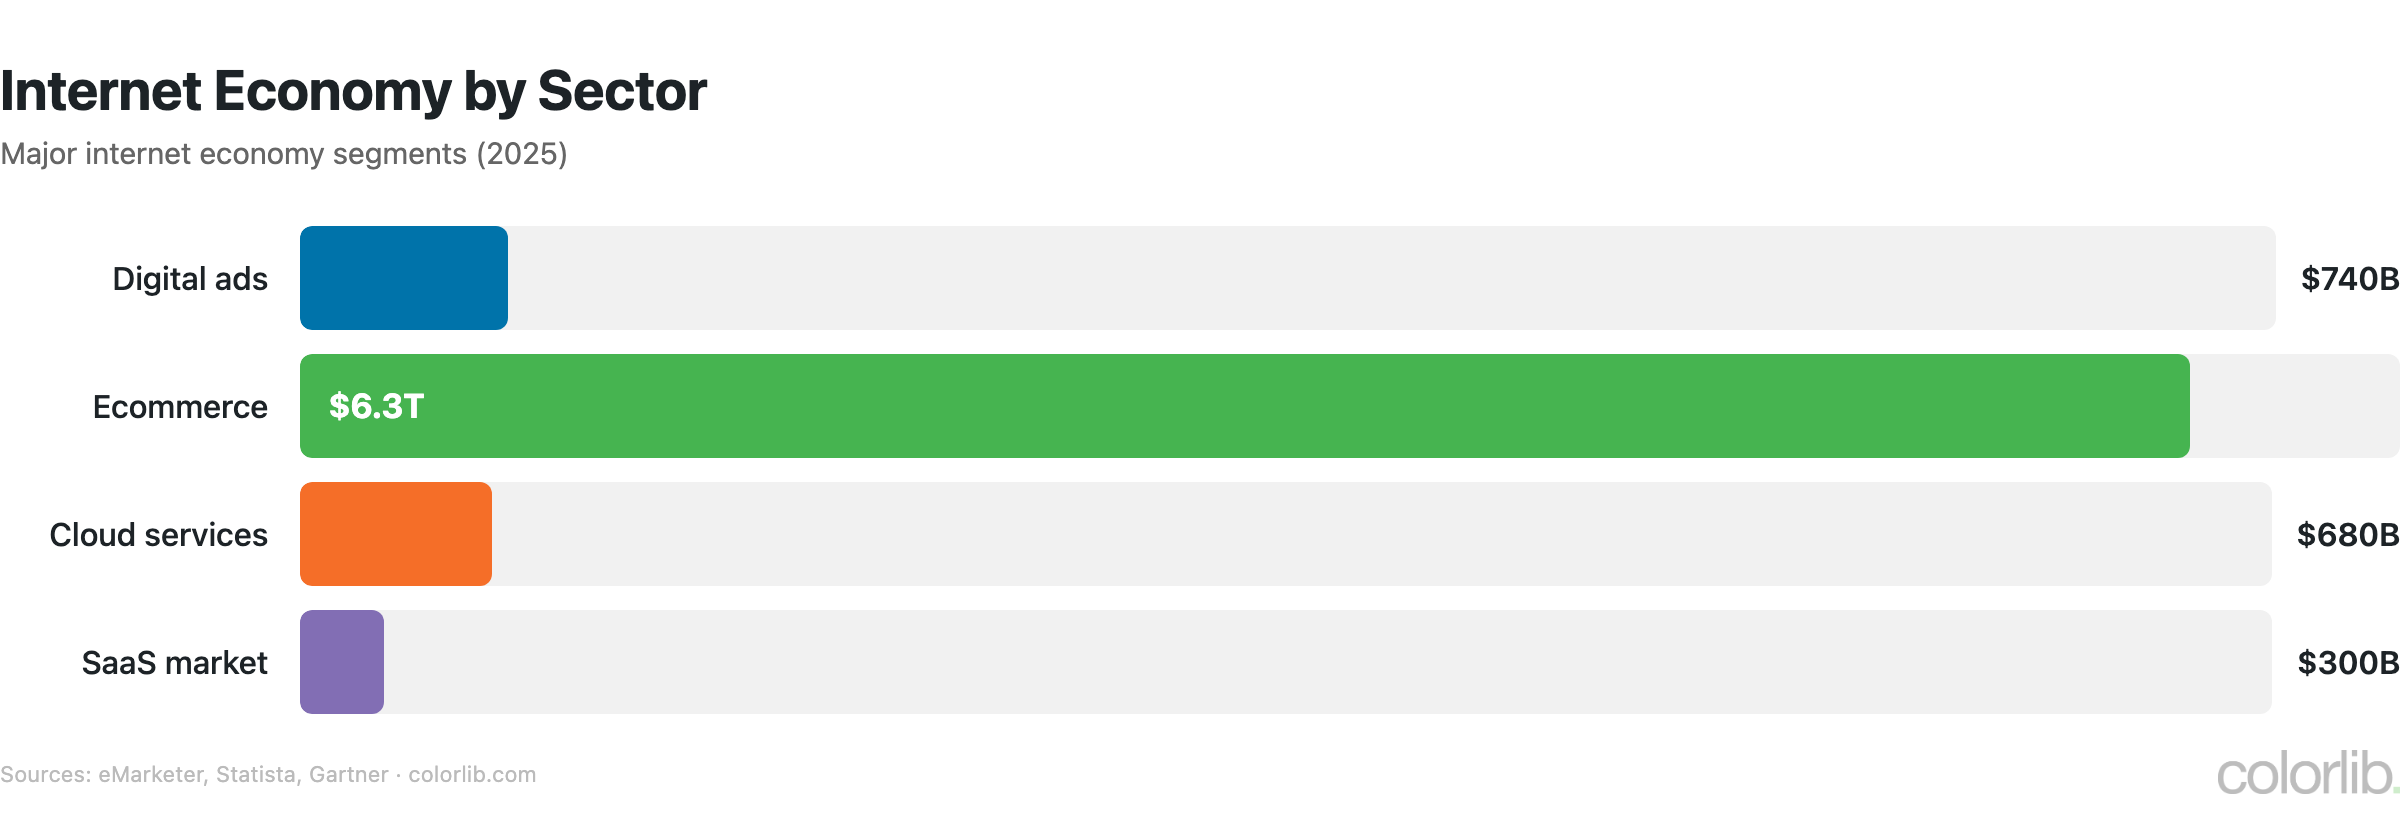
Internet Economy Statistics
| Metric | Value | Source |
|---|---|---|
| Global internet ad spending | $740+ billion | Statista |
| Global ecommerce sales | $6.3 trillion | Statista |
| Global digital economy | $16+ trillion (15% of GDP) | UNCTAD |
| Cloud computing market | $680+ billion | Gartner |
| Cybersecurity market | $200+ billion | Statista |
| SaaS market | $300+ billion | Gartner |
| Cybercrime cost (global) | $10.5 trillion/year | Cybersecurity Ventures |
- Global internet advertising now exceeds $740 billion annually, with Google ($307B) and Meta ($160B) capturing nearly two-thirds of the market
- Global ecommerce reached $6.3 trillion in 2024, representing approximately 20% of all retail sales worldwide
- The digital economy accounts for 15%+ of global GDP ($16+ trillion), growing 2.5x faster than the overall economy
- Cybercrime costs the global economy $10.5 trillion annually, exceeding the GDP of every country except the US and China
- For how these trends affect web publishing, see our digital marketing statistics and CMS market share reports
Key Takeaways
- The internet has reached 5.52 billion users. At 68% global penetration, the internet is approaching saturation in developed markets while growth continues in Africa, South Asia, and Southeast Asia.
- Most websites are inactive. Of 1.9 billion registered websites, only ~200 million (10%) are actively maintained. The average website lasts just 2.7 years before going offline.
- Mobile dominates the internet. At 60%+ of traffic, 5.1 billion mobile users, and 900 million mobile-only users, any digital strategy must be mobile-first.
- More than half of web traffic is bots. At 51.8%, bot traffic (including 32% bad bots) means website analytics, server resources, and security strategies must account for non-human traffic.
- The internet economy is massive. $740B+ in advertising, $6.3 trillion in ecommerce, and a $16T+ digital economy — the internet is not just a technology, it’s the backbone of the global economy.
- Infrastructure is rapidly upgrading. 5G covering 45% of the population, fiber at 40%+, IPv6 at 45%, and CDN adoption at 70%+ are enabling faster, more reliable internet experiences worldwide.
Sources
- DataReportal — Global Digital Overview
- Internet Live Stats — Website & Internet Statistics
- StatCounter — Platform & Browser Market Share
- Imperva — Bad Bot Report
- GSMA — Mobile Economy Report
- ITU — Internet Statistics
- Verisign — Domain Name Industry Brief
- Statista — Digital Market Reports
Frequently Asked Questions
How many people use the internet in 2026?
There are 5.52 billion internet users worldwide, representing 68% of the global population of 8.1 billion. Approximately 640,000 new users connect daily. China leads with 1.09 billion users, followed by India (900M+), the US (330M+), and Indonesia (210M+). However, 2.6 billion people remain offline, primarily in Central Africa and South Asia.
How many websites are there?
There are 1.9 billion+ registered websites, but only approximately 200 million (~10%) are actively maintained and serving content. About 252,000 new websites are created daily, but the average website lasts only 2.7 years. WordPress powers 42.6% of all active websites. For the complete breakdown, see our how many websites are there analysis.
What percentage of internet traffic is mobile?
Mobile devices account for 60%+ of all web traffic globally, with 5.1 billion people accessing the internet via mobile. Approximately 900 million people are mobile-only internet users with no desktop access. Mobile screen time averages 4 hours 37 minutes daily. 5G coverage has reached 45% of the world’s population, and average mobile data usage is 19 GB/month.
How much of internet traffic is bots?
According to Imperva’s 2024 Bad Bot Report, 51.8% of all internet traffic comes from bots. Of this, 19.8% is “good” bot traffic (search engine crawlers, monitoring tools) and 32% is “bad” bot traffic (scrapers, spam bots, credential stuffing, DDoS). This means more than half of all requests hitting websites are not from real human users, which has significant implications for analytics, server costs, and security planning. For related security data, see our digital marketing statistics report.
Related Posts


Comments (0)