50+ Site Speed Statistics: Page Load, CWV & Performance (2026)
Last updated: March 2026
A one-second delay in page load time costs 7% in conversions, 53% of mobile users abandon sites that take over 3 seconds to load, and only 33% of websites pass all Core Web Vitals. With average mobile page load times still at 8.6 seconds and page weights exceeding 2.3 MB, site speed remains one of the most impactful — and most neglected — factors in web performance. Here are 100+ site speed statistics covering conversions, Core Web Vitals, page weight, mobile performance, and CMS comparisons for 2026.
Key Site Speed Statistics (2026)
- 53% of mobile visitors abandon sites loading over 3 seconds (Google)
- 1-second delay = 7% conversion drop (Akamai)
- Average page load: 2.5s desktop / 8.6s mobile (HTTP Archive)
- Average page weight: 2.3 MB (HTTP Archive)
- Only 33% of sites pass all Core Web Vitals (HTTP Archive)
- Images account for 50%+ of page weight (HTTP Archive)
- CDN adoption: 70%+ of top sites (W3Techs)
Speed & Conversion Impact
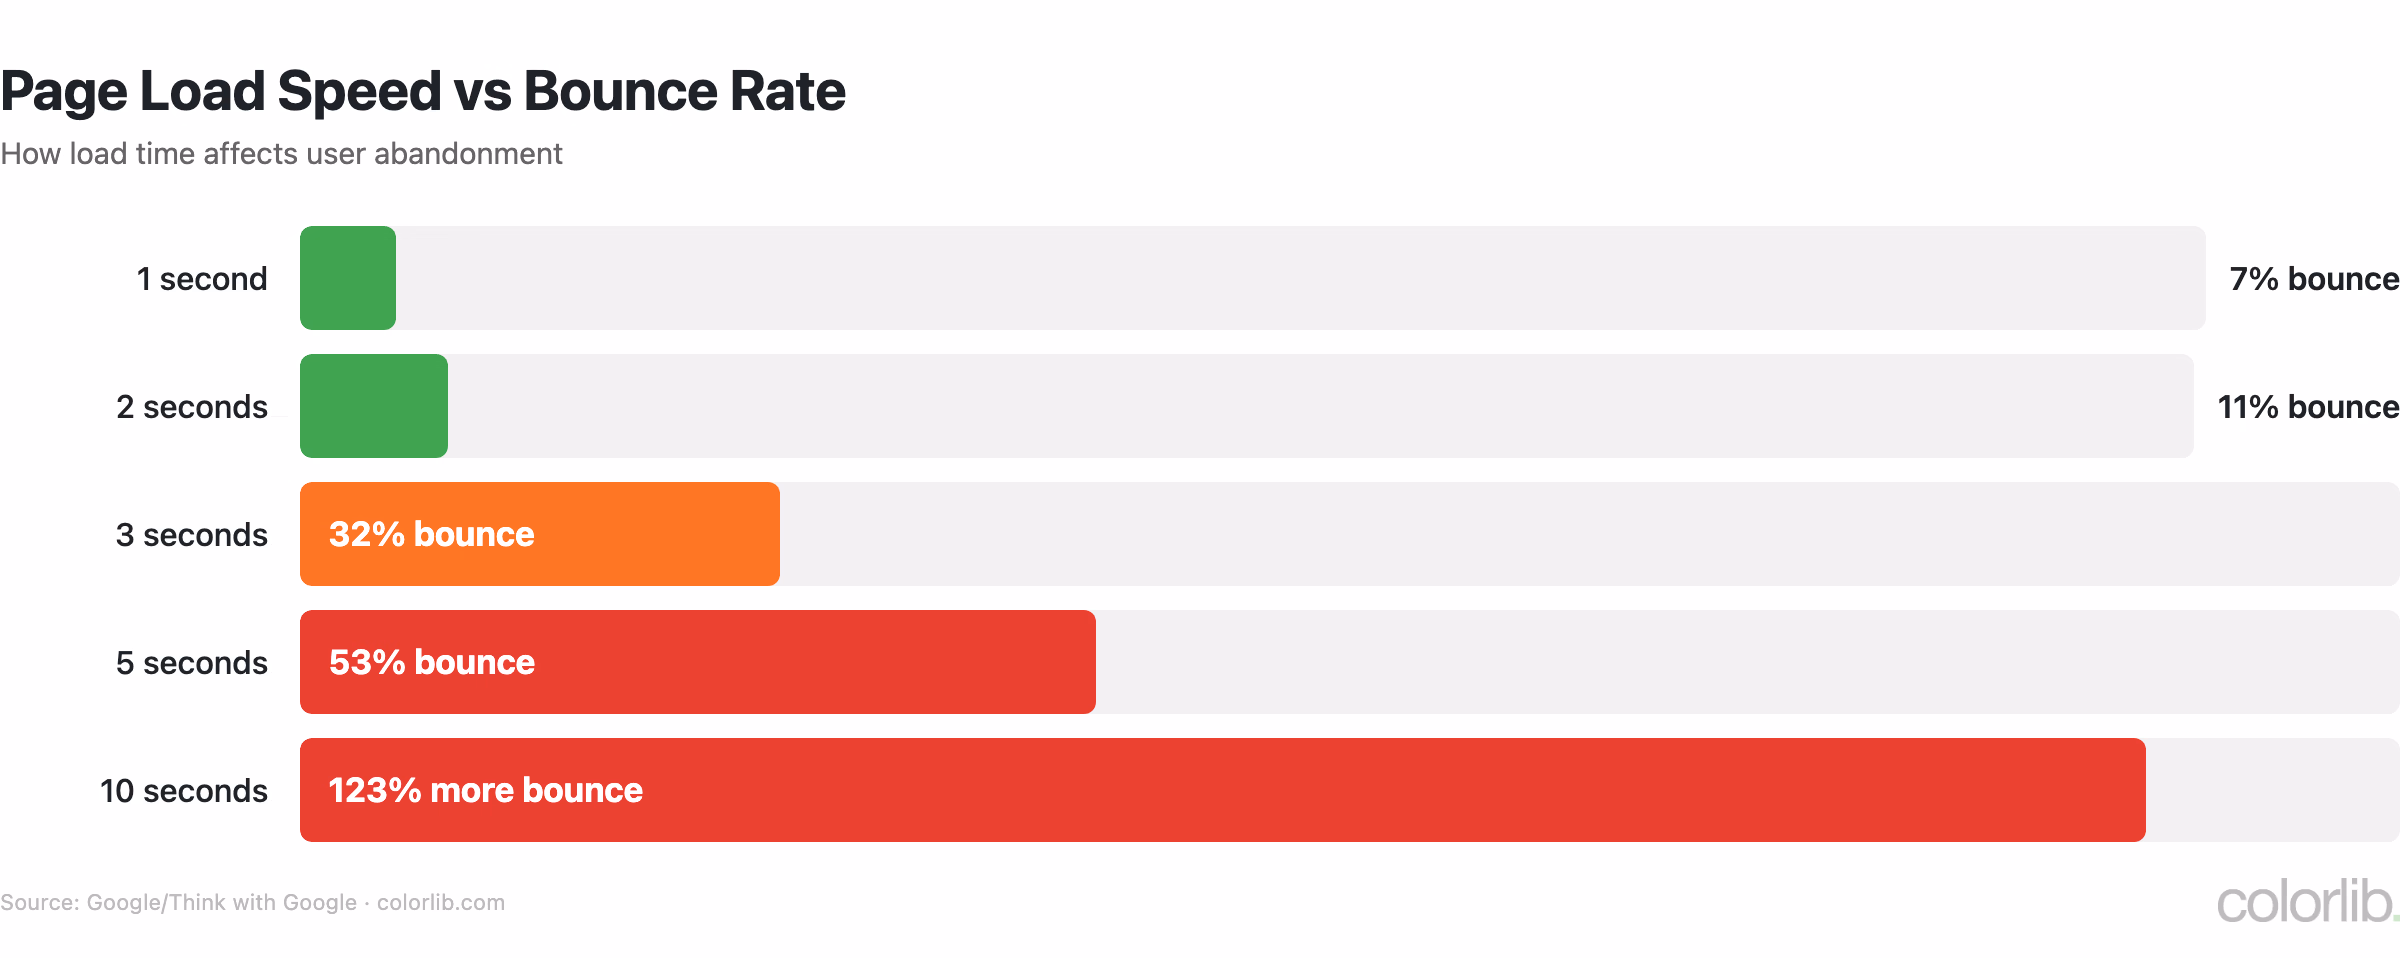
| Load Time | Bounce Rate Impact | Conversion Impact |
|---|---|---|
| 0-1 second | Baseline | Optimal conversion |
| 1-2 seconds | +9% bounce rate | -3.5% conversions |
| 2-3 seconds | +32% bounce rate | -7% conversions |
| 3-5 seconds | +90% bounce rate | -15% conversions |
| 5-10 seconds | +123% bounce rate | -25%+ conversions |
| 10+ seconds | +200%+ bounce rate | -40%+ conversions |
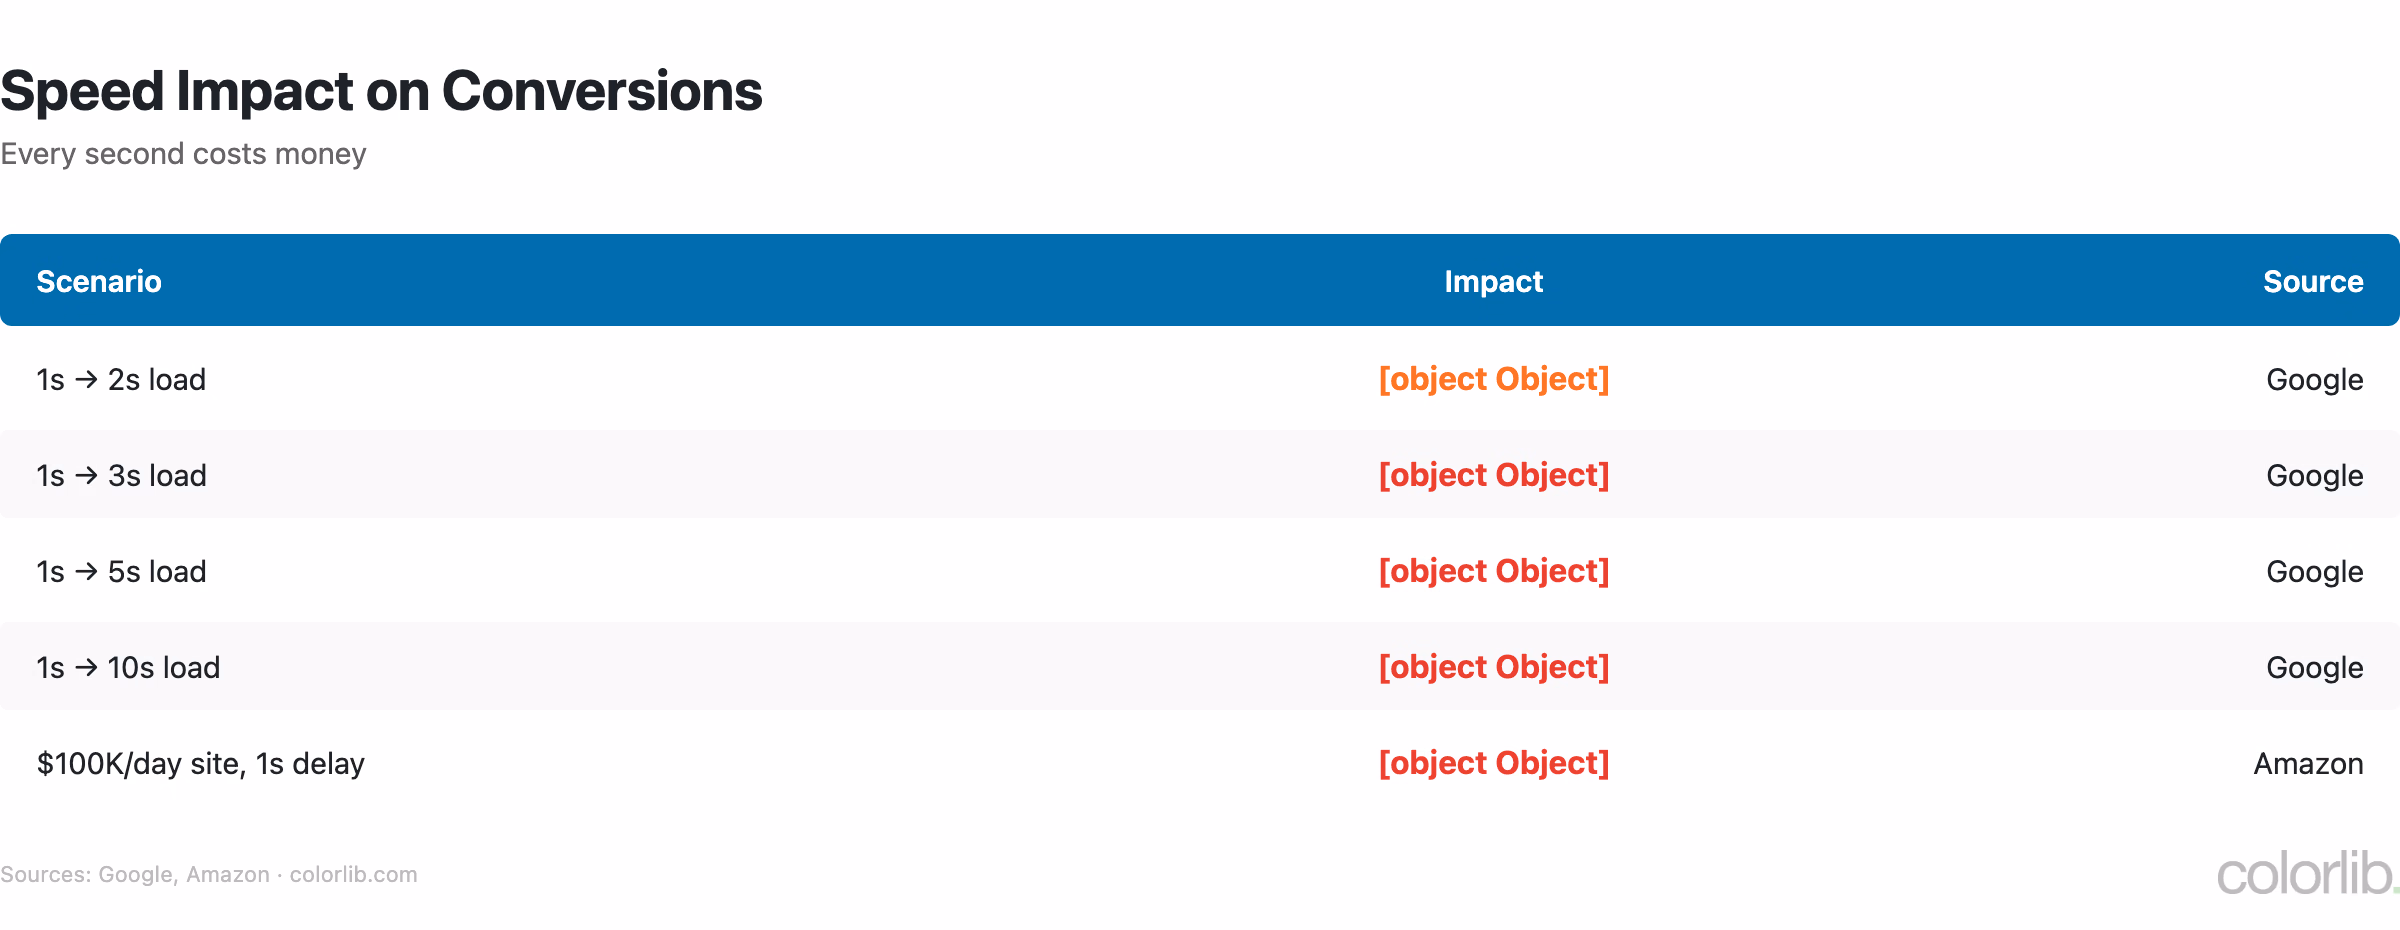
- Every 1-second delay in page load time results in a 7% reduction in conversions, 11% fewer page views, and 16% decrease in customer satisfaction
- 53% of mobile users abandon a page that takes longer than 3 seconds to load — yet the average mobile page takes 8.6 seconds
- Portent found that pages loading in 1 second have a 39% conversion rate, while pages loading in 5 seconds have only a 22% conversion rate
- Amazon calculated that a 100ms delay costs 1% of sales — for Amazon, that equates to $4.8 billion annually
- Walmart found that for every 1-second improvement in page load time, conversions increased by 2%
Core Web Vitals Statistics
| Metric | Good Threshold | % of Sites Passing |
|---|---|---|
| LCP (Largest Contentful Paint) | ≤ 2.5 seconds | 58% |
| INP (Interaction to Next Paint) | ≤ 200 milliseconds | 72% |
| CLS (Cumulative Layout Shift) | ≤ 0.1 | 75% |
| All three CWV | Pass all thresholds | 33% |
- Only 33% of websites pass all three Core Web Vitals — LCP is the most common failure point, with only 58% meeting the 2.5s threshold
- INP replaced FID as a Core Web Vital in March 2024, measuring responsiveness more accurately — 72% of sites pass the 200ms threshold
- CLS (layout shift) has the highest pass rate at 75%, improved by widespread adoption of explicit image dimensions and font display swap
- Core Web Vitals are a confirmed Google ranking factor since June 2021 — sites with good CWV see measurable ranking benefits
- The CWV pass rate has improved from 22% (2021) to 33% (2026), driven by better hosting, image optimization, and framework improvements
Page Weight Trends
| Year | Median Page Weight (Desktop) | Median Page Weight (Mobile) |
|---|---|---|
| 2015 | 1.2 MB | 0.9 MB |
| 2018 | 1.7 MB | 1.5 MB |
| 2020 | 2.0 MB | 1.8 MB |
| 2022 | 2.2 MB | 2.0 MB |
| 2024 | 2.3 MB | 2.1 MB |
| 2026 | 2.3 MB | 2.1 MB |
- Page weight growth has finally plateaued at ~2.3 MB desktop / 2.1 MB mobile, after years of steady increases
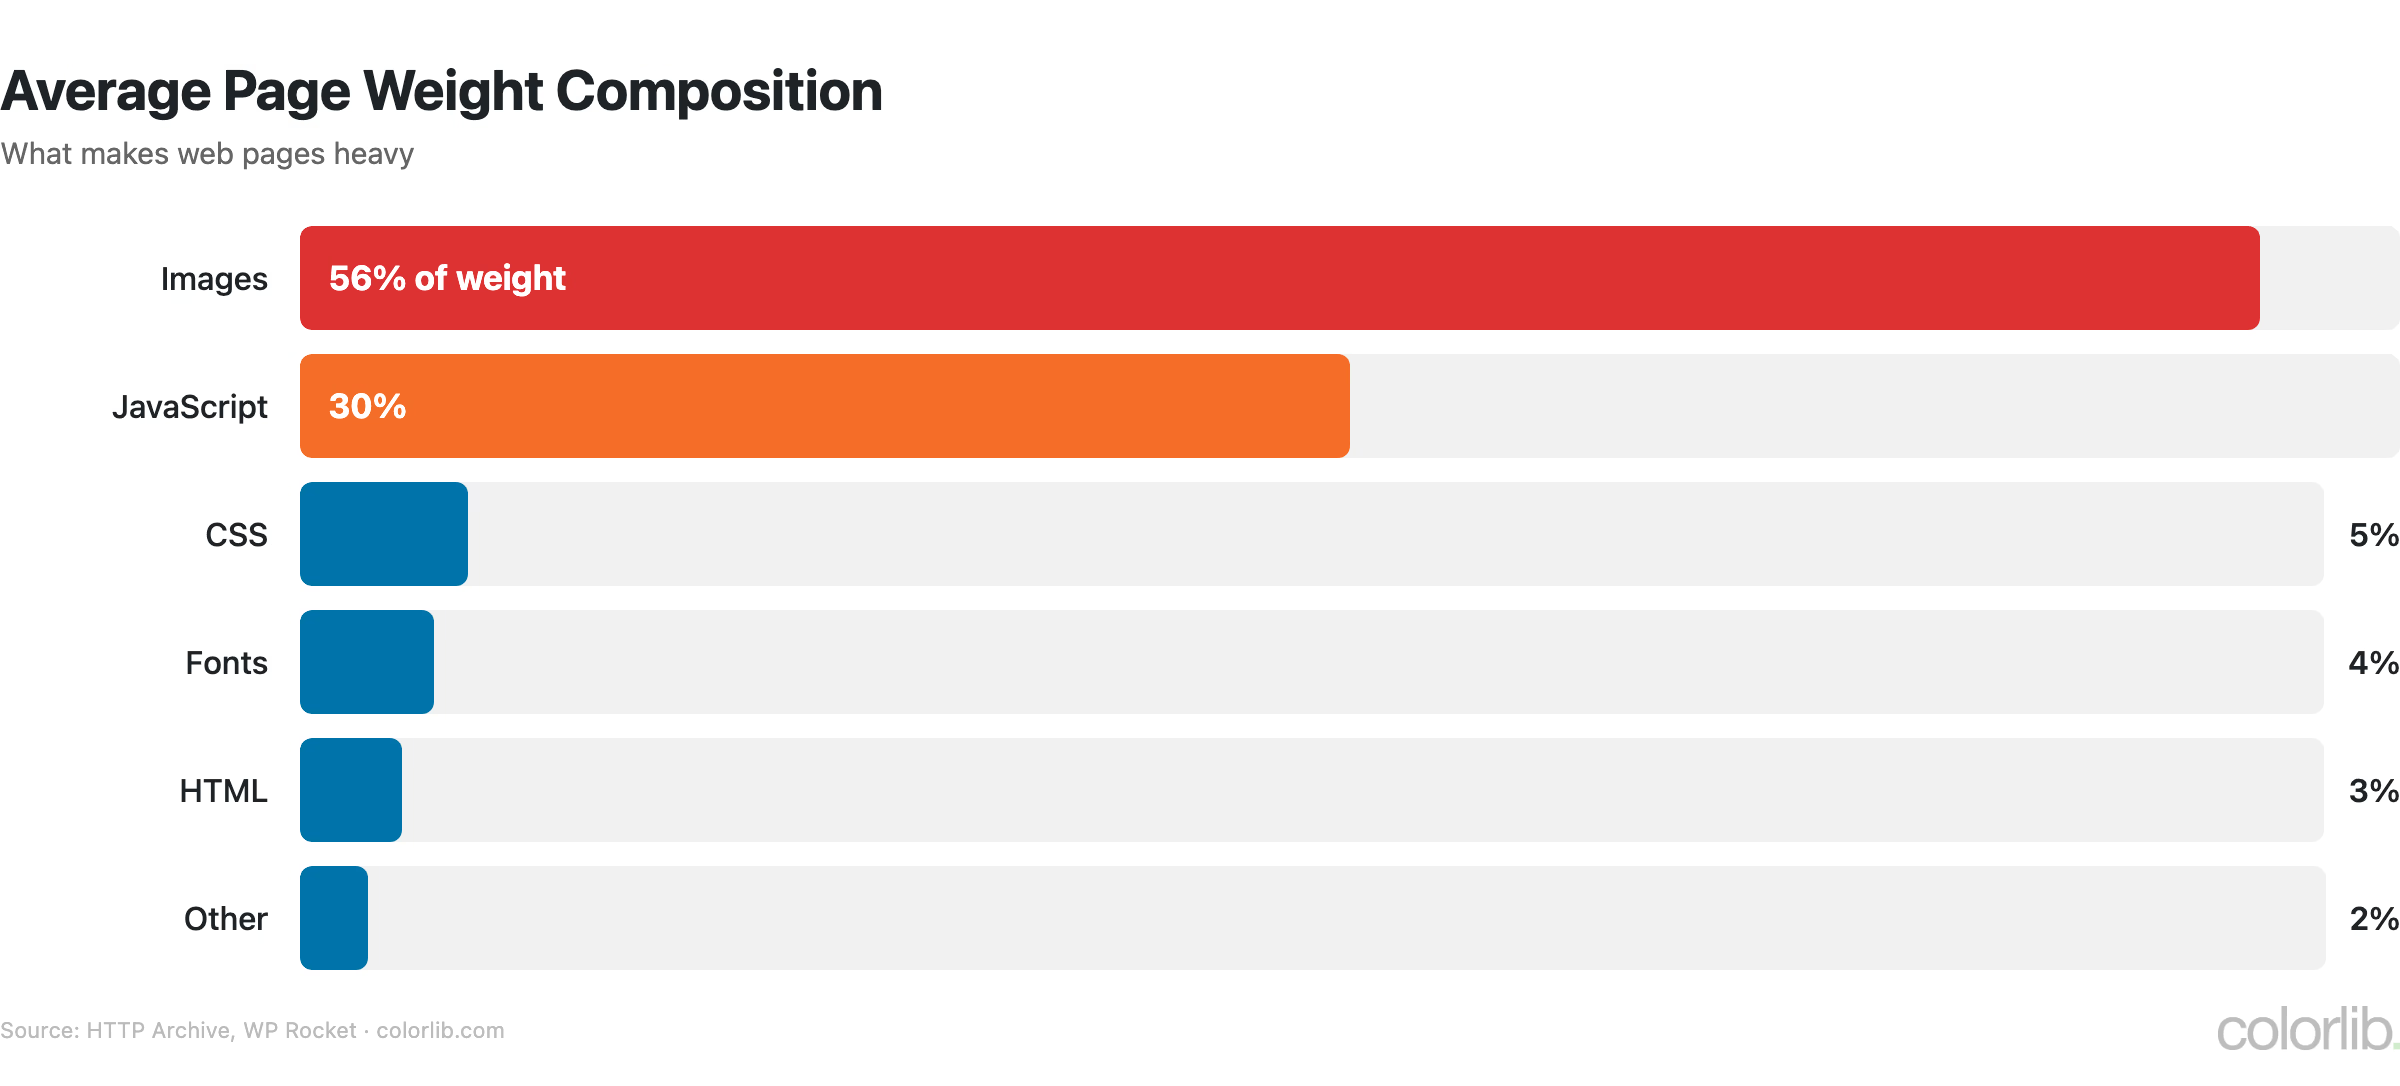
- Images account for 50%+ of total page weight — unoptimized images remain the #1 performance killer
- JavaScript accounts for 22% of page weight (typically 400-500 KB), followed by CSS at 8% (70-100 KB)
- AVIF and WebP adoption has helped slow weight growth — AVIF reduces image size by 50-60% compared to JPEG
- The average page makes 70-80 HTTP requests, down from 100+ in 2020 due to HTTP/2 multiplexing and resource consolidation
Mobile vs. Desktop Performance
| Metric | Desktop | Mobile |
|---|---|---|
| Average page load | 2.5 seconds | 8.6 seconds |
| Median page weight | 2.3 MB | 2.1 MB |
| Share of web traffic | ~40% | ~60% |
| CWV pass rate | 48% | 33% |
| LCP pass rate | 72% | 58% |
| Bounce rate (slow pages) | +40% | +123% |
- Mobile pages load 3.4x slower than desktop (8.6s vs 2.5s) despite receiving 60%+ of traffic
- The mobile CWV pass rate (33%) is significantly lower than desktop (48%), primarily due to slower LCP on cellular connections
- Mobile-first indexing means Google ranks all sites based on mobile performance — desktop speed alone is insufficient
- The bounce rate penalty for slow mobile pages is 3x higher than desktop, making mobile optimization critical for engagement
- Progressive Web Apps (PWAs) load 2-3x faster than regular mobile web pages due to service worker caching
CMS Performance Comparison
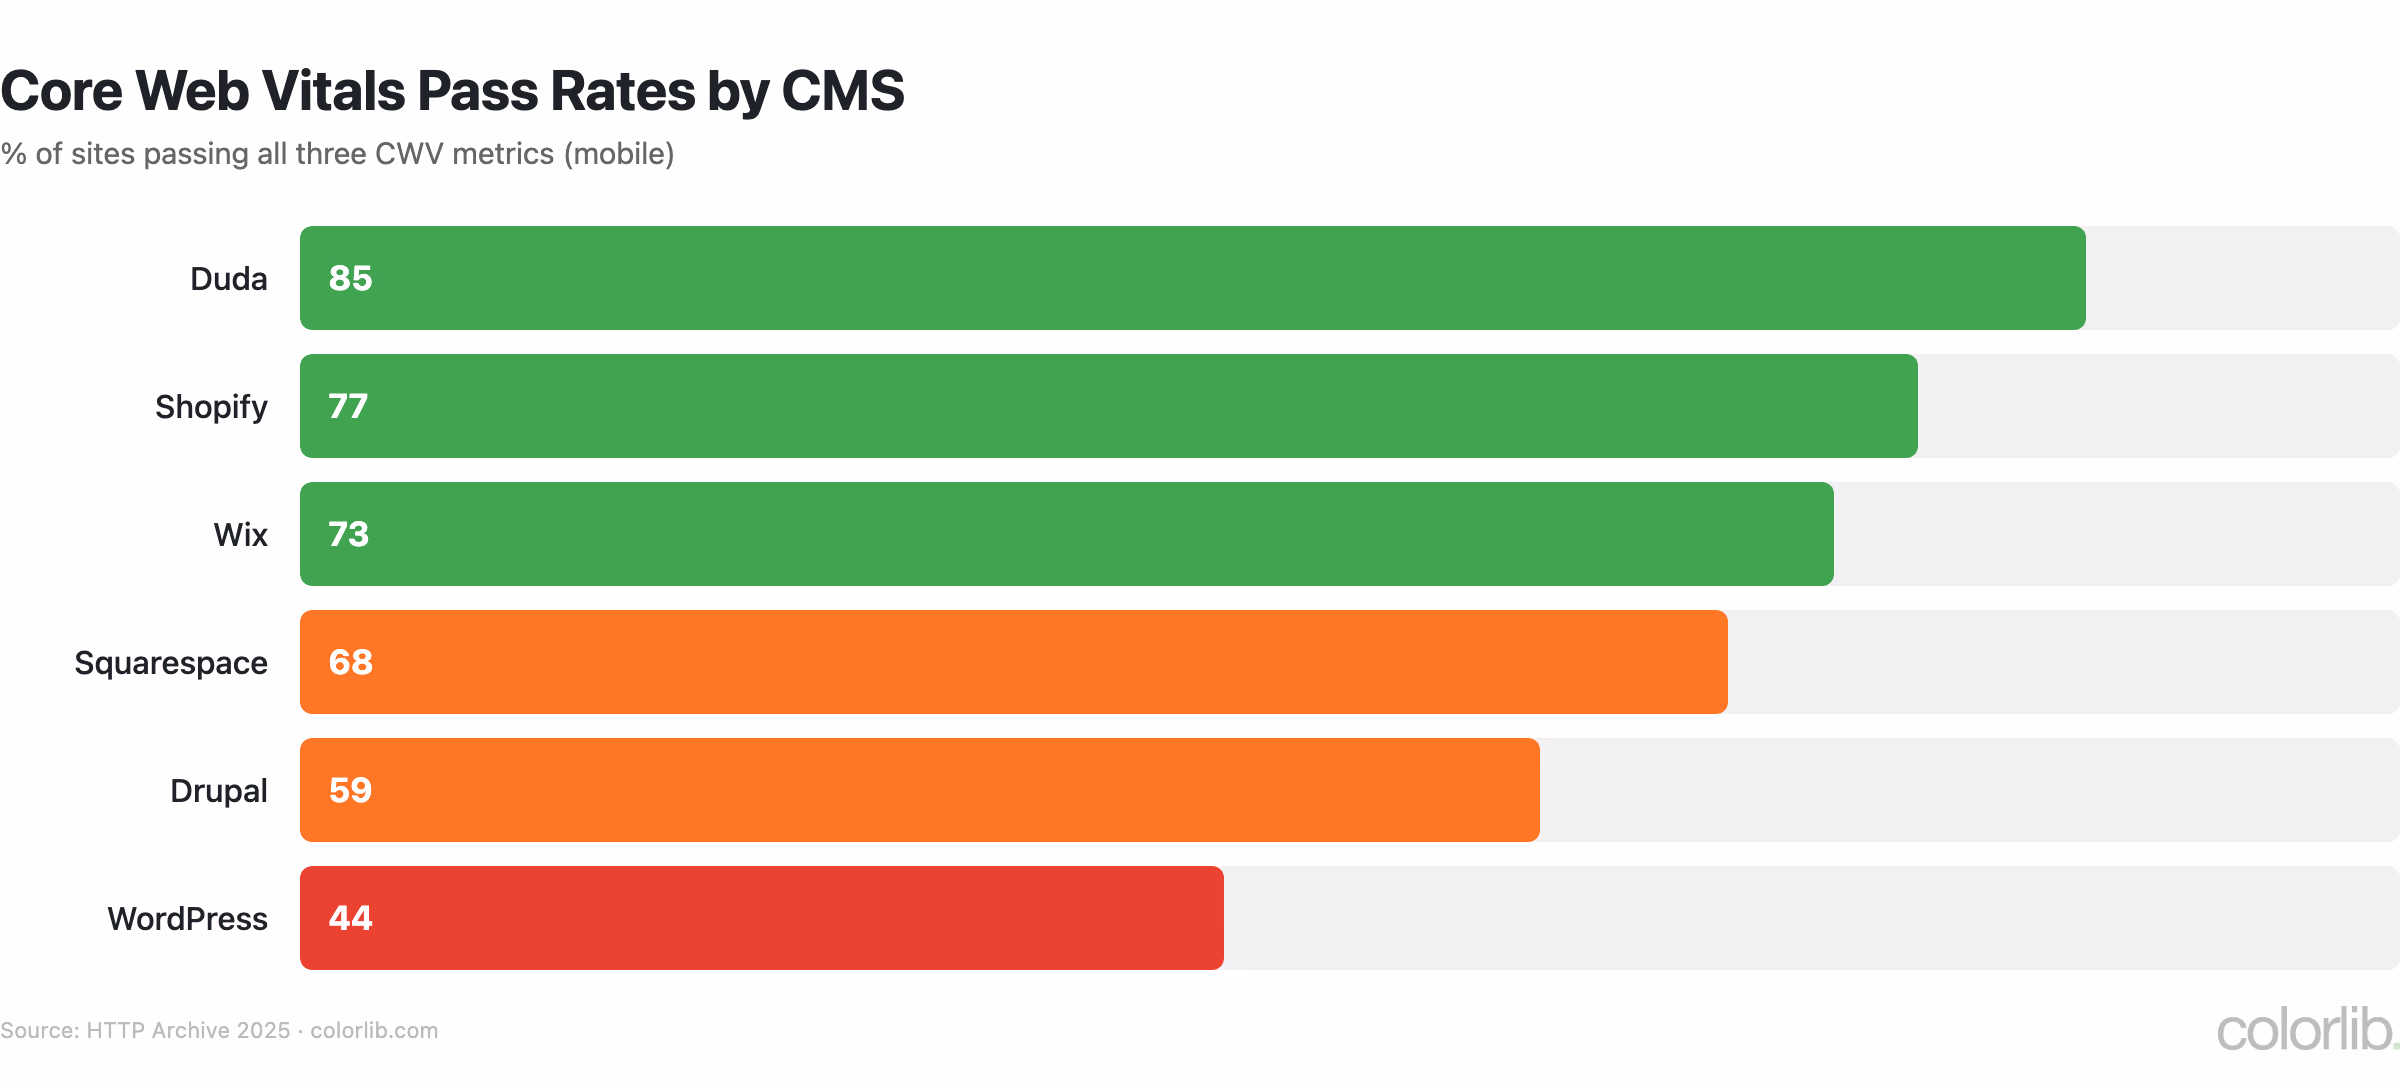
| Platform | CWV Pass Rate | Lighthouse Score | Avg. Load Time |
|---|---|---|---|
| Shopify | 75-78% | 55 | 1.8s |
| Wix | 71-75% | 64 | 2.2s |
| Squarespace | 55-60% | 42 | 2.8s |
| WordPress (all) | 33-40% | 35 | 3.5s |
| WordPress (managed) | 55-65% | 50 | 2.2s |
| Joomla | 28-32% | 30 | 4.2s |
| Drupal | 40-45% | 42 | 3.0s |
- Hosted platforms (Shopify, Wix) consistently outperform self-hosted platforms (WordPress, Joomla) because they control the full stack
- WordPress on managed hosting (WP Engine, Kinsta, Cloudways) achieves 55-65% CWV pass rates — comparable to Squarespace
- The wide variance in WordPress performance reflects hosting quality, theme choice, and plugin count more than the platform itself
- Wix has the highest Lighthouse score (64) of any major platform, reflecting significant infrastructure investments since 2020
- For platform-specific details, see our WordPress statistics and CMS market share reports
Key Takeaways
- Speed directly impacts revenue. Every 1-second delay costs 7% in conversions, and 53% of mobile users abandon slow sites. For ecommerce, speed optimization is literally money on the table.
- Most websites fail Core Web Vitals. Only 33% pass all three metrics, with LCP (58%) being the most common failure point. Two-thirds of the web has room for improvement.
- Mobile is 3.4x slower than desktop. Despite carrying 60%+ of traffic, mobile pages average 8.6 seconds — well above the 3-second abandonment threshold.
- Images are the #1 performance killer. At 50%+ of page weight, image optimization (AVIF, WebP, lazy loading) delivers the biggest speed gains with the least effort.
- Hosting matters more than platform. WordPress on managed hosting achieves 55-65% CWV pass rates — comparable to Squarespace and approaching Wix/Shopify levels.
- Page weight has plateaued at 2.3 MB. Modern image formats and HTTP/2 have slowed the growth trend, but the average page still makes 70-80 requests and loads significant JavaScript.
Sources
- HTTP Archive — Loading Speed Report
- HTTP Archive — Page Weight Report
- HTTP Archive — Chrome UX Report
- Google — Mobile Page Speed Benchmarks
- Akamai — Online Retail Performance Report
- Portent — Site Speed and Revenue Research
- Google — Core Web Vitals Documentation
Frequently Asked Questions
How fast should a website load?
Ideally, a website should load in under 2.5 seconds — that’s Google’s LCP (Largest Contentful Paint) threshold for “good” Core Web Vitals. Pages loading in 1-2 seconds have the best conversion rates. The 3-second mark is the critical abandonment threshold, where 53% of mobile users leave. Currently, the average desktop page loads in 2.5 seconds, but mobile averages 8.6 seconds.
Does site speed affect SEO?
Yes. Core Web Vitals have been a confirmed Google ranking factor since June 2021. Sites that pass all three CWV metrics (LCP, INP, CLS) receive a ranking boost, though content relevance and backlinks remain stronger signals. Beyond ranking, faster sites get lower bounce rates, higher engagement, and better conversion rates — all of which indirectly improve SEO performance. For more, see our web design statistics report.
What percentage of websites pass Core Web Vitals?
Only 33% of websites pass all three Core Web Vitals. Individually, 75% pass CLS, 72% pass INP, and 58% pass LCP. The pass rate has improved from 22% in 2021 to 33% in 2026. Hosted platforms like Shopify (75-78%) and Wix (71-75%) have the highest pass rates, while self-hosted WordPress averages 33-40%.
How much does a 1-second delay cost?
A 1-second delay in page load time costs approximately 7% in conversions, 11% fewer page views, and 16% decrease in customer satisfaction. For Amazon, a 100ms delay equals $4.8 billion in lost annual revenue. For a typical ecommerce store doing $1 million/year, a 1-second improvement could recover $70,000+ in conversions. The impact compounds on mobile, where slow pages see 3x higher bounce rates. For CMS-specific performance data, see our CMS market share analysis.
Related Posts


Comments (0)