Search Engine Statistics 2026: Market Share, Volume & AI
Last updated: March 2026
Google controls 91.4% of the global search market, processes 8.5 billion searches per day, and generates $307 billion in annual ad revenue. Yet 58-62% of Google searches now end without a click, AI Overviews appear on 25%+ of queries, and 15% of daily searches have never been seen before. Here are 100+ search engine statistics covering market share, Google dominance, search volume, mobile trends, AI impact, and alternative search engines for 2026.
Key Search Engine Statistics (2026)
- Google: 91.4% global market share (StatCounter)
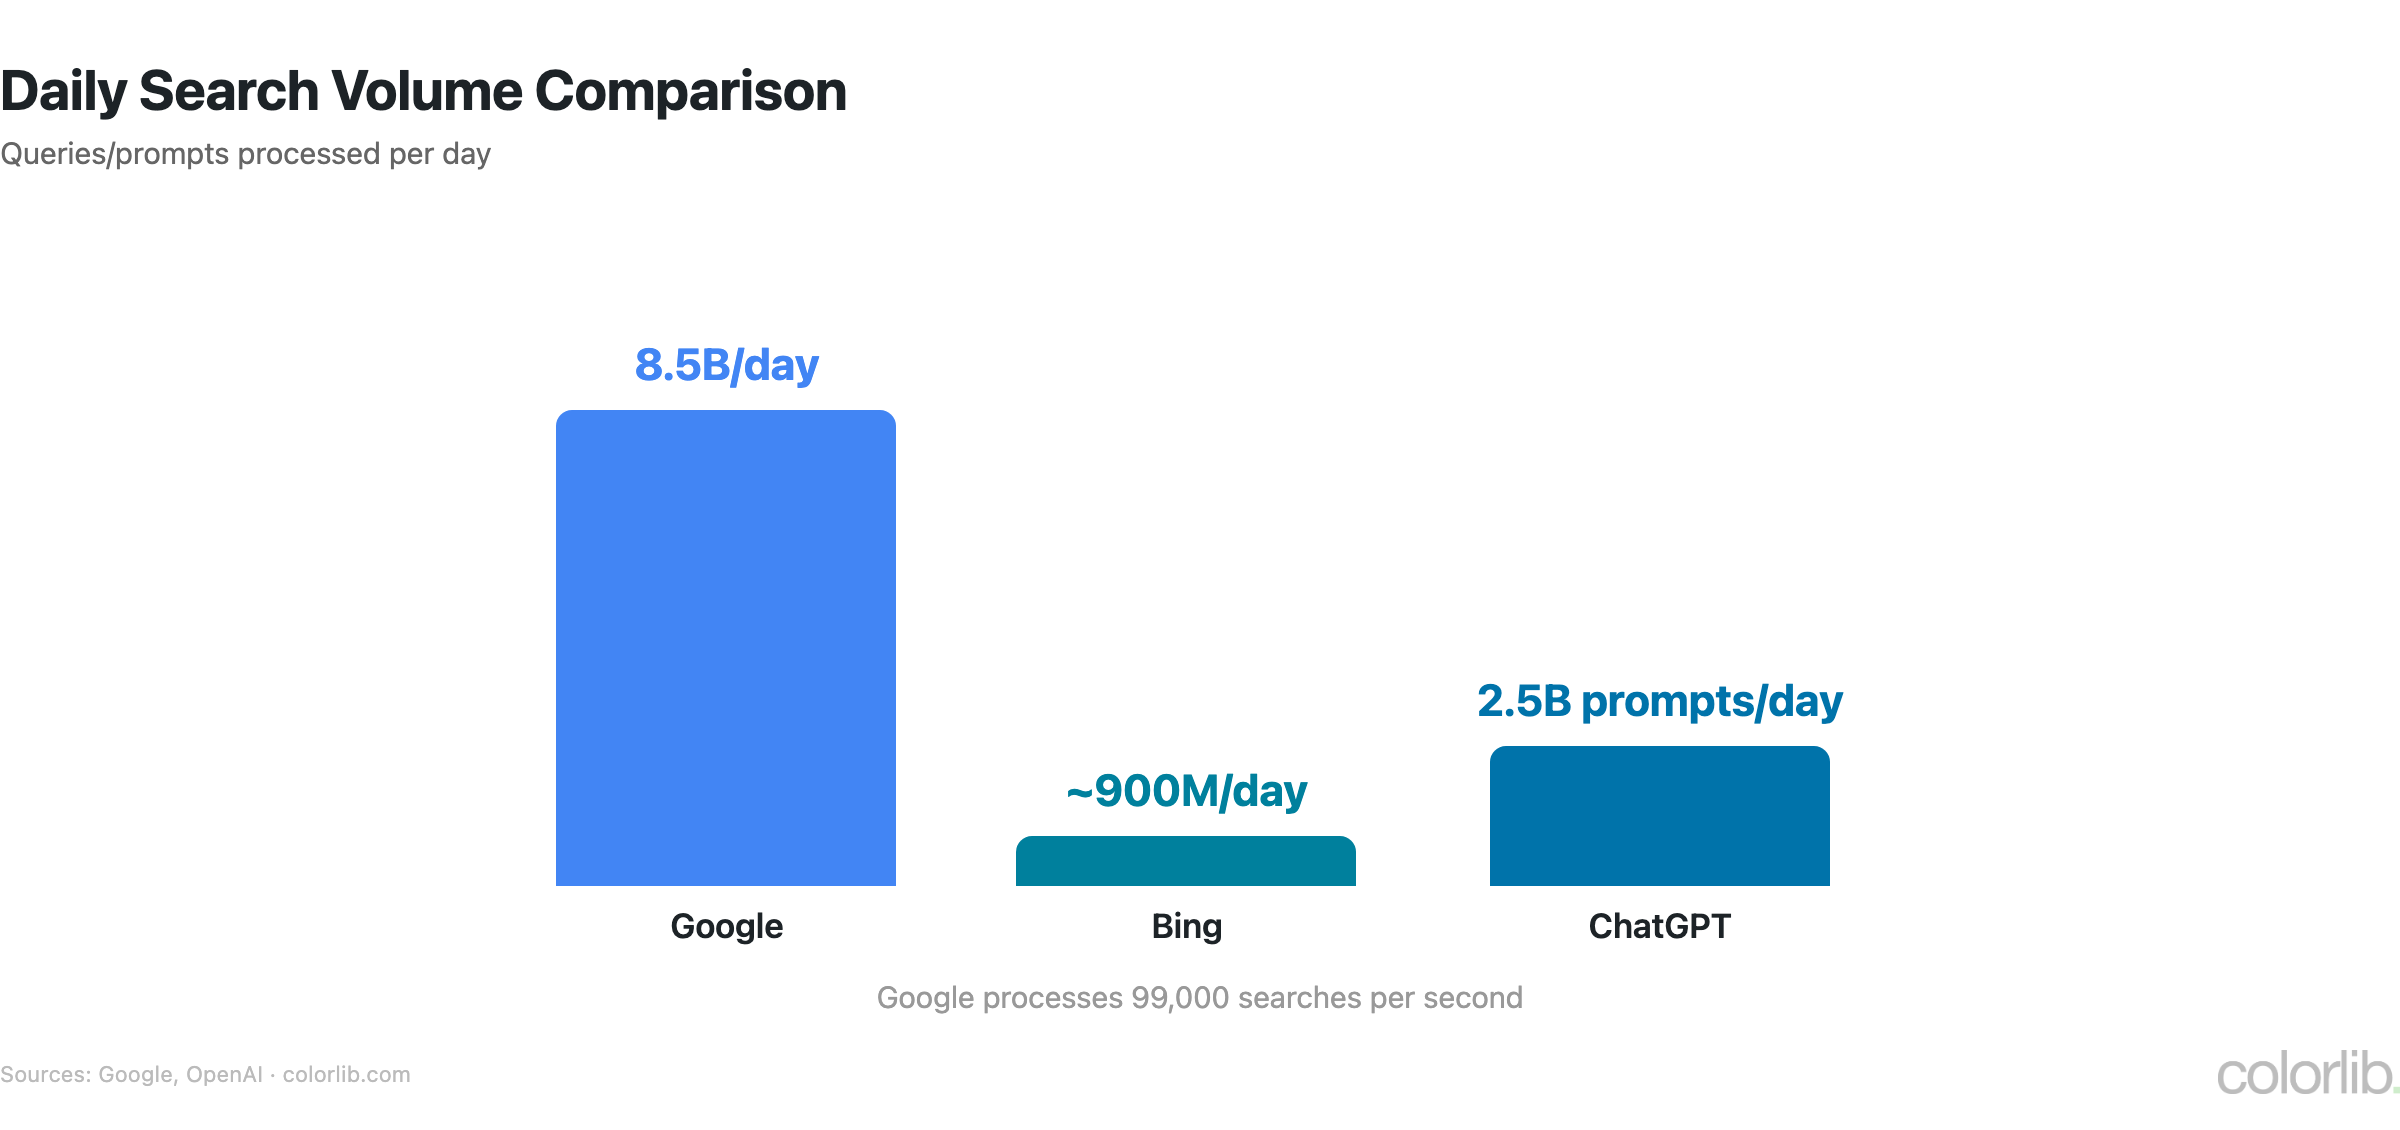
- 8.5 billion Google searches per day (Internet Live Stats)
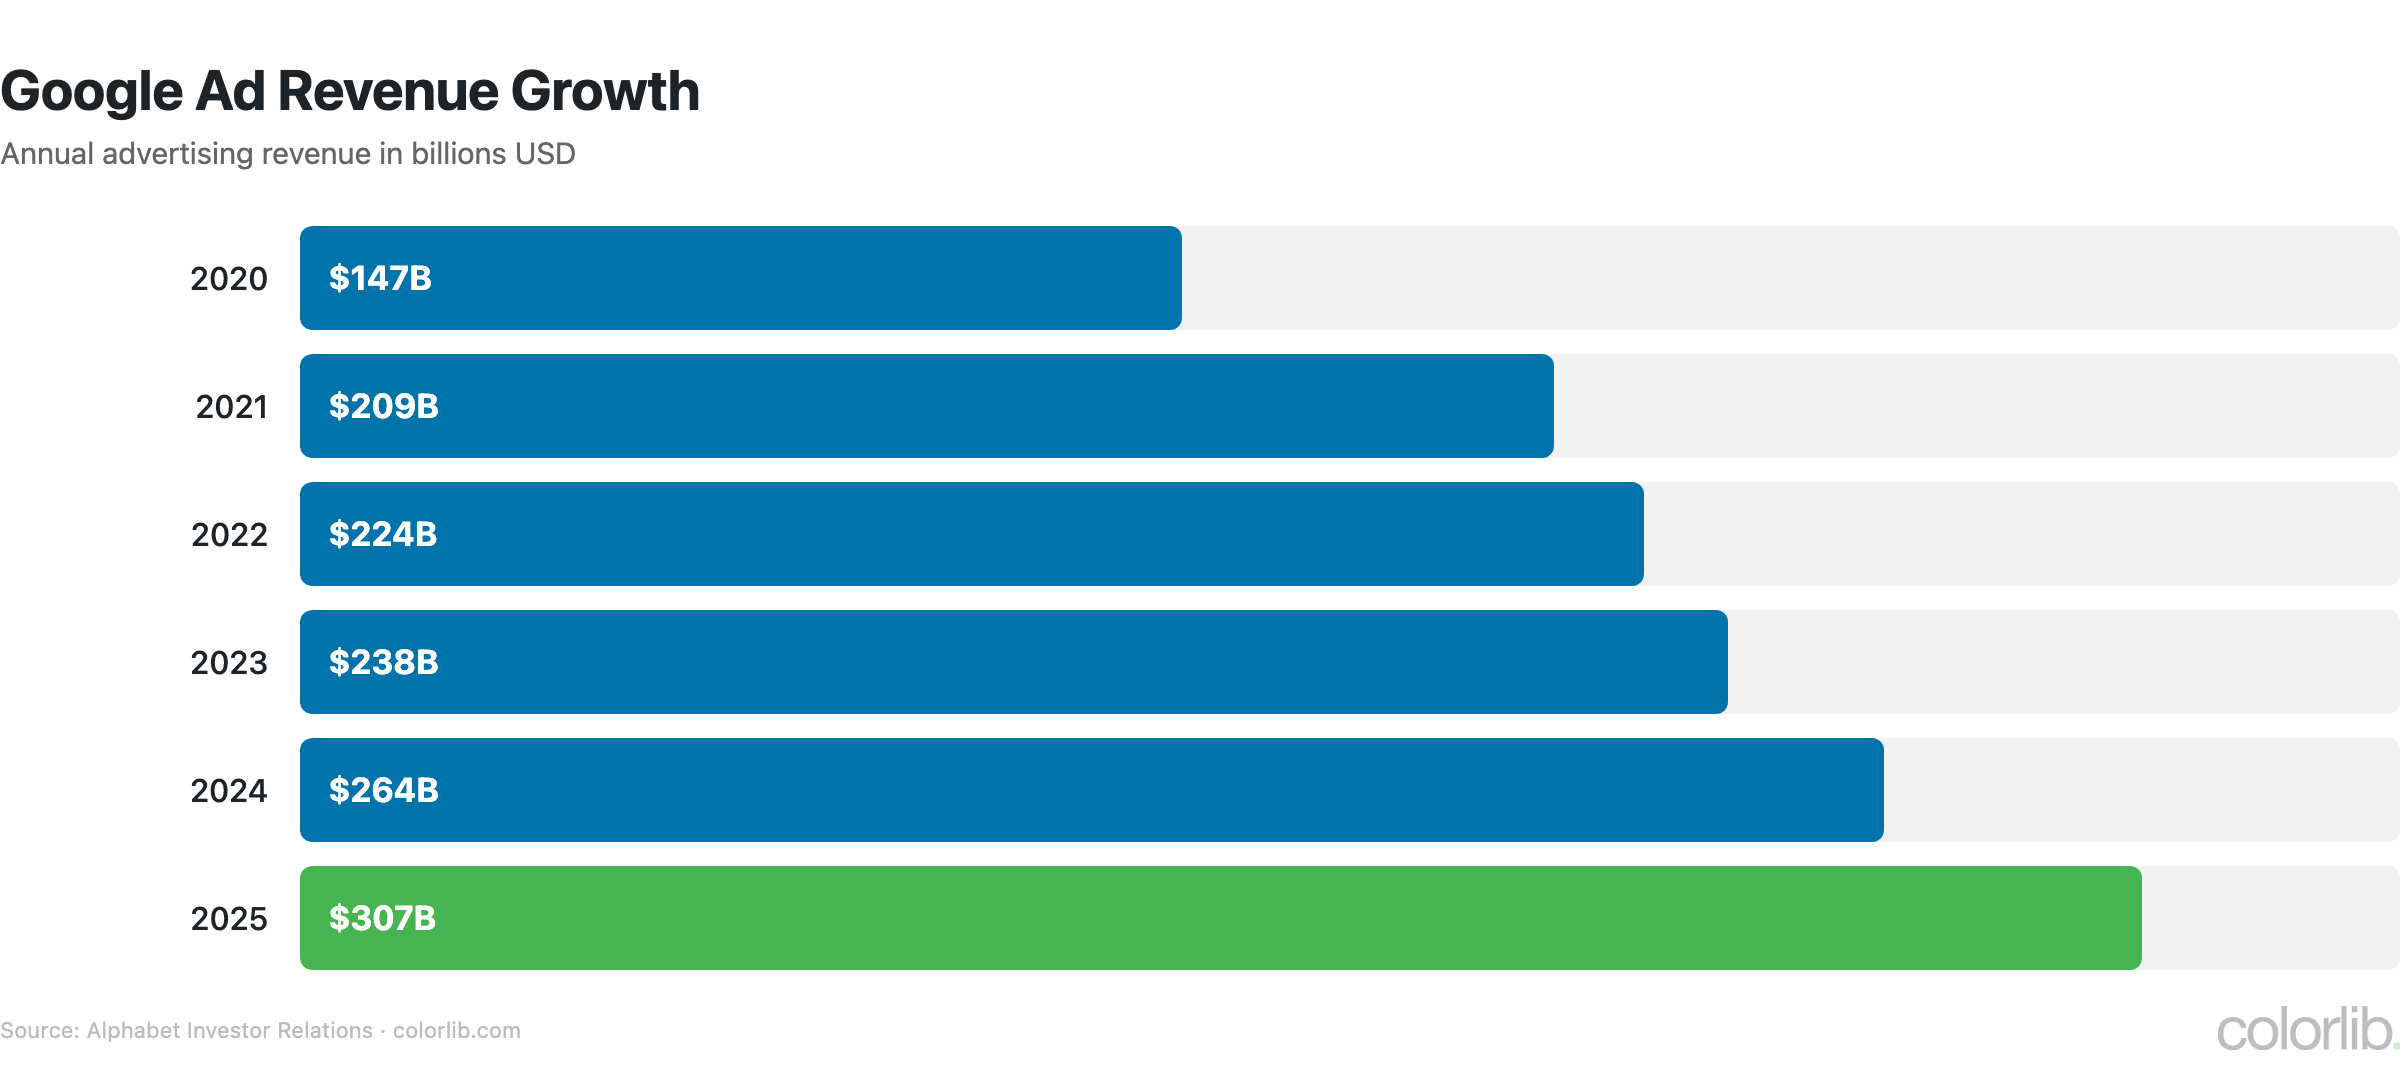
- Google ad revenue: $307 billion (2024) (Alphabet IR)
- Zero-click searches: 58-62% of queries (SparkToro)
- AI Overviews on 25%+ of Google queries (Search Engine Land)
- 15% of daily searches are completely new (Google)
- Mobile: 63%+ of Google search traffic (StatCounter)
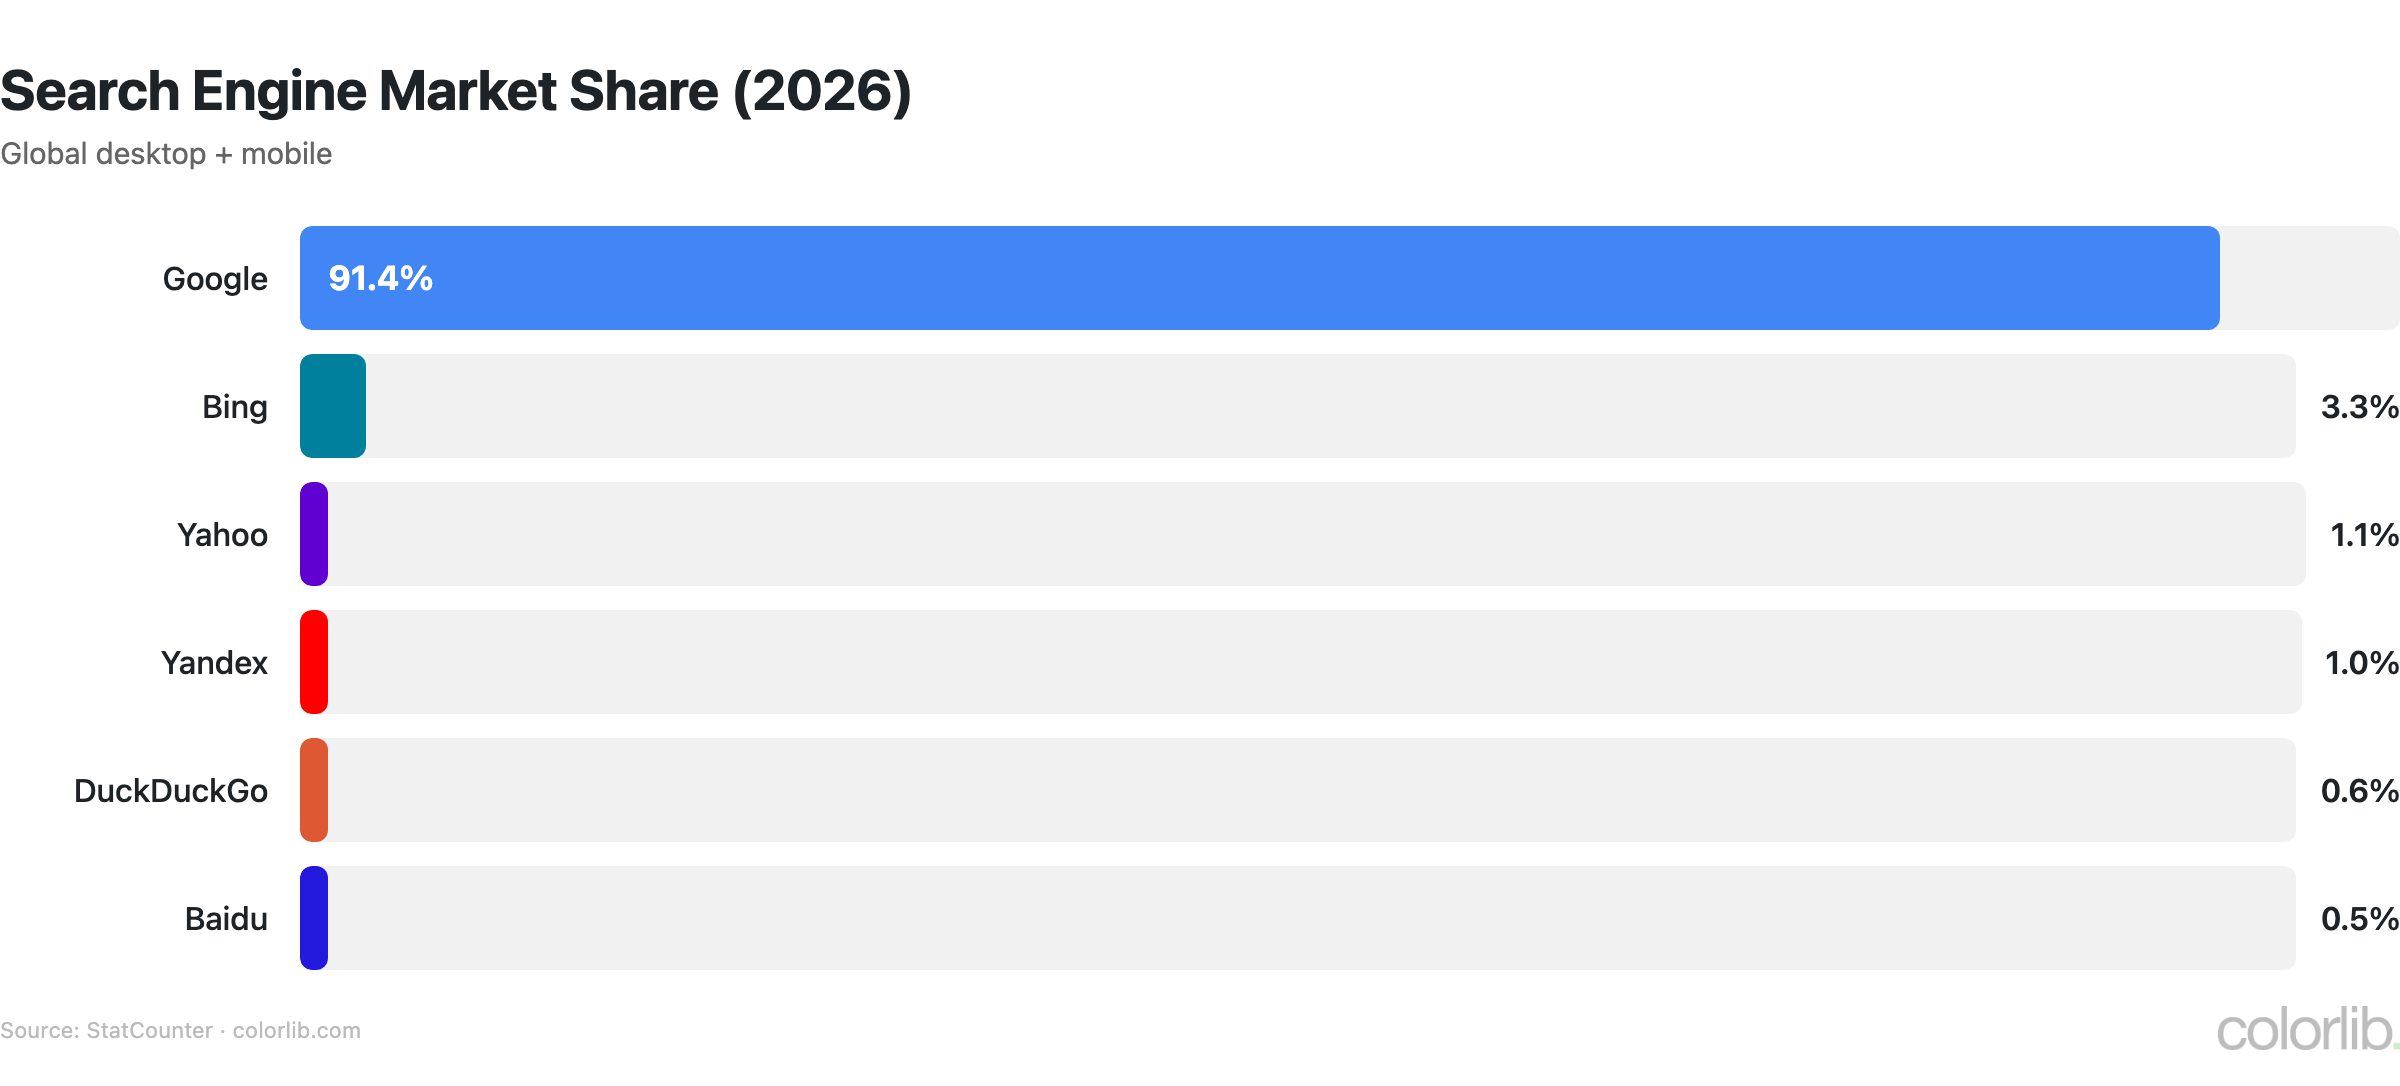
Search Engine Market Share
| Search Engine | Global Share | US Share | Trend |
|---|---|---|---|
| 91.4% | 87.7% | Stable / slight decline | |
| Bing | 3.3% | 7.2% | Growing (AI Chat) |
| Yandex | 1.8% | <0.5% | Stable (Russia/CIS) |
| Yahoo | 1.1% | 2.5% | Declining |
| Baidu | 0.8% | <0.1% | Stable (China only) |
| DuckDuckGo | 0.6% | 2.1% | Stable |
| Other | 1.0% | <0.5% | AI chatbots growing |
- Google’s 91.4% global share has remained remarkably stable for over a decade, despite competition from AI chatbots
- Bing’s share has grown slightly to 3.3% globally and 7.2% in the US, driven by its Copilot AI integration and Microsoft Edge defaults
- DuckDuckGo holds 2.1% of US searches, appealing to privacy-conscious users, though its growth has stalled
- AI chatbots (ChatGPT, Perplexity, Claude) handle an estimated 2-3% of search-like queries, though they don’t appear in traditional market share data
- For platform-level data, see our CMS market share analysis
Google Dominance Statistics
| Metric | Value | Source |
|---|---|---|
| Daily searches | 8.5 billion | Internet Live Stats |
| Annual searches | 3.1 trillion+ | Calculated from daily |
| Searches per second | ~99,000 | Calculated from daily |
| Google ad revenue (2024) | $307 billion | Alphabet IR |
| Alphabet total revenue (2024) | $350 billion | Alphabet IR |
| Google Search revenue share | 57% of Alphabet revenue | Alphabet IR |
| Google employees | 180,000+ | Alphabet IR |
| Google data centers | 35+ globally |
- Google generates $307 billion in annual ad revenue, making it the world’s largest advertising platform — more than Meta ($160B) and Amazon ($50B) combined
- Google Search specifically accounts for 57% of Alphabet’s total revenue, with YouTube ads (10%) and Google Network (8%) adding to the total
- Google processes approximately 99,000 searches every second, served from 35+ data centers across six continents
- Despite antitrust lawsuits, Google’s 91.4% market share has barely moved — the DOJ ruling in August 2024 found Google holds an illegal monopoly
- Google pays Apple an estimated $20 billion/year to remain the default search engine on Safari and iOS
Search Volume & Behavior
| Metric | Value | Source |
|---|---|---|
| New searches (never seen before) | 15% daily | |
| Average search session length | 1.2 minutes | Semrush |
| Average queries per session | 3.4 | Semrush |
| Searches with local intent | 46% | |
| Voice search share (mobile) | 50%+ | |
| Image search share | 22% of all searches | SparkToro |
| Video search results | 26% of SERPs | Semrush |
| Featured snippets | 12.3% of queries | Ahrefs |
- 15% of daily searches are queries Google has never seen before, driven by evolving language, current events, and conversational search patterns
- 46% of searches have local intent — queries like “near me,” “open now,” or local business names, making local SEO critical for brick-and-mortar businesses
- Voice search accounts for 50%+ of smartphone searches, and voice queries tend to be longer and more conversational
- Google Image Search handles 22% of all searches, making image optimization and alt text important for visibility
- The average user performs 3.4 searches per session over 1.2 minutes, indicating rapid query refinement behavior
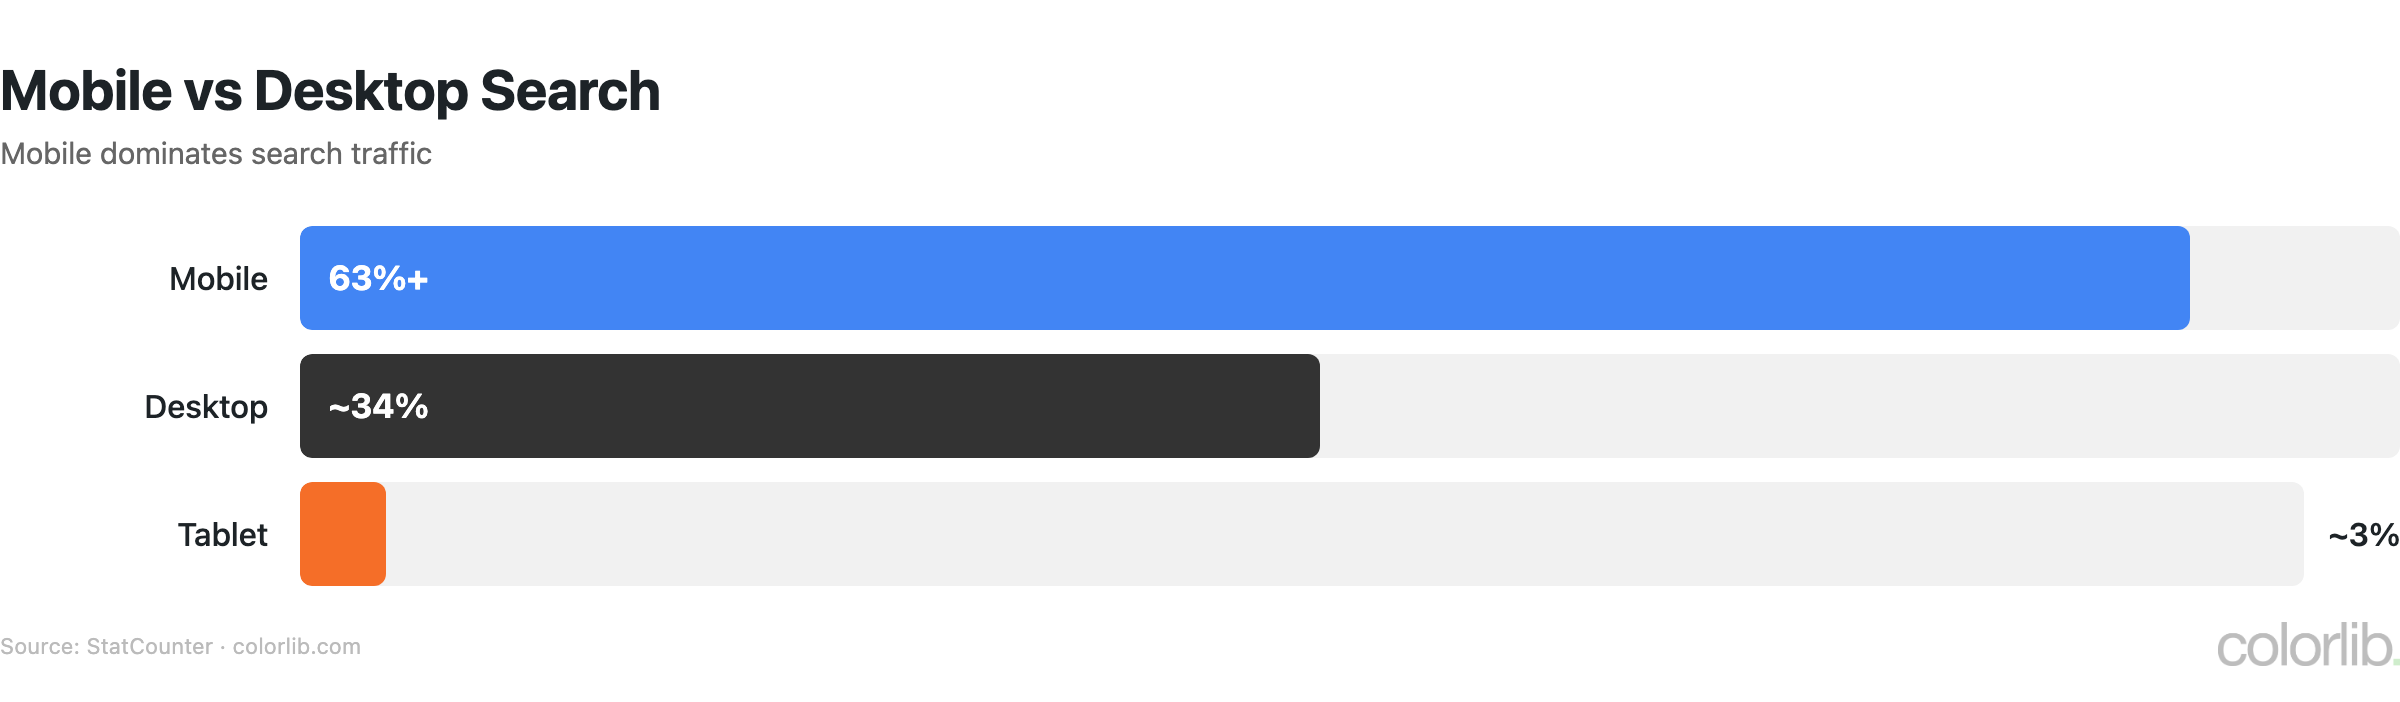
Mobile Search Statistics
| Metric | Value | Source |
|---|---|---|
| Mobile share of Google searches | 63%+ | StatCounter |
| Mobile-first indexing | 100% of sites | |
| “Near me” searches growth | +500% since 2015 | |
| Mobile voice search users | 50%+ | |
| Mobile click-through rate | Lower than desktop | Backlinko |
| App store searches daily | 65,000+ (App Store) | Apple |
- 63%+ of Google searches come from mobile devices, making mobile optimization essential for search visibility
- “Near me” searches have grown 500% since 2015, reflecting the dominance of mobile local search behavior
- Google uses mobile-first indexing for 100% of websites — your mobile site experience determines your rankings
- Mobile click-through rates are lower than desktop due to smaller screens, more SERP features, and the prevalence of zero-click results
- For how mobile performance affects search rankings, see our digital marketing statistics roundup
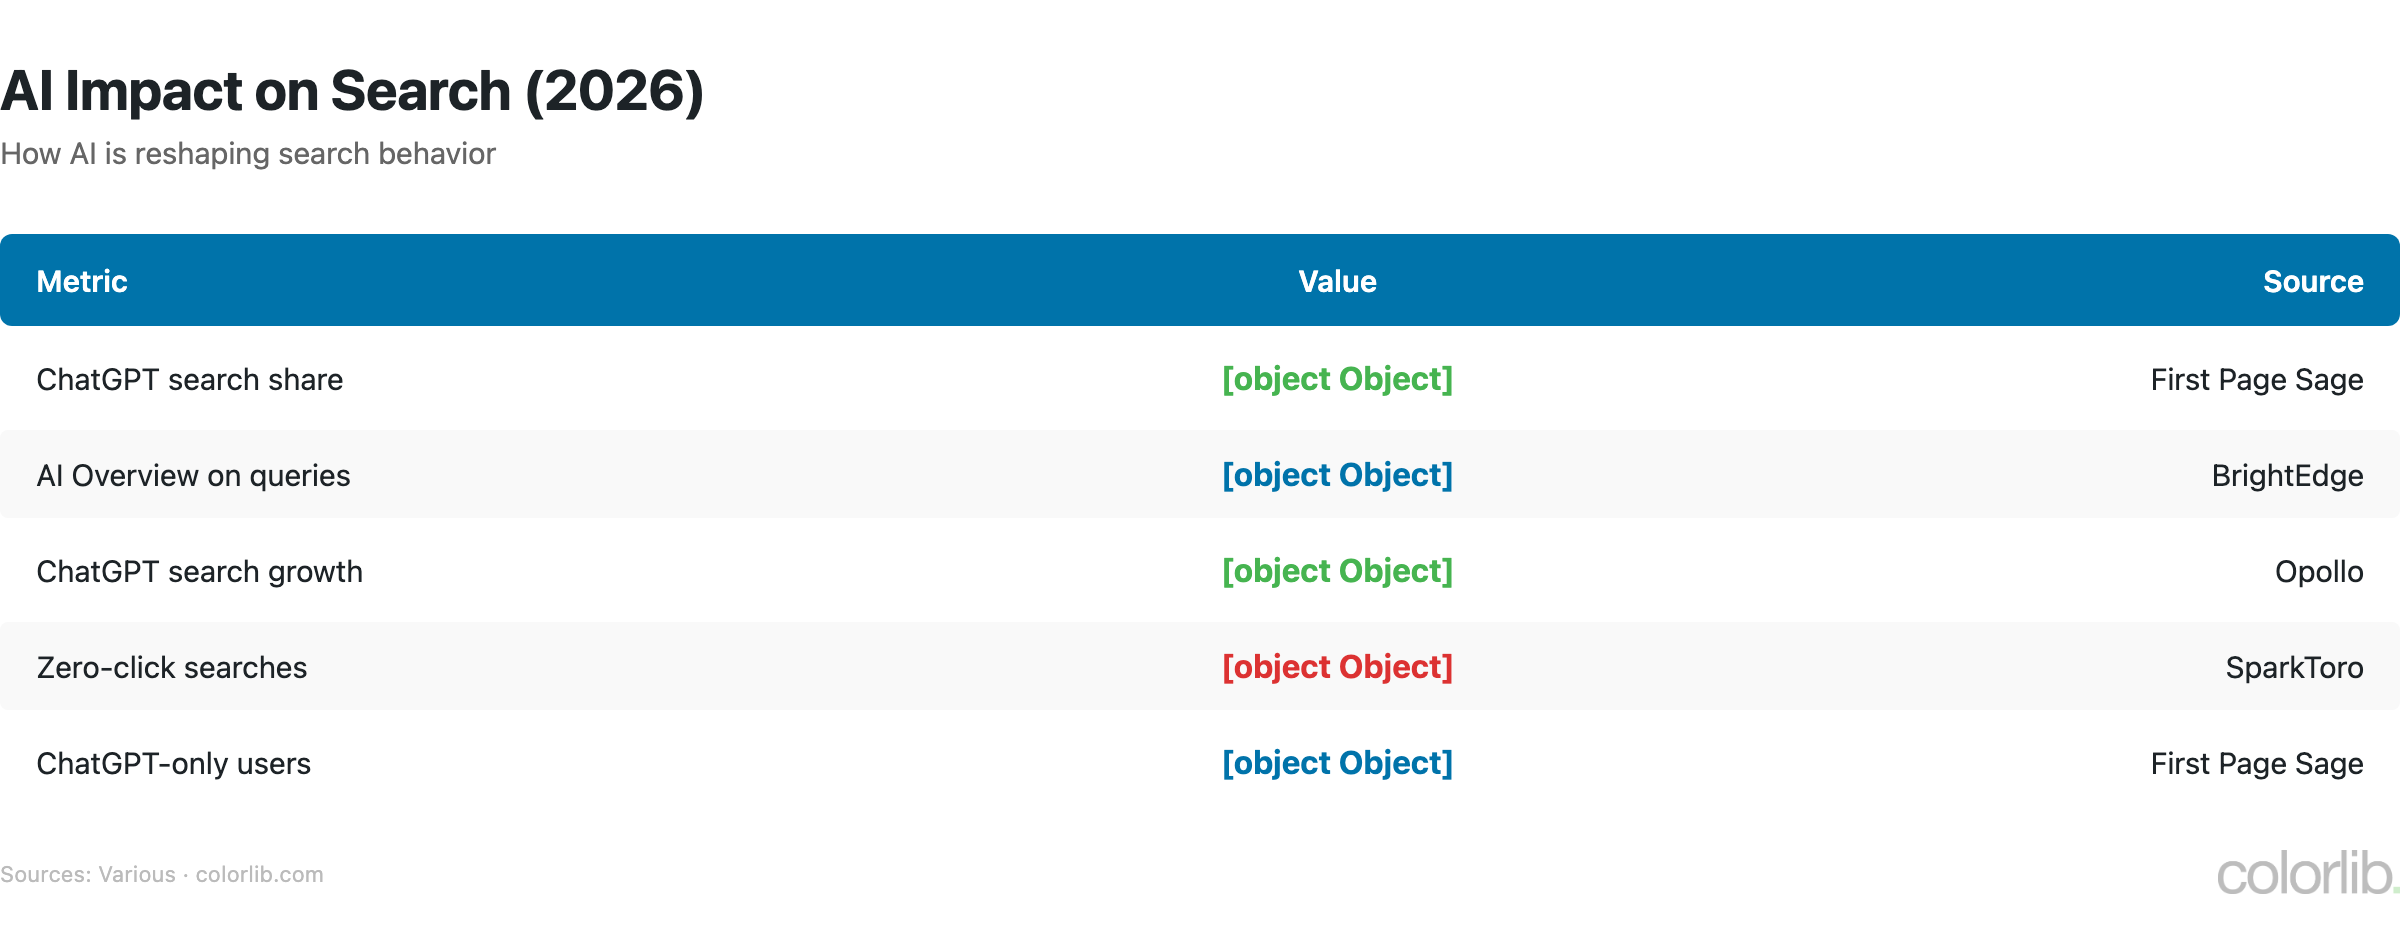
AI & Zero-Click Search Statistics
| Metric | Value | Source |
|---|---|---|
| Zero-click searches | 58-62% | SparkToro |
| AI Overviews on queries | 25%+ | Search Engine Land |
| Bing Copilot usage | Growing rapidly | Microsoft IR |
| ChatGPT daily users | 100 million+ | OpenAI |
| Perplexity monthly users | 10 million+ | Perplexity |
| AI chatbot share of search queries | 2-3% (est.) | Industry estimates |
| Featured snippet clicks | 8.6% CTR | Ahrefs |
- 58-62% of Google searches result in zero clicks — users find answers directly on the SERP through knowledge panels, featured snippets, and AI Overviews
- AI Overviews now appear on 25%+ of Google queries, providing AI-generated summaries that reduce the need to click through to websites
- AI chatbots (ChatGPT, Perplexity, Claude) handle an estimated 2-3% of search-like queries, growing but not yet threatening Google’s dominance
- Featured snippets earn 8.6% of clicks — winning the snippet position can significantly increase organic traffic despite the zero-click trend
- The zero-click trend means SEO is shifting from “drive clicks” to “maximize SERP visibility” — brand awareness matters even without direct traffic
Bing & Alternative Search Engines
| Engine | Key Stat | Notable Feature |
|---|---|---|
| Bing | 3.3% global, 7.2% US | Copilot AI integration |
| DuckDuckGo | 0.6% global, 2.1% US | Privacy-first, no tracking |
| Yahoo | 1.1% global, 2.5% US | Powered by Bing results |
| Yandex | 1.8% global, 65% Russia | Dominant in Russia/CIS |
| Baidu | 0.8% global, 75% China | Dominant in China |
| Ecosia | 0.1% global | Plants trees with ad revenue |
| Brave Search | Growing | Independent index, privacy |
- Bing’s AI-powered Copilot integration has boosted engagement but hasn’t significantly moved market share — it remains at 3.3% globally
- DuckDuckGo’s growth has plateaued at 0.6% globally after years of steady gains, suggesting privacy alone isn’t enough to challenge Google
- Yandex (65% in Russia) and Baidu (75% in China) demonstrate that Google’s dominance is primarily a Western phenomenon
- New entrants like Brave Search (independent index) and Perplexity (AI-native search) represent the most innovative challengers
- For how search engines impact your website platform choice, see our CMS market share analysis
Key Takeaways
- Google’s monopoly remains unshaken. At 91.4% global market share and $307 billion in ad revenue, Google processes 8.5 billion searches daily — more than all competitors combined by a factor of 10x.
- Zero-click searches dominate. 58-62% of searches end without a website click, and AI Overviews on 25%+ of queries are accelerating this trend. Websites must optimize for SERP visibility, not just traditional clicks.
- AI is reshaping search, not replacing it. ChatGPT, Perplexity, and Bing Copilot handle 2-3% of search queries — growing but not yet threatening Google’s core business.
- Mobile is the primary search device. At 63%+ of Google traffic, mobile search drives the majority of queries, with voice search accounting for 50%+ of smartphone searches.
- Local search is enormous. 46% of searches have local intent, and “near me” queries have grown 500% since 2015 — local SEO is critical for any business with a physical presence.
- Search is becoming a $350B+ business. Alphabet’s total revenue reflects the immense value of search intent data, with Google Search alone generating more ad revenue than most media companies’ total revenue.
Sources
- StatCounter — Search Engine Market Share
- Alphabet Investor Relations / SEC Filings
- Internet Live Stats — Google Search Statistics
- SparkToro — Zero-Click Search Study
- Search Engine Land — AI Overviews Coverage
- Think with Google — Search Insights
- Backlinko — Google Click-Through Rate Statistics
Frequently Asked Questions
How many Google searches per day?
Google processes approximately 8.5 billion searches per day, which translates to roughly 99,000 searches per second and 3.1 trillion+ searches annually. This figure has grown steadily over the years — from 5.5 billion/day in 2015 to 8.5 billion in 2026. Of these, 15% are queries Google has never seen before.
What is Google’s market share?
Google holds 91.4% of the global search market and 87.7% in the United States. The next largest competitors are Bing (3.3%), Yandex (1.8%), Yahoo (1.1%), Baidu (0.8%), and DuckDuckGo (0.6%). Google’s dominance has remained remarkably stable despite AI chatbot competition and a 2024 DOJ antitrust ruling. For how this affects web publishing, see our SEO statistics roundup.
What are zero-click searches?
Zero-click searches are queries where the user finds their answer directly on Google’s results page without clicking through to any website. This includes knowledge panels, featured snippets, AI Overviews, calculator results, weather, sports scores, and more. SparkToro research shows 58-62% of Google searches now end without a click, up from ~50% in 2020. This trend is accelerating as Google adds AI Overviews to 25%+ of queries.
Will AI replace Google search?
Not in the near term. AI chatbots (ChatGPT, Perplexity, Claude) currently handle an estimated 2-3% of search-like queries — significant but nowhere near threatening Google’s 91.4% market share. Google itself is integrating AI through AI Overviews and Gemini. The more likely outcome is that search evolves to blend traditional results with AI answers, rather than AI fully replacing search engines. For related digital trends, see our digital marketing statistics report.
Related Posts


Comments (0)