
60+ Digital Marketing Statistics & Trends (2026)
Global advertising revenue reached $1.14 trillion in 2025, Google still handles about 90% of searches, and 70% of marketing leaders get at least $10 back for every $1 they spend on email. Here are 60+ digital marketing statistics covering market size, SEO, email, social media, content marketing, video, and AI adoption for 2026.
Key Digital Marketing Statistics (2026)
- Global ad revenue: $1.14 trillion in 2025 (WPP Media)
- US internet ad revenue: nearly $300 billion in 2025, up 13.9% (IAB/PwC)
- Google’s share of worldwide search: 89.9% in September 2026 (StatCounter)
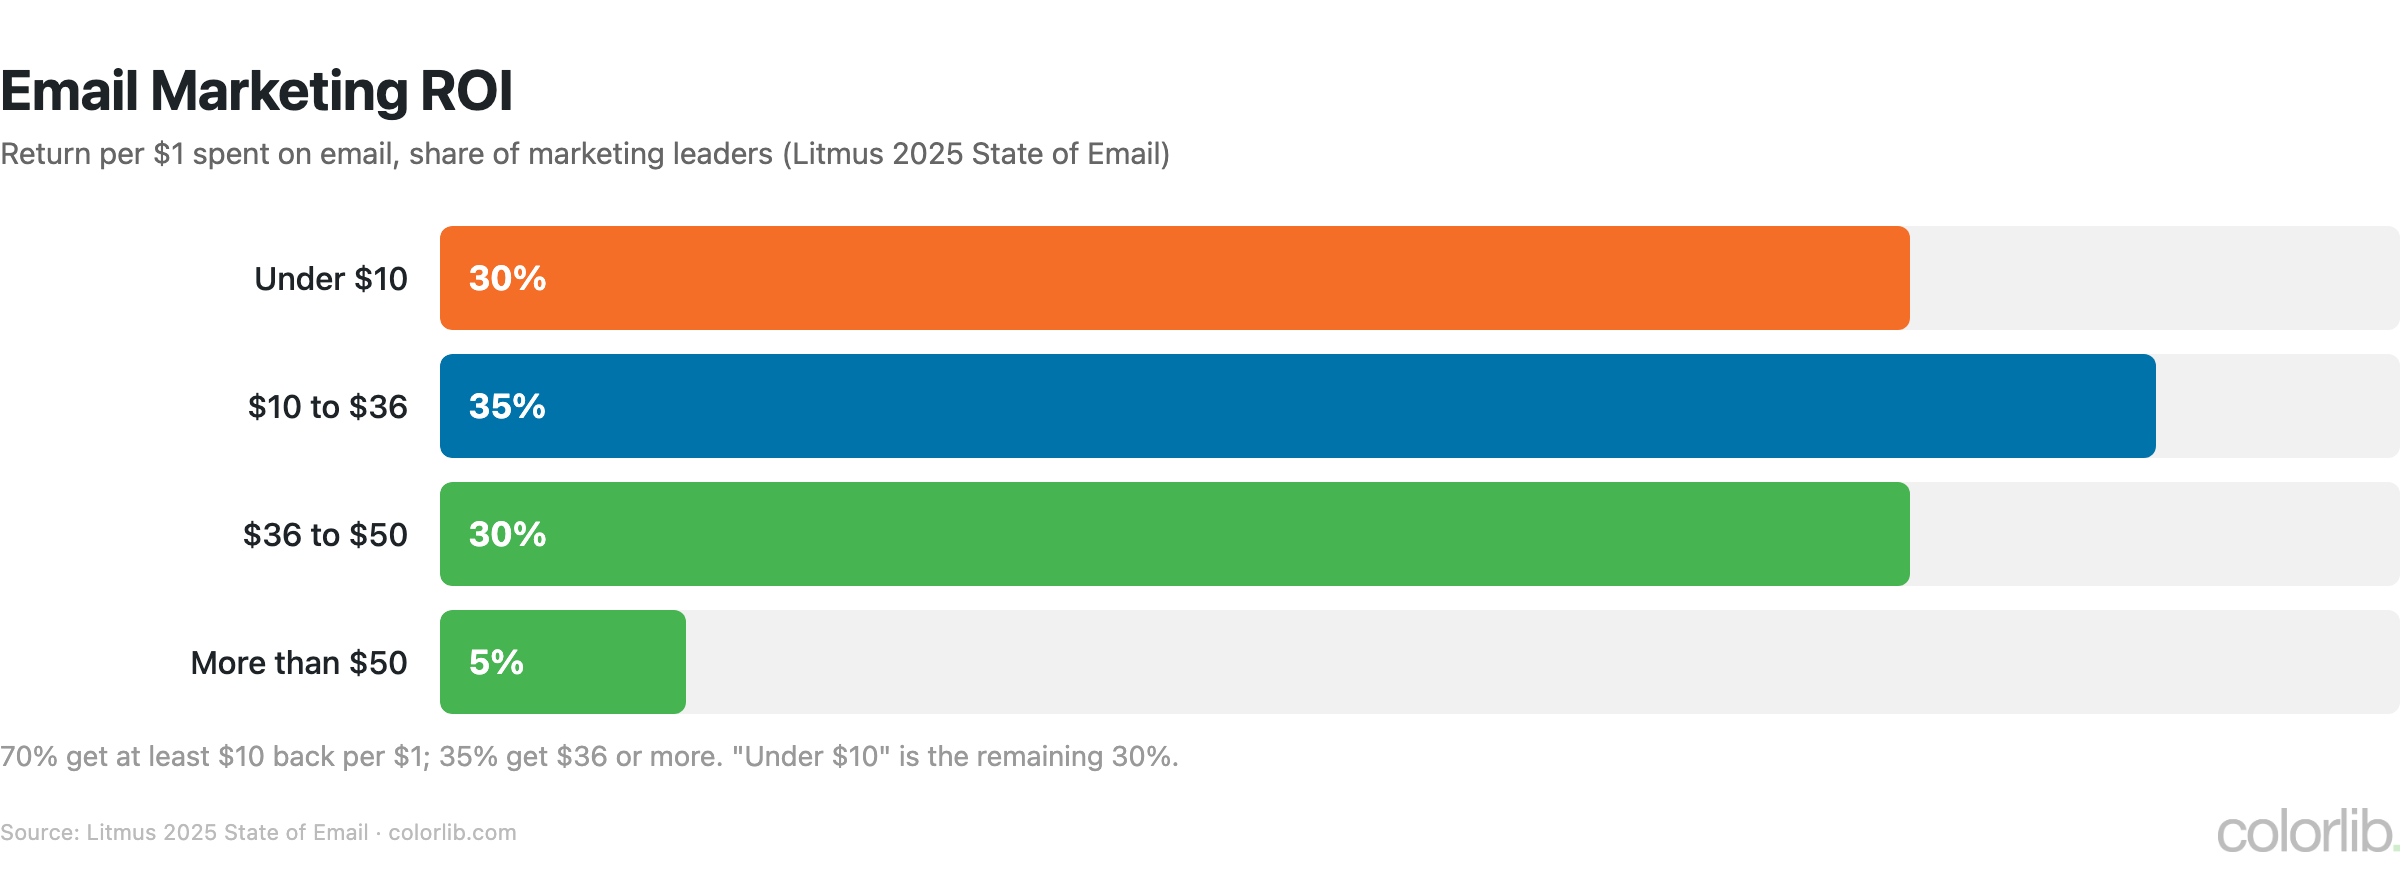
- Email ROI: 70% of marketing leaders get $10+ back per $1, and 35% get $36+ (Litmus)
- Social media ad spend: $339 billion projected for 2026 (Statista)
- 49% of marketers say short-form video delivers their best ROI (HubSpot)
- Mobile accounts for 59% of web traffic (StatCounter)
- 80% of marketers use AI for content creation (HubSpot)
Digital Marketing Market Size & Growth
| Metric | Value | Source |
|---|---|---|
| Global ad revenue (2025) | $1.14 trillion | WPP Media |
| Global ad revenue growth (2026 forecast) | 8.9% | WPP Media |
| Global ad spend (2026 forecast) | $1.25 trillion | Statista |
| Digital share of ad spend (2031 forecast) | 84.1% | Statista |
| US internet ad revenue (2025) | ~$300 billion | IAB/PwC |
| US internet ad revenue growth (2025) | 13.9% | IAB/PwC |
| Commerce (retail media) ad revenue (2025) | $178.2 billion | WPP Media |
| Search share of global ad revenue (2026) | 21.8% | WPP Media |
- Global ad revenue grew 8.8% to $1.14 trillion in 2025 (excluding US political ads), and WPP Media now expects 8.9% growth in 2026
- US internet advertising hit a record nearly $300 billion in 2025, the highest level in the IAB/PwC report’s 30-year history
- Commerce advertising, led by retail media, reached $178.2 billion in 2025 and passed total TV ad revenue for the first time
- Traditional and generative search will take 21.8% of global ad revenue in 2026, and generative search may be the fastest channel ever to reach $100 billion
- Statista forecasts that 84.1% of all ad spend will be digital by 2031
SEO Statistics
| Statistic | Value | Source |
|---|---|---|
| Organic search share of web traffic (2019 study) | 53% | BrightEdge |
| Google search market share (Sept 2026) | 89.9% | StatCounter |
| Bing search market share (Sept 2026) | 5.3% | StatCounter |
| Click-through rate for #1 organic result | 27.6% | Backlinko |
| Pages with zero organic traffic | 96.55% | Ahrefs |
| Google searches showing an AI summary (March 2025) | 18% | Pew Research |
| Click rate on results: with vs without AI summary | 8% vs 15% | Pew Research |
| Marketers optimizing for traditional and AI search | 92% | HubSpot |
- The #1 organic result is 10x more likely to be clicked than the #10 result (Backlinko)
- About one in five Google searches (18%) produced an AI summary in March 2025, and users clicked a traditional result in only 8% of those visits, versus 15% without one (Pew Research)
- Only 1% of visits to pages with an AI summary included a click on a link inside the summary (Pew Research)
- Users ended their browsing session after 26% of searches with an AI summary, against 16% without (Pew Research)
- 92% of marketers plan to or already optimize for both traditional and AI-powered search, and 24% are exploring a rework of their SEO strategy for generative AI (HubSpot)
Email Marketing Statistics
| Metric | Value | Source |
|---|---|---|
| Email marketing ROI | 35% get $10-$36 per $1; 35% get $36+ | Litmus 2025 |
| Average open rate (all industries) | 35.63% | Mailchimp |
| Average click rate | 2.62% | Mailchimp |
| Average unsubscribe rate | 0.22% | Mailchimp |
| Email conversion rate (B2C / B2B) | 2.8% / 2.4% | HubSpot / FirstPageSage |
- Returns are spread widely: 30% of marketing leaders get $36-$50 per $1 spent on email, and 5% get more than $50 (Litmus)
- Mailchimp’s all-industry averages are a 35.63% open rate and a 2.62% click rate (Mailchimp). Because Apple Mail Privacy Protection pre-loads emails, many marketers treat clicks as the more reliable benchmark
- Email converts at 2.8% for B2C brands and 2.4% for B2B (HubSpot)
Social Media Marketing Statistics
| Platform / Metric | Value | Source |
|---|---|---|
| Global social media ad spend (2026 forecast) | $339 billion | Statista |
| Social media user identities (April 2026) | 5.79 billion | DataReportal |
| Average time on social media | 18h 36m per week | DataReportal |
| Instagram average brand engagement rate (2025) | 0.48% | Socialinsider |
| TikTok average brand engagement rate (2025) | 3.70% | Socialinsider |
| Facebook average brand engagement rate (2025) | 0.15% | Socialinsider |
| Social commerce sales (US, 2025) | $85+ billion | eMarketer |
| Influencer marketing market size (2025) | $32.55 billion | Influencer Marketing Hub |
- Instagram is the platform marketers use most (70%), followed by Facebook (69.6%), TikTok (57%) and LinkedIn (42%) (HubSpot)
- Short-form video delivers the best ROI for 49% of marketers, ahead of long-form video (29%) and live streaming (25%) (HubSpot)
- TikTok’s 3.70% brand engagement rate is more than 7 times Instagram’s (0.48%) and nearly 25 times Facebook’s (0.15%) (Socialinsider)
- Shares per post grew 45% on TikTok in 2025, while comments fell 24%, a shift toward private sharing (Socialinsider)
- 43% of marketers rank Facebook among their highest-ROI social platforms (HubSpot)
Content Marketing Statistics
| Metric | Value | Source |
|---|---|---|
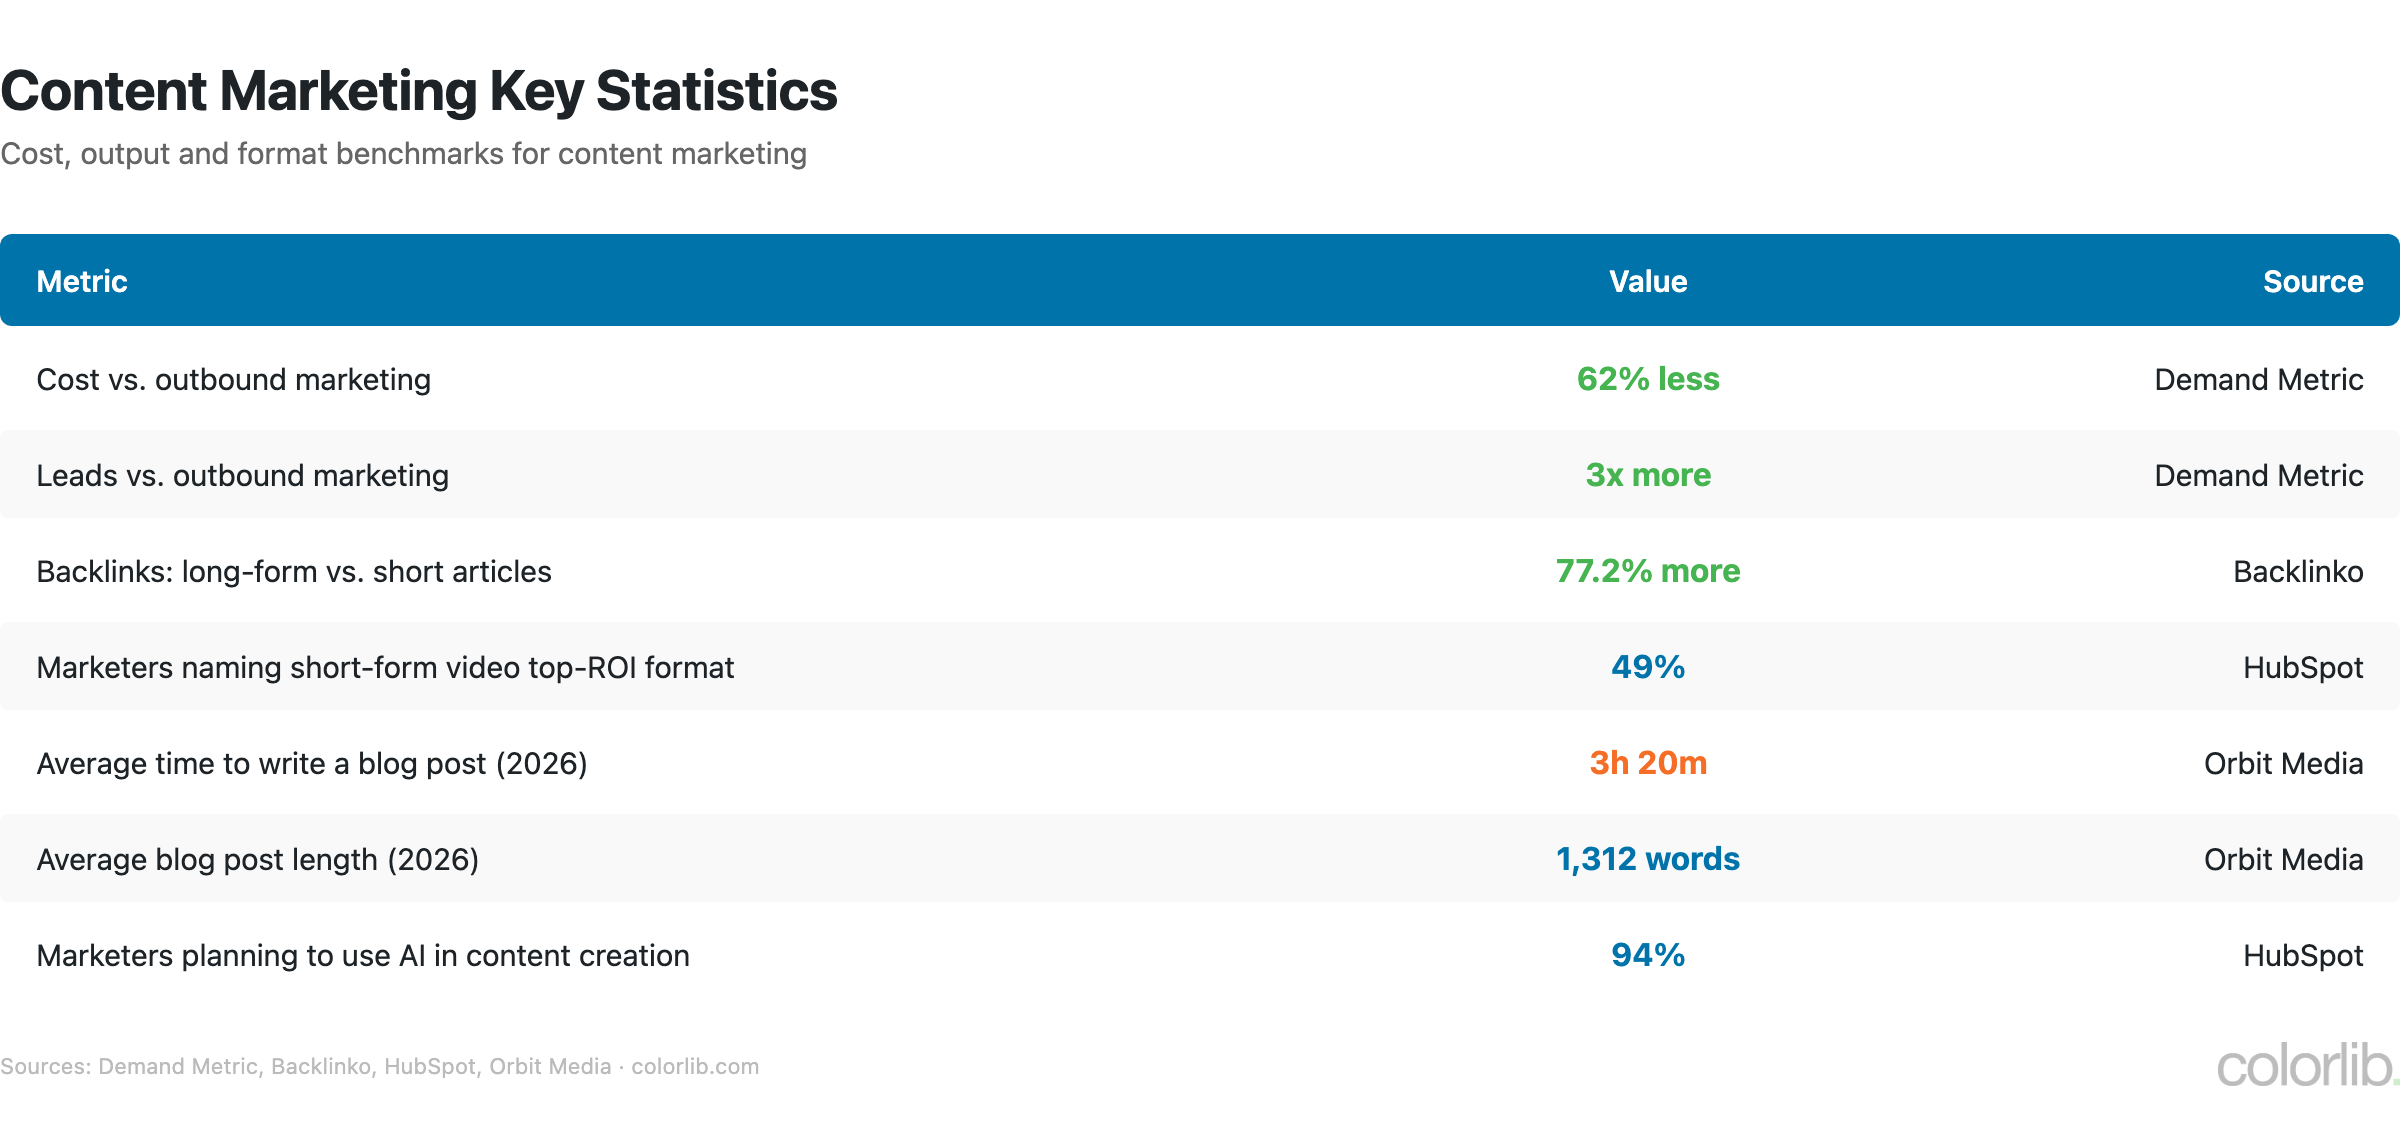
| Content marketing cost vs. outbound | 62% less | Demand Metric |
| Content marketing leads vs. outbound | 3x more | Demand Metric |
| Marketers naming short-form video as top-ROI format | 49% | HubSpot |
| Blog posts published daily | 7.5 million | Internet Live Stats |
| Long-form content backlink advantage | 77.2% more backlinks | Backlinko |
| Average time to write a blog post (2026) | 3h 20m | Orbit Media |
| Average blog post length (2026) | 1,312 words | Orbit Media |
- The average blog post now takes 3 hours 20 minutes to write, down from a peak of 4 hours 10 minutes in 2022 (Orbit Media)
- Average post length fell to 1,312 words in 2026, from a peak of 1,427 in 2023 (Orbit Media)
- Long-form articles earn 77.2% more backlinks than short articles (Backlinko)
- 94% of marketers plan to use AI in their content creation process (HubSpot)
AI in Marketing Statistics
| Metric | Value | Source |
|---|---|---|
| Marketers using AI for content creation | 80% | HubSpot |
| Marketers using AI for media production | 75% | HubSpot |
| Marketers planning to use AI in content creation | 94% | HubSpot |
| Generative AI users worldwide (April 2026) | 2.42 billion | DataReportal |
| Generative AI user growth (YoY) | +141% | DataReportal |
| Meta Advantage+ AI campaigns annual run rate (Q2 2026) | $75+ billion | Meta |
| Businesses using Meta’s gen AI ad creative tools | 9 million+ | Meta |
| Marketers satisfied with how they use data for personalization | 1 in 4 | Salesforce |
- 80% of marketers already use AI for content creation, and 94% plan to build it into their content process (HubSpot)
- Generative AI reached 2.42 billion users in April 2026, up 141% in a year, and is changing how people discover brands (DataReportal)
- More than 9 million small businesses use Meta’s generative AI ad creative tools, and its AI-driven Advantage+ campaigns passed a $75 billion annual run rate in Q2 2026 (Meta)
- 83% of marketers recognize the shift toward personalized, two-way messaging, but only one in four are satisfied with how they use data to deliver it (Salesforce)
- AI summaries in Google cut clicks on traditional results from 15% to 8% of visits, which is pushing marketers to optimize for AI answers too (Pew Research)
Key Takeaways
- Advertising is past $1.1 trillion. Global ad revenue reached $1.14 trillion in 2025, and Statista expects 84.1% of ad spend to be digital by 2031.
- SEO still matters, but AI is cutting clicks. Google holds about 90% of search, yet AI summaries cut clicks on traditional results from 15% to 8% of visits. Adapt or lose visibility.
- Email still pays. 70% of marketing leaders get at least $10 back per $1, and 35% get $36 or more. No channel comes close for owned-audience monetization.
- Short-form video wins on ROI. 49% of marketers say it delivers their best return, and TikTok’s engagement rate is more than 7 times Instagram’s.
- AI is reshaping every channel. 80% of marketers use AI for content creation. Marketers who resist AI tools will fall behind on both speed and personalization.
- Content quality beats quantity. Long-form content earns 77.2% more backlinks, while 96.55% of pages get no Google traffic at all.
Sources
- WPP Media — This Year Next Year
- IAB/PwC — Internet Advertising Revenue Report, Full Year 2025
- Statista — Advertising Market Outlook
- StatCounter — Search Engine Market Share
- Pew Research — Google AI Summaries and Clicks
- Litmus — State of Email
- Mailchimp — Email Marketing Benchmarks
- HubSpot — Marketing Statistics
- Socialinsider — 2026 Social Media Benchmarks
- DataReportal — Global Social Media Statistics
- Orbit Media — Blogging Statistics
- Salesforce — State of Marketing
Frequently Asked Questions
How much do businesses spend on digital marketing?
Global advertising revenue reached $1.14 trillion in 2025, according to WPP Media, and Statista expects 84.1% of all ad spend to be digital by 2031. In the US, internet advertising revenue hit nearly $300 billion in 2025, up 13.9% (IAB/PwC). For more context on how this compares to total advertising, see our advertising statistics.
What is the most effective digital marketing channel?
It depends on the goal. For long-term ROI, SEO still drives a large share of website traffic at no per-click cost, though AI summaries are reducing clicks. For owned-audience ROI, email marketing returns at least $10 per $1 for 70% of marketing leaders. For engagement, short-form video is the format 49% of marketers say delivers their best ROI. Most successful strategies combine multiple channels.
How is AI changing digital marketing?
80% of marketers now use AI for content creation and 75% use it for media production, while 94% plan to build it into their content process (HubSpot). On the ad side, Meta’s AI-driven Advantage+ campaigns passed a $75 billion annual run rate in Q2 2026. AI is also changing search: Pew found that Google users click traditional results in 8% of visits with an AI summary, against 15% without one.
Is email marketing still effective in 2026?
Yes. In Litmus’s 2025 State of Email survey, 70% of marketing leaders reported at least $10 back for every $1 spent on email, and 35% reported $36 or more. Email converts at 2.8% for B2C brands and 2.4% for B2B. Check our lead generation statistics for more on how email drives conversions.
For more data on the marketing landscape, explore our advertising statistics, online shopping statistics, and lead generation statistics.

Related Posts





Comments (0)