50+ Web Design Statistics Every Designer Should Know (2026)
Last updated: March 2026
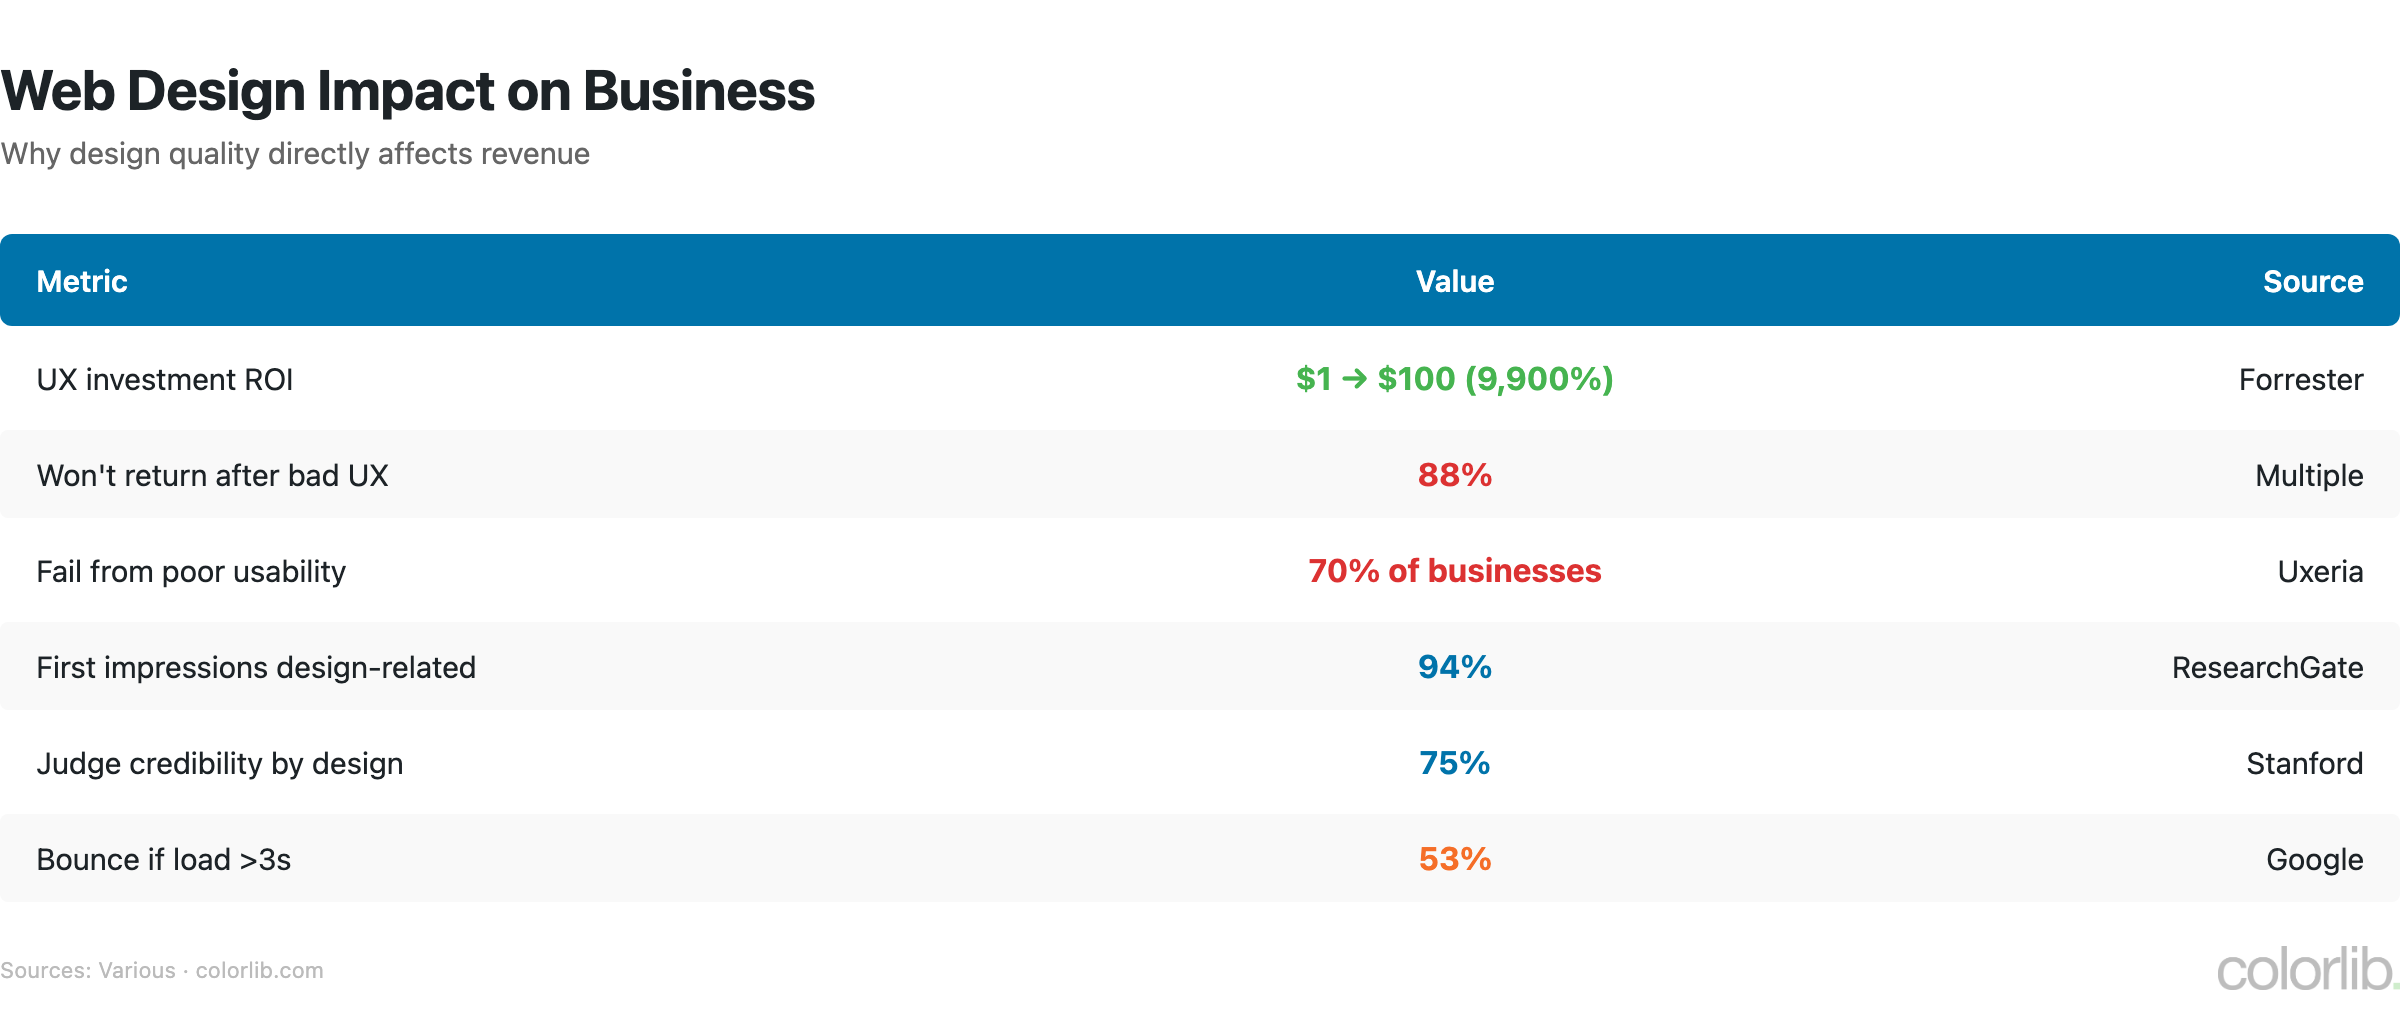
First impressions are 94% design-related, 75% of a website’s credibility comes from its design, and 53% of visitors leave if a page takes more than 3 seconds to load. Here are 90+ web design statistics covering industry size, UX/UI, mobile design, performance, salaries, and trends for 2026.
Key Web Design Statistics (2026)
- Web design services market: $40+ billion globally (IBISWorld)
- ~200,000 web designers employed in the US (BLS)
- 94% of first impressions are design-related (BCS/HCI Research)
- 88% of users won’t return after a bad UX experience (Toptal/Forrester)
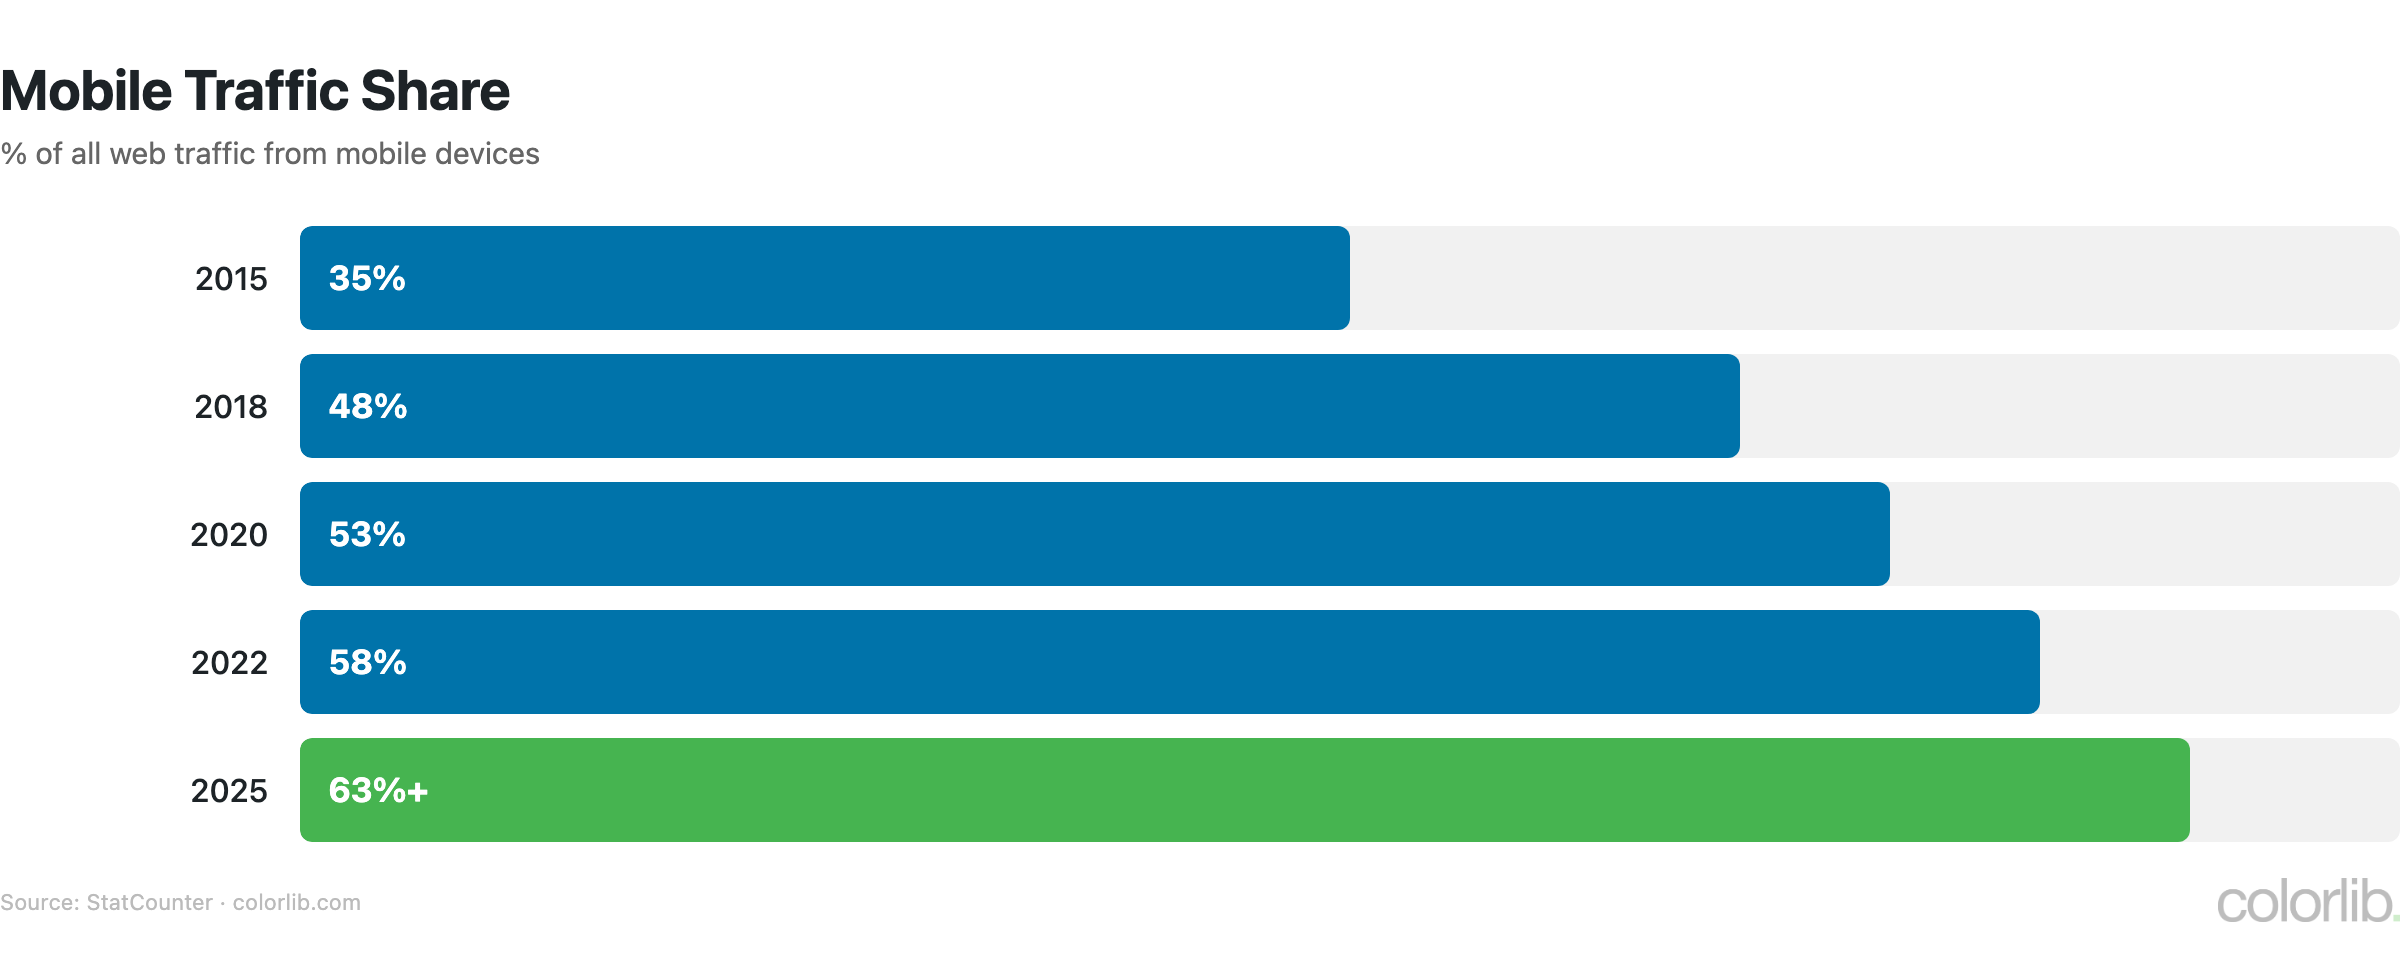
- 60%+ of web traffic is mobile (StatCounter)
- 75% of a website’s credibility comes from design (Stanford/BCS)
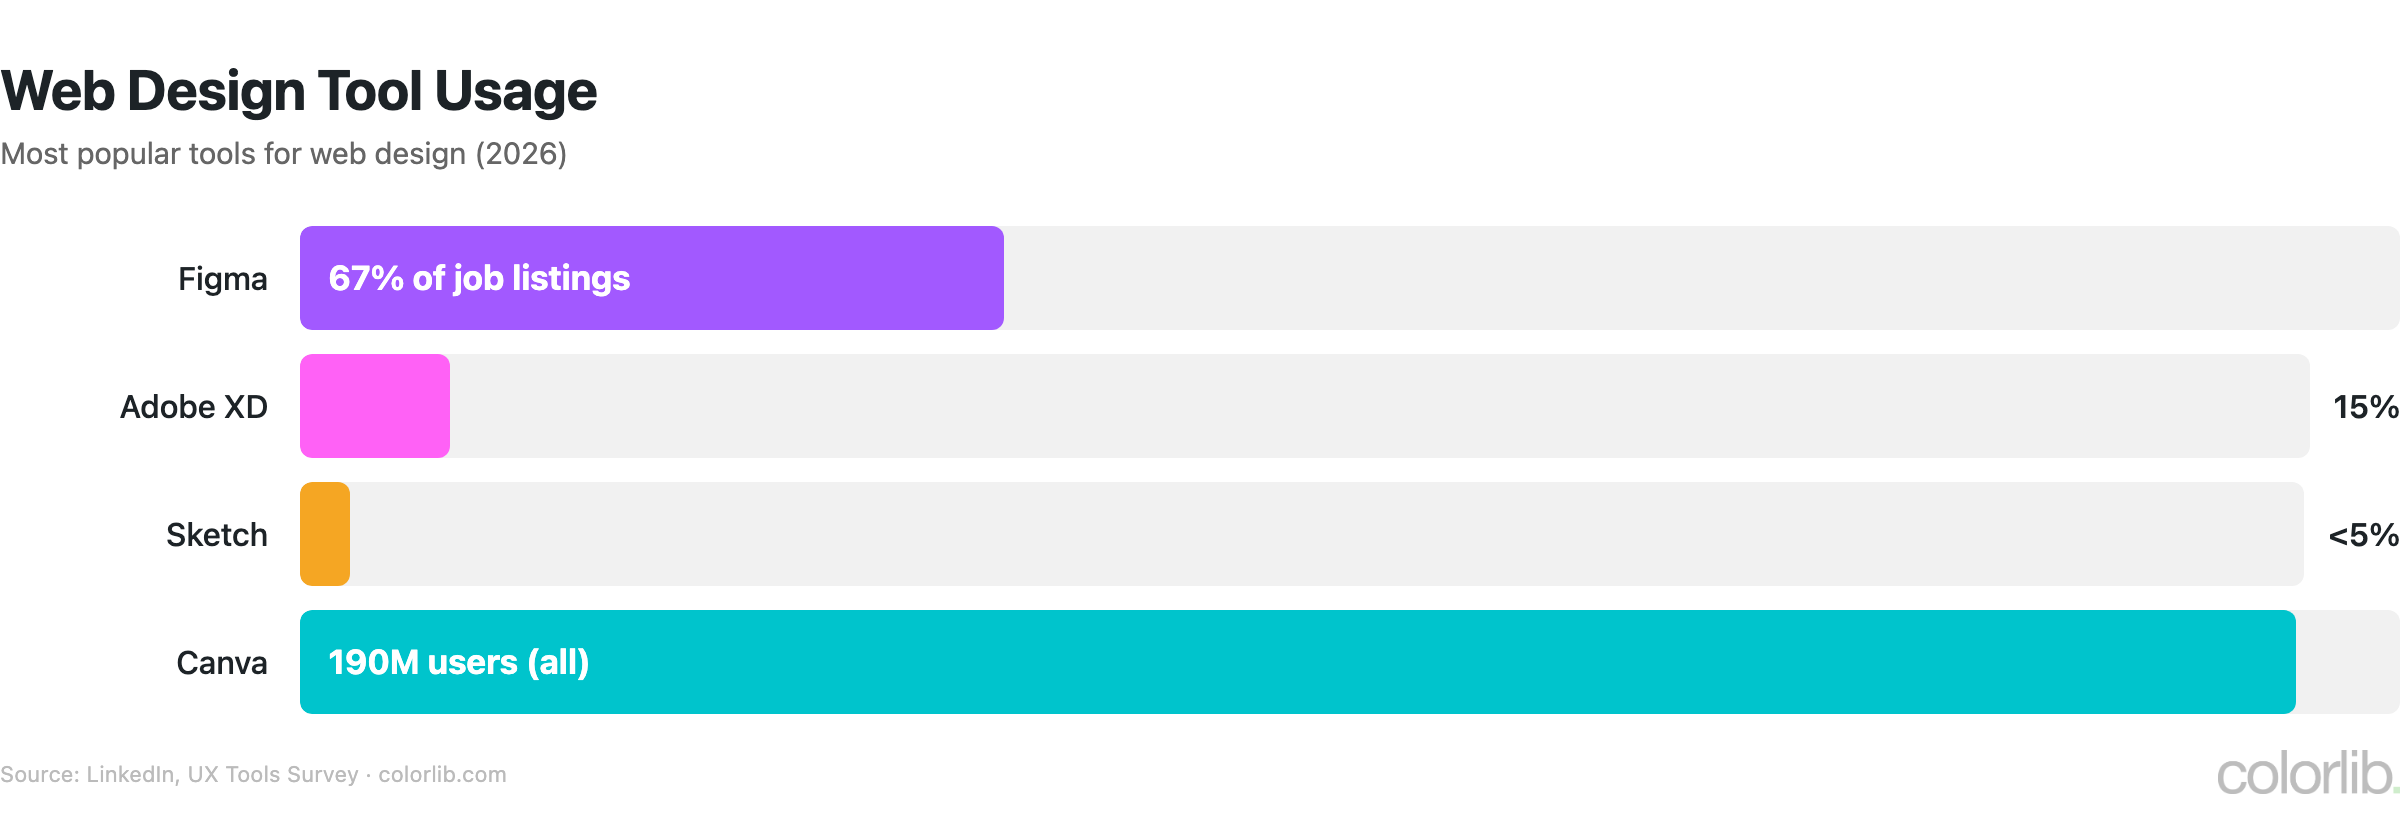
- Figma required in 67% of design job listings (UX Tools)
Web Design Industry Size & Workforce
| Metric | Value | Source |
|---|---|---|
| Global web design market | $40+ billion | IBISWorld |
| US market size | $11 billion | IBISWorld |
| US web designers employed | ~200,000 | BLS |
| Median salary (graphic/web designers) | $58,910 | BLS |
| UX Designer median salary | $95,000-$115,000 | Glassdoor |
| Freelance designers | 35% of the workforce | Upwork |
| Average freelance rate | $50-$100/hour | AIGA Census |
| Websites on the internet | 1.1 billion+ (200M active) | Internet Live Stats |
- The average website costs $5,000-$10,000 for a small business; custom enterprise sites run $50,000-$500,000+
- Website builder platforms (Wix, Squarespace, etc.) serve 20%+ of all new websites, disrupting traditional design agencies
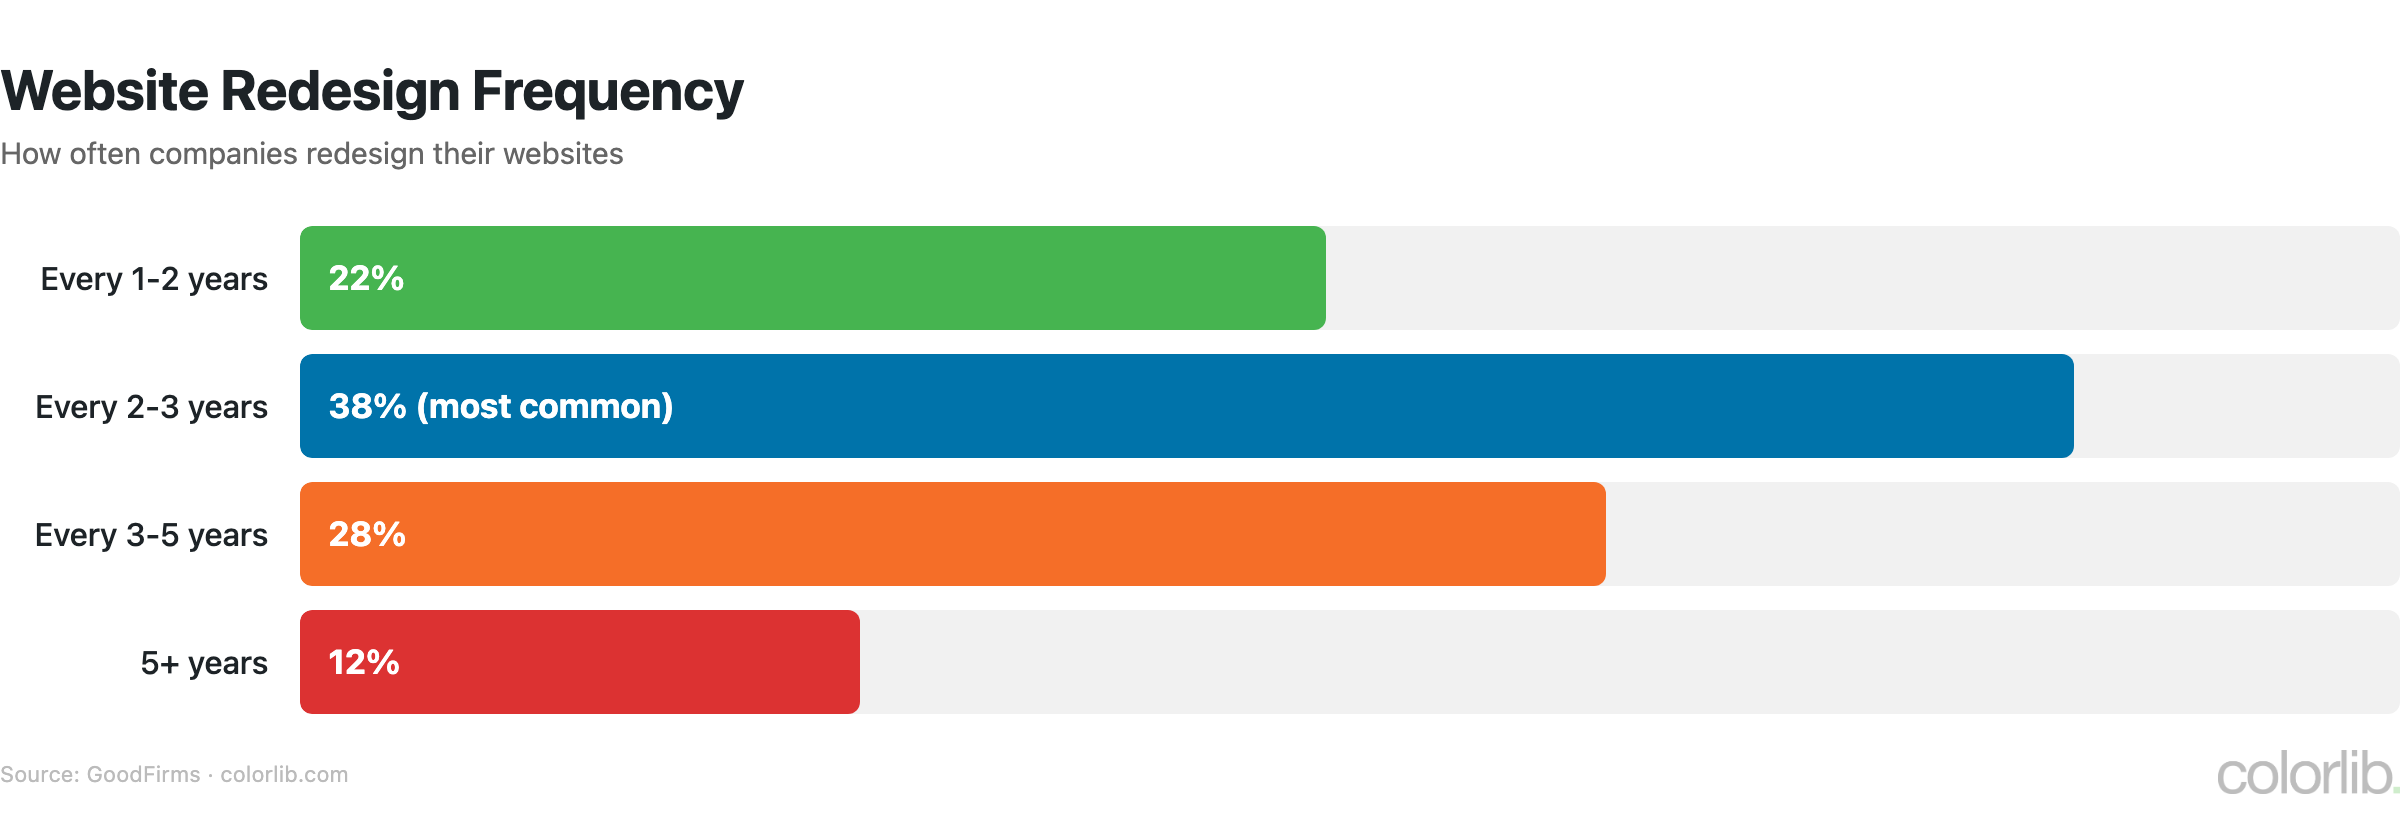
- Average website lifespan before redesign: 2-3 years — down from 3-5 years a decade ago
- Design agencies report 15-25% profit margins, with recurring maintenance contracts growing as a revenue stream
- 46% of small businesses still don’t have a website (Top10)
UX/UI Design Statistics
| Statistic | Value | Source |
|---|---|---|
| First impressions that are design-related | 94% | BCS/HCI Research |
| Users who won’t return after bad UX | 88% | Forrester |
| ROI of UX investment | $1 = $100 return | Forrester |
| Credibility from design | 75% | Stanford Web Credibility |
| Time to form first impression | 0.05 seconds | Behaviour & IT |
| Users who judge by visual design first | 38% look at layout/nav | Nielsen Norman Group |
| Conversion lift from good UX | 200-400% | Forrester |
| Companies investing in UX | 73% plan to increase budget | UX Design Institute |
- 70% of online businesses fail due to poor usability (UX Design Institute)
- Clear calls-to-action improve conversion by 120%+
- Users spend 5.94 seconds looking at a website’s main image (EyeQuant research)
- 85% of adults expect a mobile website to be as good or better than the desktop version
- White space around text increases comprehension by 20% (Nielsen Norman Group)
- Only 55% of companies conduct UX testing — those that do see 2x higher customer satisfaction
Mobile & Responsive Design Statistics
| Metric | Value | Source |
|---|---|---|
| Mobile share of web traffic | 60%+ | StatCounter |
| Google mobile-first indexing | 100% of new sites | |
| Sites with responsive design | 85%+ | HTTP Archive |
| Mobile conversion rates | 2.2% vs. 4.4% desktop | Statista |
| Mobile bounce rate | 51% (vs. 41% desktop) | Semrush |
| Average mobile page weight | 2.2 MB | HTTP Archive |
| Thumb-zone compliance | Only 40% of sites optimize | Smashing Magazine |
- 74% of users are more likely to return to a mobile-friendly site
- Mobile ecommerce accounts for 73% of total ecommerce sales worldwide
- Average mobile session duration: 2.5 minutes vs. 6 minutes on desktop
- Progressive Web Apps (PWAs) increase engagement by 68% on average vs. mobile websites
- 61% of users will never return to a site they had trouble accessing on mobile
Website Performance & Speed Impact
| Metric | Value | Source |
|---|---|---|
| Bounce if load time >3s | 53% | |
| Revenue impact of 1s delay | -7% conversions | Akamai |
| Sites passing Core Web Vitals | ~50% | HTTP Archive |
| Avg desktop page load time | 2.5 seconds | HTTP Archive |
| Avg mobile page load time | 8.6 seconds | |
| Avg page weight (desktop) | 2.5 MB | HTTP Archive |
| Images as % of page weight | 50%+ | HTTP Archive |
| CDN adoption | 73% of top 1M sites | W3Techs |
- Amazon found every 100ms of latency cost them 1% in sales
- Pinterest reduced load times by 40% and saw 15% increase in sign-ups
- Google uses page speed as a ranking factor for both mobile and desktop since 2021
- AVIF/WebP image format adoption: 30%+ of top sites now serve next-gen images
- Lazy loading images can reduce initial page weight by 30-50%
Web Design Trends & Tools (2025-2026)
| Trend / Tool | Adoption | Source |
|---|---|---|
| Figma | 67% of job listings | UX Tools |
| Dark mode design | 82% of users prefer option | Android Authority |
| AI-generated layouts | 28% of designers use | AIGA |
| Micro-animations | 45% of new sites | Awwwards |
| Minimalist design preference | 38% of client requests | 99designs |
| 3D elements in web design | +35% growth | Dribbble |
| Accessibility-first design | Required in 40%+ of briefs | W3C WAI |
| Variable fonts | +200% adoption | Google Fonts |
- Websites with accessibility compliance see 12% higher engagement and avoid $50K+ ADA lawsuit risk
- 96.3% of homepages have WCAG failures — most common: low contrast text (WebAIM)
- AI design tools (Midjourney, DALL-E) used by 40% of designers for mood boards and concepts
- No-code/low-code platforms power 30% of new websites — expected to reach 65% by 2030
Key Takeaways
- Design is a business driver. With 94% of first impressions design-related and every $1 in UX returning $100, web design is an investment, not a cost.
- Mobile-first is non-negotiable. Over 60% of traffic is mobile, yet mobile conversion rates lag desktop by 50%. Closing that gap is the biggest opportunity.
- Speed kills (or converts). 53% bounce after 3 seconds. Amazon loses 1% of sales per 100ms delay. Performance is design.
- Figma won the tools war. Required in 67% of job listings, Figma dominates collaborative design while Sketch fell below 5%.
- Accessibility is now mandatory. 96.3% of sites fail WCAG, but accessibility-first design is required in 40%+ of client briefs — driven by regulation and user demand.
- Redesign cycles are shortening. Average website lifespan dropped to 2-3 years, creating recurring revenue for designers and agencies.
Sources
- Bureau of Labor Statistics — Graphic Designers / Web Designers
- IBISWorld — Web Design Services
- Forrester — UX ROI Research
- Stanford Web Credibility Research
- StatCounter — Platform Market Share
- HTTP Archive — Web Almanac
- WebAIM — Million Report
- Google — Think with Google
- UX Tools — Design Tools Survey 2024
- Nielsen Norman Group
Frequently Asked Questions
How many web designers are there in the US?
There are approximately 200,000 web designers in the US (BLS, categorized under graphic designers and digital designers). If you include UX/UI designers and front-end designers, the number exceeds 350,000. Globally, the web design services market employs millions across agencies, freelancers, and in-house teams.
What is the average web designer salary?
The BLS median for graphic/web designers is $58,910. UX designers earn significantly more at $95,000-$115,000. Creative directors earn a median of $138,000. Freelance web designers charge $50-$100/hour, with specialists in UX and ecommerce design charging $100-$200+/hour. For more on design careers, see our graphic design statistics.
Why is mobile-first design important?
Over 60% of web traffic comes from mobile devices, and Google uses mobile-first indexing for 100% of new sites. Mobile users are also less patient: 53% leave if a page takes more than 3 seconds to load. Despite this, mobile conversion rates (2.2%) are half of desktop (4.4%), meaning mobile optimization remains a massive conversion opportunity.
How often should you redesign a website?
The average website lifespan before redesign is 2-3 years, down from 3-5 years a decade ago. Design trends, performance standards, and user expectations evolve rapidly. Signs you need a redesign: failing Core Web Vitals, bounce rates above 60%, non-responsive design, or conversion rates declining. Regular content and UX updates between full redesigns extend a site’s effectiveness. Check our website color statistics for design inspiration.
Looking for design inspiration? Browse our developer portfolio examples, explore graphic design statistics, or check our website color statistics.
Related Posts


Comments (0)