Best JavaScript Map Libraries: 7 Options for Interactive Maps
Last updated: March 2026
8 Best JavaScript Map Libraries for Interactive Web Maps in 2026
Interactive maps are a core feature of real estate platforms, delivery services, travel sites, data visualizations, and location-based applications. The JavaScript mapping ecosystem in 2026 ranges from lightweight marker-and-popup libraries to full 3D globe renderers with satellite imagery.
Your choice depends on three factors: whether you need 3D capabilities, whether you can use a commercial tile provider, and how much data you are rendering. This comparison covers the major options with real-world performance and pricing data. For industry context, see our web development statistics roundup.
Map Library Comparison
| Library | Free Tier | Tile Source | 3D Support | Markers / Clustering | Size (gzipped) |
|---|---|---|---|---|---|
| Leaflet | Fully open source | Any (OpenStreetMap default) | No (2D only) | Yes / via plugin | ~42 KB |
| Mapbox GL JS | 50K loads/mo free | Mapbox (proprietary) | Yes (3D terrain, buildings) | Yes / built-in | ~230 KB |
| Google Maps JS API | $200/mo credit (~28K loads) | Google (proprietary) | Yes (3D, Street View) | Yes / built-in | ~200 KB (loaded) |
| OpenLayers | Fully open source | Any (WMS, WMTS, XYZ) | Limited (2.5D) | Yes / built-in | ~170 KB (full) |
| D3.js (maps) | Fully open source | GeoJSON / TopoJSON | No (SVG/Canvas 2D) | Custom (programmatic) | ~90 KB (d3-geo ~15 KB) |
| Deck.gl | Fully open source | Any (pairs with Mapbox/MapLibre) | Yes (WebGL layers) | Custom (GPU-rendered) | ~300 KB |
| CesiumJS | Free (open source) + paid tiles | Cesium Ion / custom | Yes (full 3D globe) | Yes / built-in | ~500 KB+ |
| MapLibre GL JS | Fully open source | Any vector tiles | Yes (3D terrain, buildings) | Yes / built-in | ~220 KB |
1. Leaflet
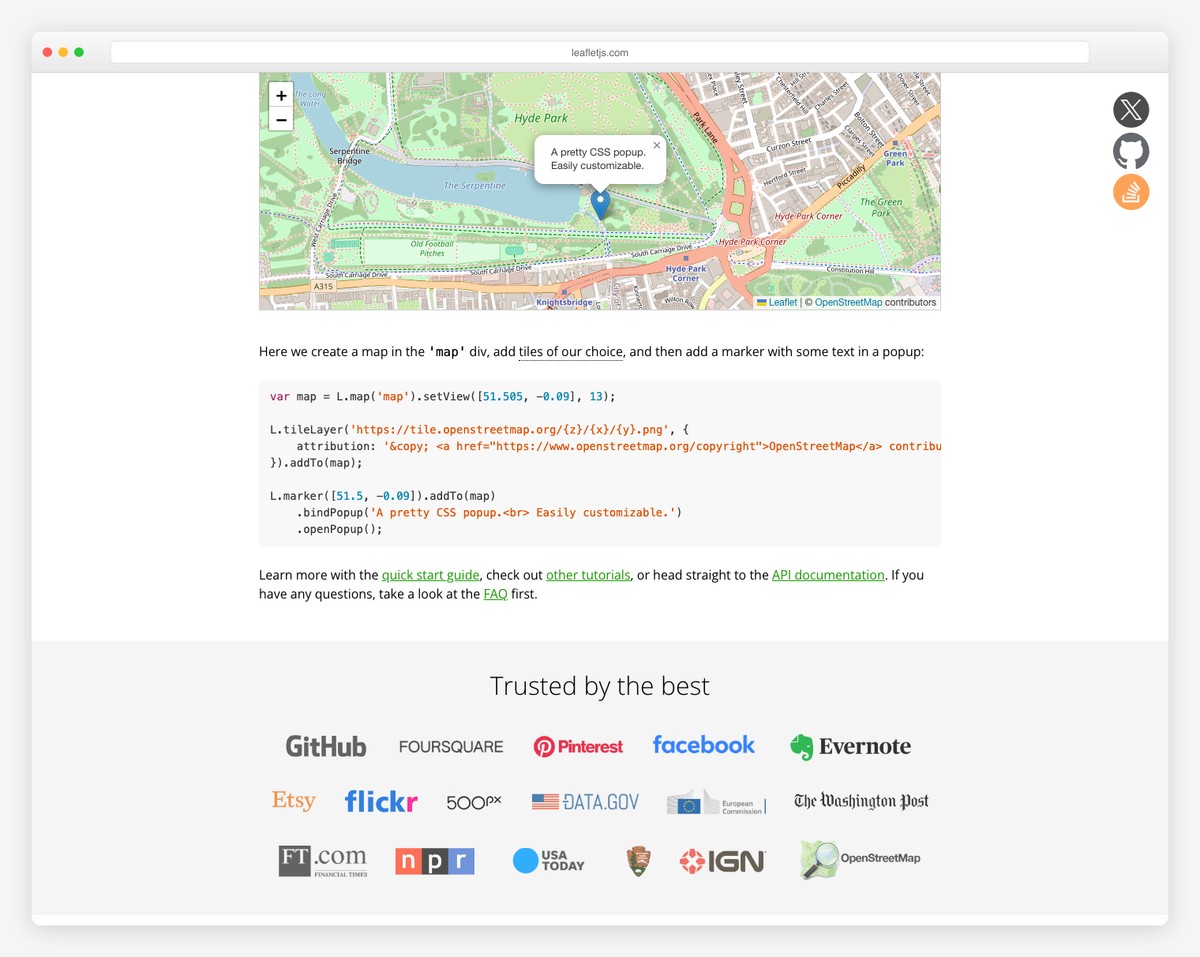
Leaflet is the most popular open-source mapping library and the default choice for projects that need interactive maps without vendor lock-in. At 42 KB gzipped, it provides tile layers, markers, popups, polylines, polygons, circles, zoom controls, and a rich event system. Leaflet works with any tile provider — OpenStreetMap, Mapbox, Stadia, Thunderforest, or your own tile server.
Leaflet’s plugin ecosystem is its superpower. Over 400 plugins add capabilities: marker clustering (Leaflet.markercluster), heatmaps (Leaflet.heat), drawing tools (Leaflet.draw), geocoding, routing, fullscreen, mini-maps, and dozens more. The API is clean and well-documented, making Leaflet the easiest mapping library to learn.
The limitation: Leaflet renders with DOM elements (HTML/SVG), not WebGL. For maps with thousands of markers or complex visualizations, Leaflet becomes slow. Marker clustering helps (grouping nearby markers into count indicators), but for true big-data mapping, you need a WebGL-based library like Mapbox GL JS or MapLibre.
| Strength | Weakness |
|---|---|
| Lightest full-featured map library (42 KB) | No 3D support |
| 400+ plugins for every use case | DOM rendering limits data density |
| Works with any tile provider | No vector tiles (raster only) |
| Easiest to learn, best documentation | Slow with 10,000+ markers |
2. Mapbox GL JS
Mapbox GL JS renders maps using WebGL, enabling smooth zooming, rotation, tilting, and 3D terrain visualization. Vector tiles allow style changes at runtime — you can switch from light to dark theme, highlight specific features, or filter data layers without reloading tiles. The visual quality of Mapbox maps is widely considered the best in the industry.
Mapbox provides a generous free tier (50,000 map loads per month) and a complete ecosystem: Mapbox Studio for visual map styling, geocoding APIs, directions/routing, static map images, and satellite imagery. The trade-off: Mapbox GL JS v2+ requires a Mapbox access token and can only be used with Mapbox-hosted tiles. You are locked into their ecosystem and pricing.
For projects where map visual quality and 3D terrain matter — real estate, outdoor recreation, urban planning — Mapbox is the premium choice. For projects that need an open-source Mapbox alternative, see MapLibre below.
3. Google Maps JavaScript API
Google Maps needs no introduction. It has the most complete geospatial dataset (street imagery, business listings, transit data, indoor maps), the best geocoding accuracy, and the strongest brand recognition with end users. If your users expect to see Google Maps (ride-sharing, delivery, local business directories), there is no substitute.
Google provides $200/month in free credit, which covers approximately 28,000 map loads. Beyond that, pricing is per-load. The API includes Street View, 3D buildings, drawing tools, heatmaps, places autocomplete, and directions with traffic. The JavaScript API loads asynchronously from Google’s CDN.
The downsides: cost at scale (high-traffic sites face significant bills), no self-hosting option, mandatory Google branding, and a heavier runtime footprint than open-source alternatives. For data visualization overlays, Google Maps is also less flexible than Deck.gl or D3.js.
4. OpenLayers
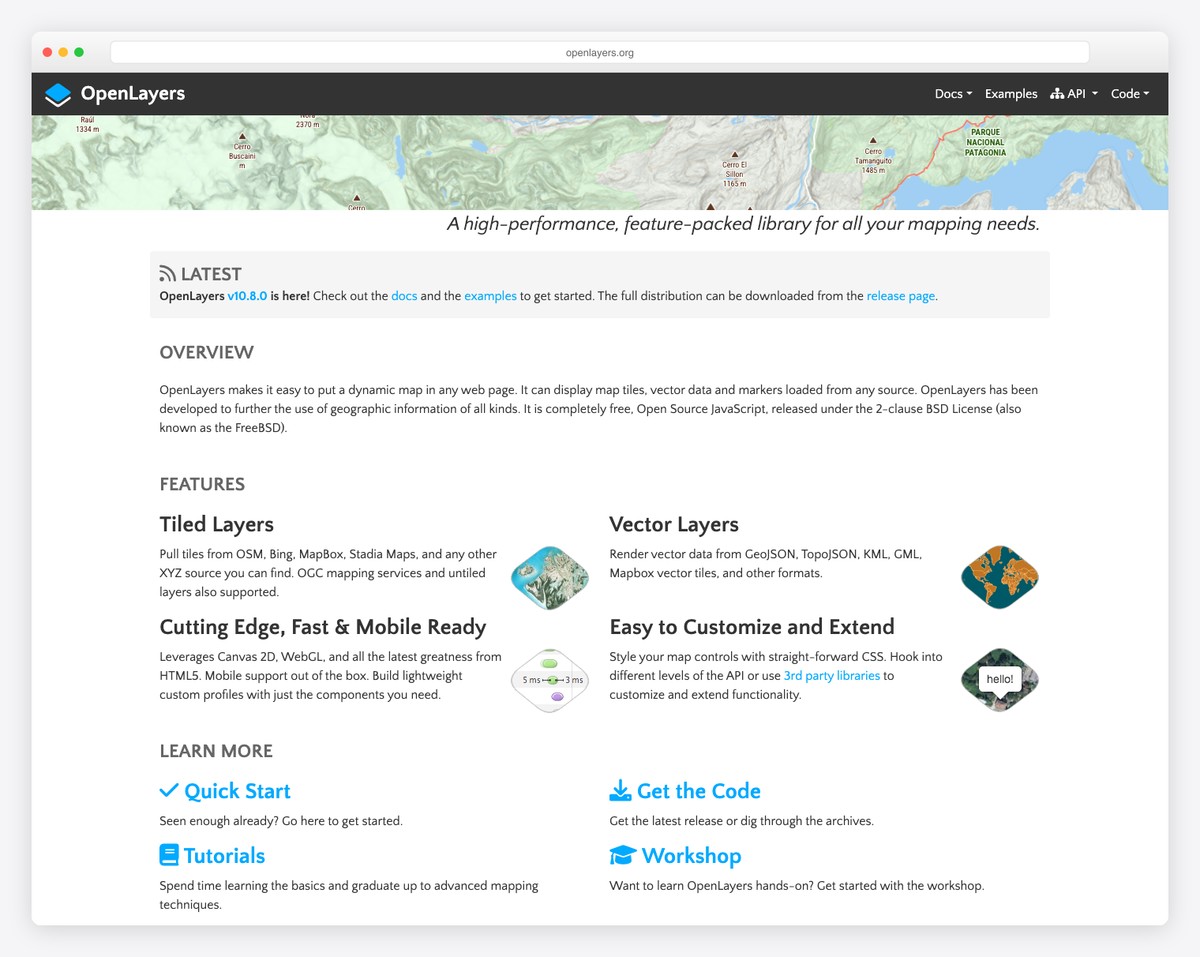
OpenLayers is the enterprise-grade open-source mapping library. It supports the widest range of geospatial data sources: WMS, WMTS, WFS, GeoJSON, TopoJSON, KML, GPX, and custom vector tile formats. If your project involves GIS data, OGC standards, or government geospatial services, OpenLayers handles formats that other libraries cannot.
OpenLayers renders with both Canvas and WebGL, supporting high-performance vector rendering for large datasets. Its API is more complex than Leaflet’s — it uses a layer/source/view architecture similar to desktop GIS software. The learning curve is steeper, but the capability ceiling is higher.
Choose OpenLayers for GIS-heavy applications, government/military mapping, and projects that consume enterprise geospatial services. Choose Leaflet or MapLibre for consumer-facing maps where simplicity matters more than GIS interoperability.
D3.js for Maps
D3.js is not a mapping library — it is a data visualization library that happens to have excellent geographic projection support. D3’s d3-geo module (15 KB) provides dozens of map projections (Mercator, Albers, Orthographic, etc.) and renders GeoJSON/TopoJSON data to SVG or Canvas. The result is fully custom cartographic visualizations where every element — colors, labels, interactions — is under your control.
D3 maps are ideal for choropleth maps (countries/states colored by data), custom projections, animated geographic visualizations, and infographic-style maps. They are not suitable for slippy maps (tile-based zoomable maps) — D3 renders a fixed viewport, not a scrollable tile grid. For interactive pan-and-zoom maps, use Leaflet or MapLibre with D3 overlays.
5. Deck.gl
Deck.gl is a WebGL-powered visualization framework for large-scale geospatial data. It renders millions of data points as layers on top of a base map (Mapbox, MapLibre, or Google Maps). Layer types include scatterplots, arcs, hexagons, heatmaps, 3D columns, trip animations, and point clouds.
Deck.gl is the right choice when you have big data to visualize geographically — GPS traces, sensor networks, population density, flight paths, or real-time vehicle tracking. It processes data on the GPU, handling datasets that would crash DOM-based or Canvas-based renderers. The trade-off is complexity: Deck.gl requires understanding WebGL layers, data formatting, and GPU rendering concepts.
6. CesiumJS
CesiumJS is the only library on this list that renders a true 3D globe. It supports 3D terrain, 3D building models (3D Tiles), satellite imagery time series, flight path visualization, and geospatial simulations. Applications include aerospace visualization, urban digital twins, drone flight planning, and earth science.
CesiumJS is open source (Apache 2.0 license), but high-resolution terrain and 3D tile hosting is provided through Cesium Ion, a commercial service. The library is large (500 KB+) and complex, but for 3D geospatial visualization, there is no open-source alternative at this capability level.
7. MapLibre GL JS
MapLibre GL JS is an open-source fork of Mapbox GL JS v1, created when Mapbox changed its license in v2. MapLibre provides the same WebGL rendering, vector tile support, 3D terrain, and runtime styling as Mapbox — but with no vendor lock-in. You can use any vector tile source: self-hosted, Stadia Maps, MapTiler, Amazon Location Service, or your own tile server.
MapLibre has grown rapidly since forking, with contributions from AWS, Microsoft, Meta, and hundreds of independent developers. It is the recommended choice for projects that want Mapbox-quality rendering without Mapbox pricing or licensing restrictions. The API is nearly identical to Mapbox GL JS v1, making migration straightforward.
| Feature | Mapbox GL JS | MapLibre GL JS |
|---|---|---|
| License | Proprietary (v2+) | BSD 3-Clause (open source) |
| Tile source | Mapbox only | Any vector tile source |
| 3D terrain | Yes | Yes |
| Map styling | Mapbox Studio + runtime | Runtime + any style spec editor |
| Free tier | 50K loads/mo | Unlimited (self-hosted tiles) |
| Active development | Mapbox team | Open-source community + corporate sponsors |
How to Choose
| Your Situation | Best Library | Why |
|---|---|---|
| Simple map with markers | Leaflet | Lightest, easiest, huge plugin ecosystem |
| Beautiful 3D maps, budget for SaaS | Mapbox GL JS | Best visual quality, complete ecosystem |
| 3D maps, no vendor lock-in | MapLibre GL JS | Open-source Mapbox fork, any tile source |
| Users expect Google Maps | Google Maps JS API | Street View, Places, best geocoding |
| GIS data, enterprise geospatial | OpenLayers | Widest format support (WMS, WFS, etc.) |
| Data visualization on maps | D3.js or Deck.gl | D3 for custom charts, Deck.gl for big data |
| 3D globe, terrain, simulations | CesiumJS | Only true 3D globe renderer |
| Millions of data points | Deck.gl | GPU-accelerated, handles millions of points |
For most web projects in 2026, start with Leaflet. If you need vector tiles, 3D terrain, or runtime style changes, move to MapLibre GL JS. Only reach for Mapbox, Google, or CesiumJS when their specific capabilities (Mapbox Studio, Street View, 3D globe) are requirements rather than nice-to-haves.
Related Posts


Comments (0)