
40+ Landing Page Statistics: Conversion Rates & Benchmarks (2026)
Last updated: March 2026
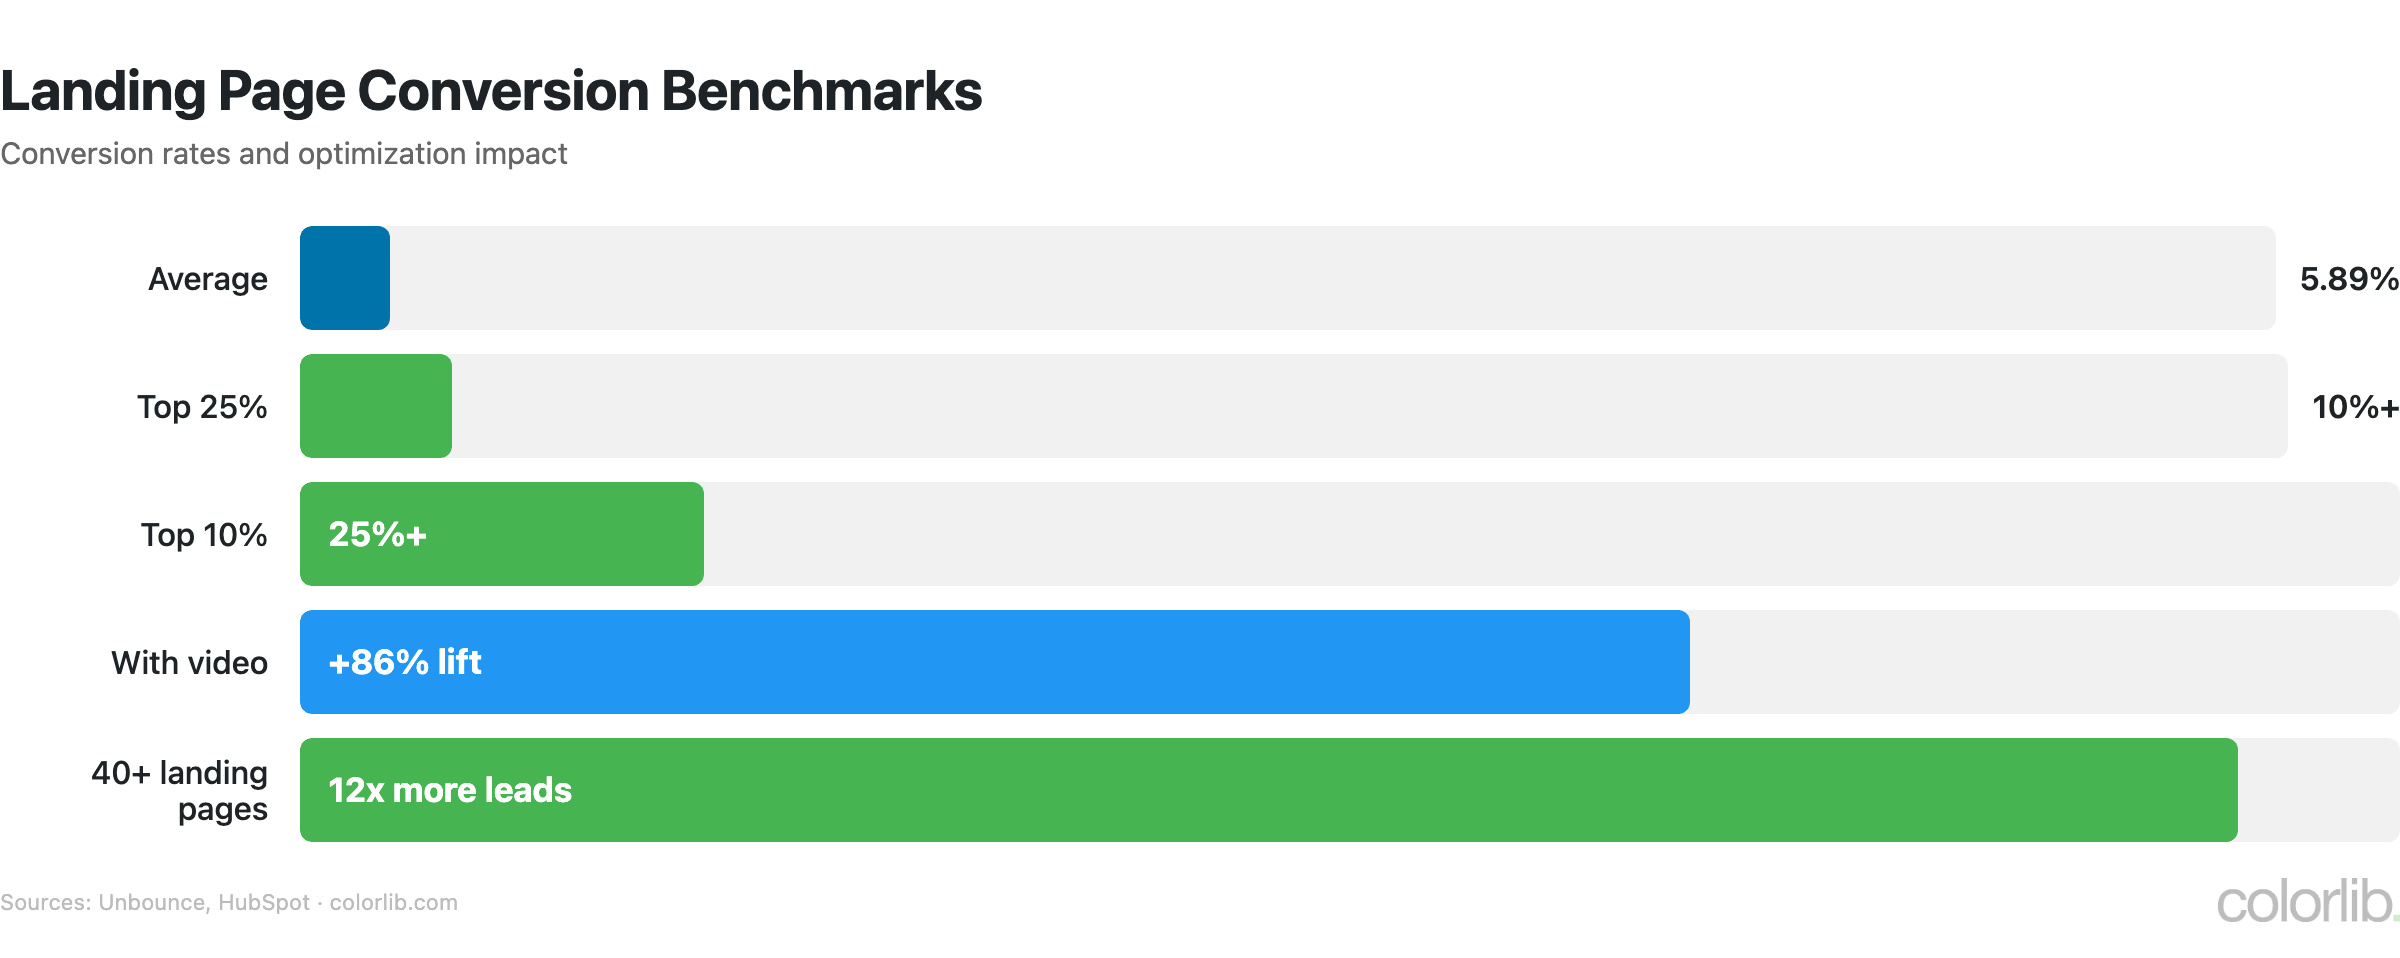
The average landing page converts at 5.89%, but the top 25% achieve 10%+ conversion rates. Companies with 40+ landing pages generate 12x more leads, videos increase conversions by 86%, and personalized CTAs convert 202% better than generic ones. Yet most landing pages still have too many form fields and load too slowly on mobile. Here are 100+ landing page statistics covering conversion benchmarks, design elements, A/B testing, mobile performance, and industry comparisons for 2026.
Key Landing Page Statistics (2026)
- Average conversion rate: 5.89% (Unbounce)
- Top 25% convert at 10%+ (WordStream)
- 40+ landing pages = 12x more leads (HubSpot)
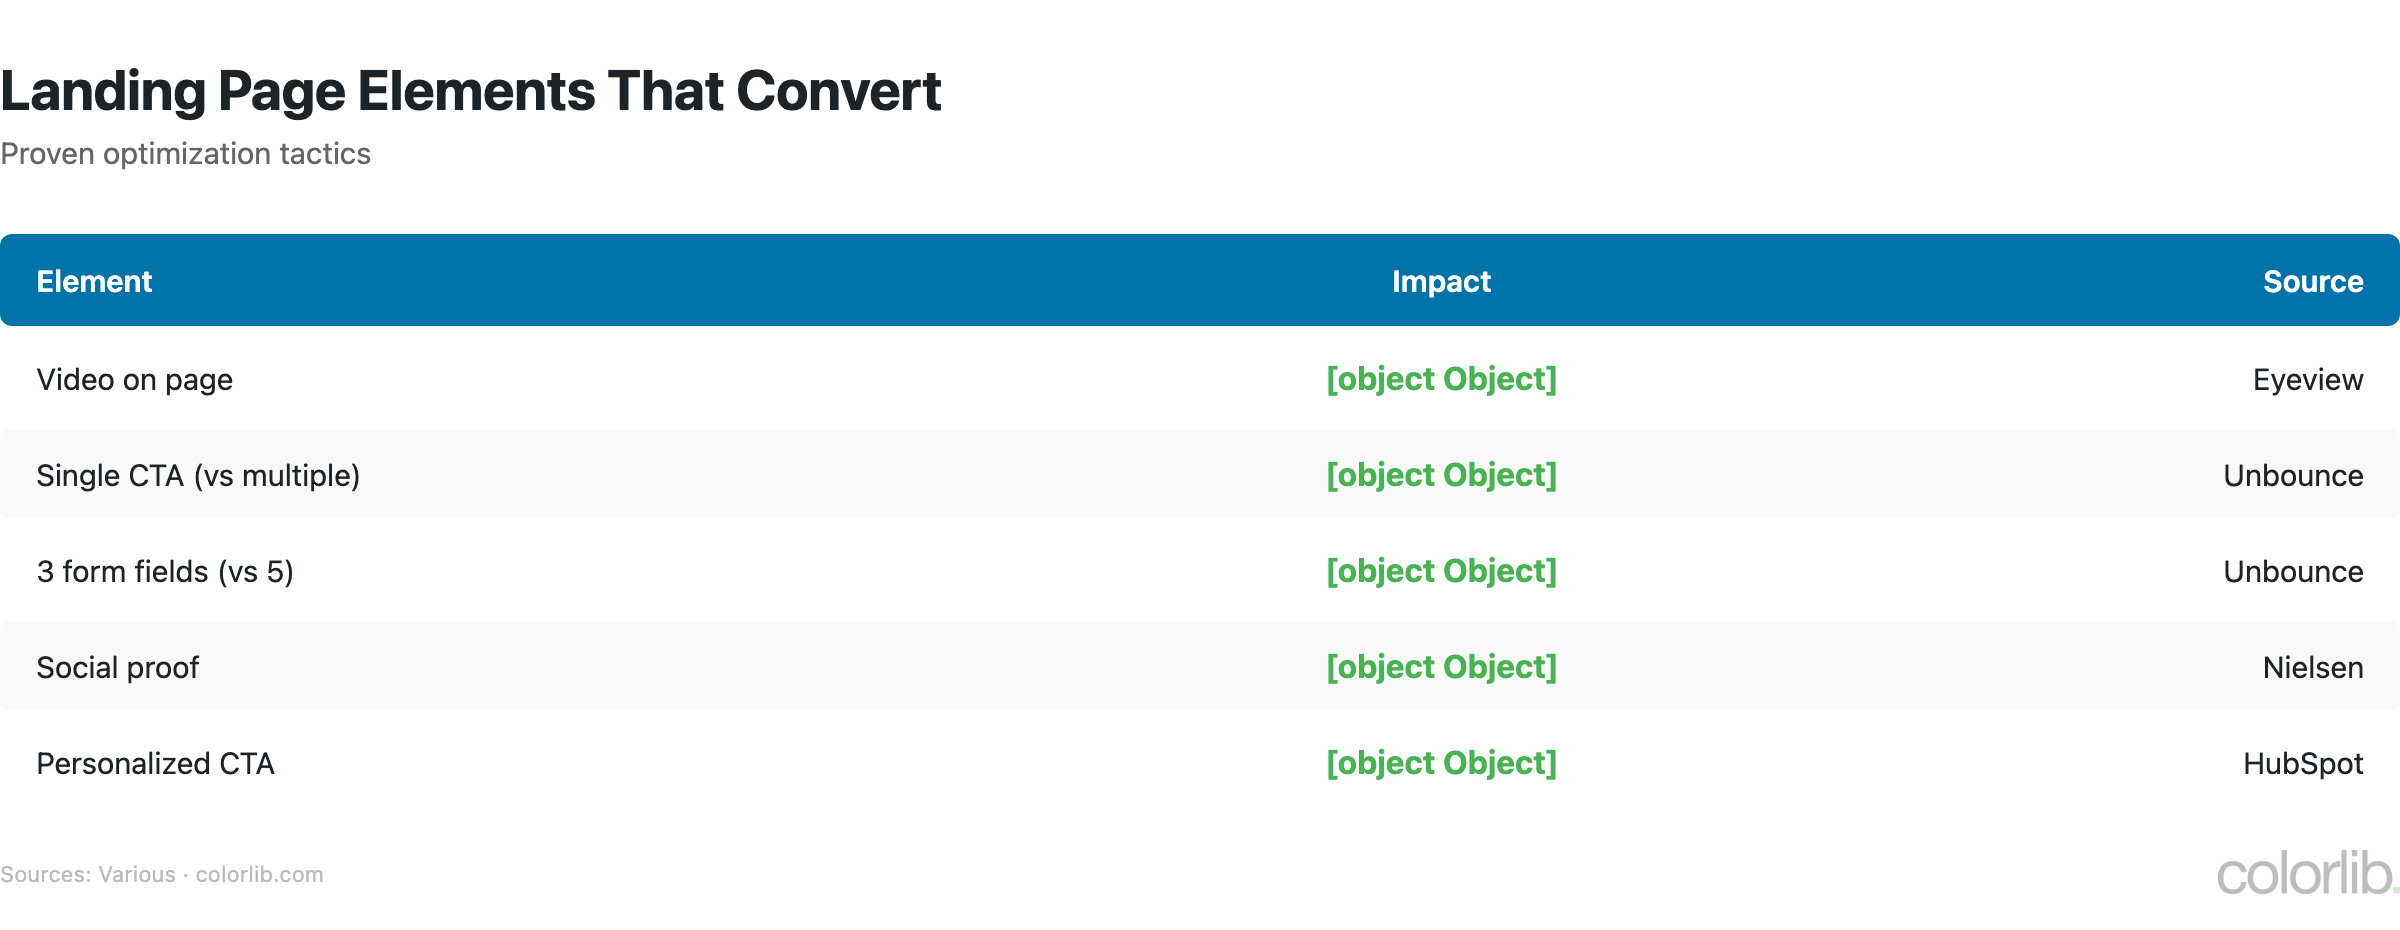
- Videos increase conversion 86% (EyeView Digital)
- Personalized CTAs convert 202% better (HubSpot)
- A/B testing improves conversion 49% (Invesp)
- Reducing form fields to 3 improves conversion 50% (Unbounce)
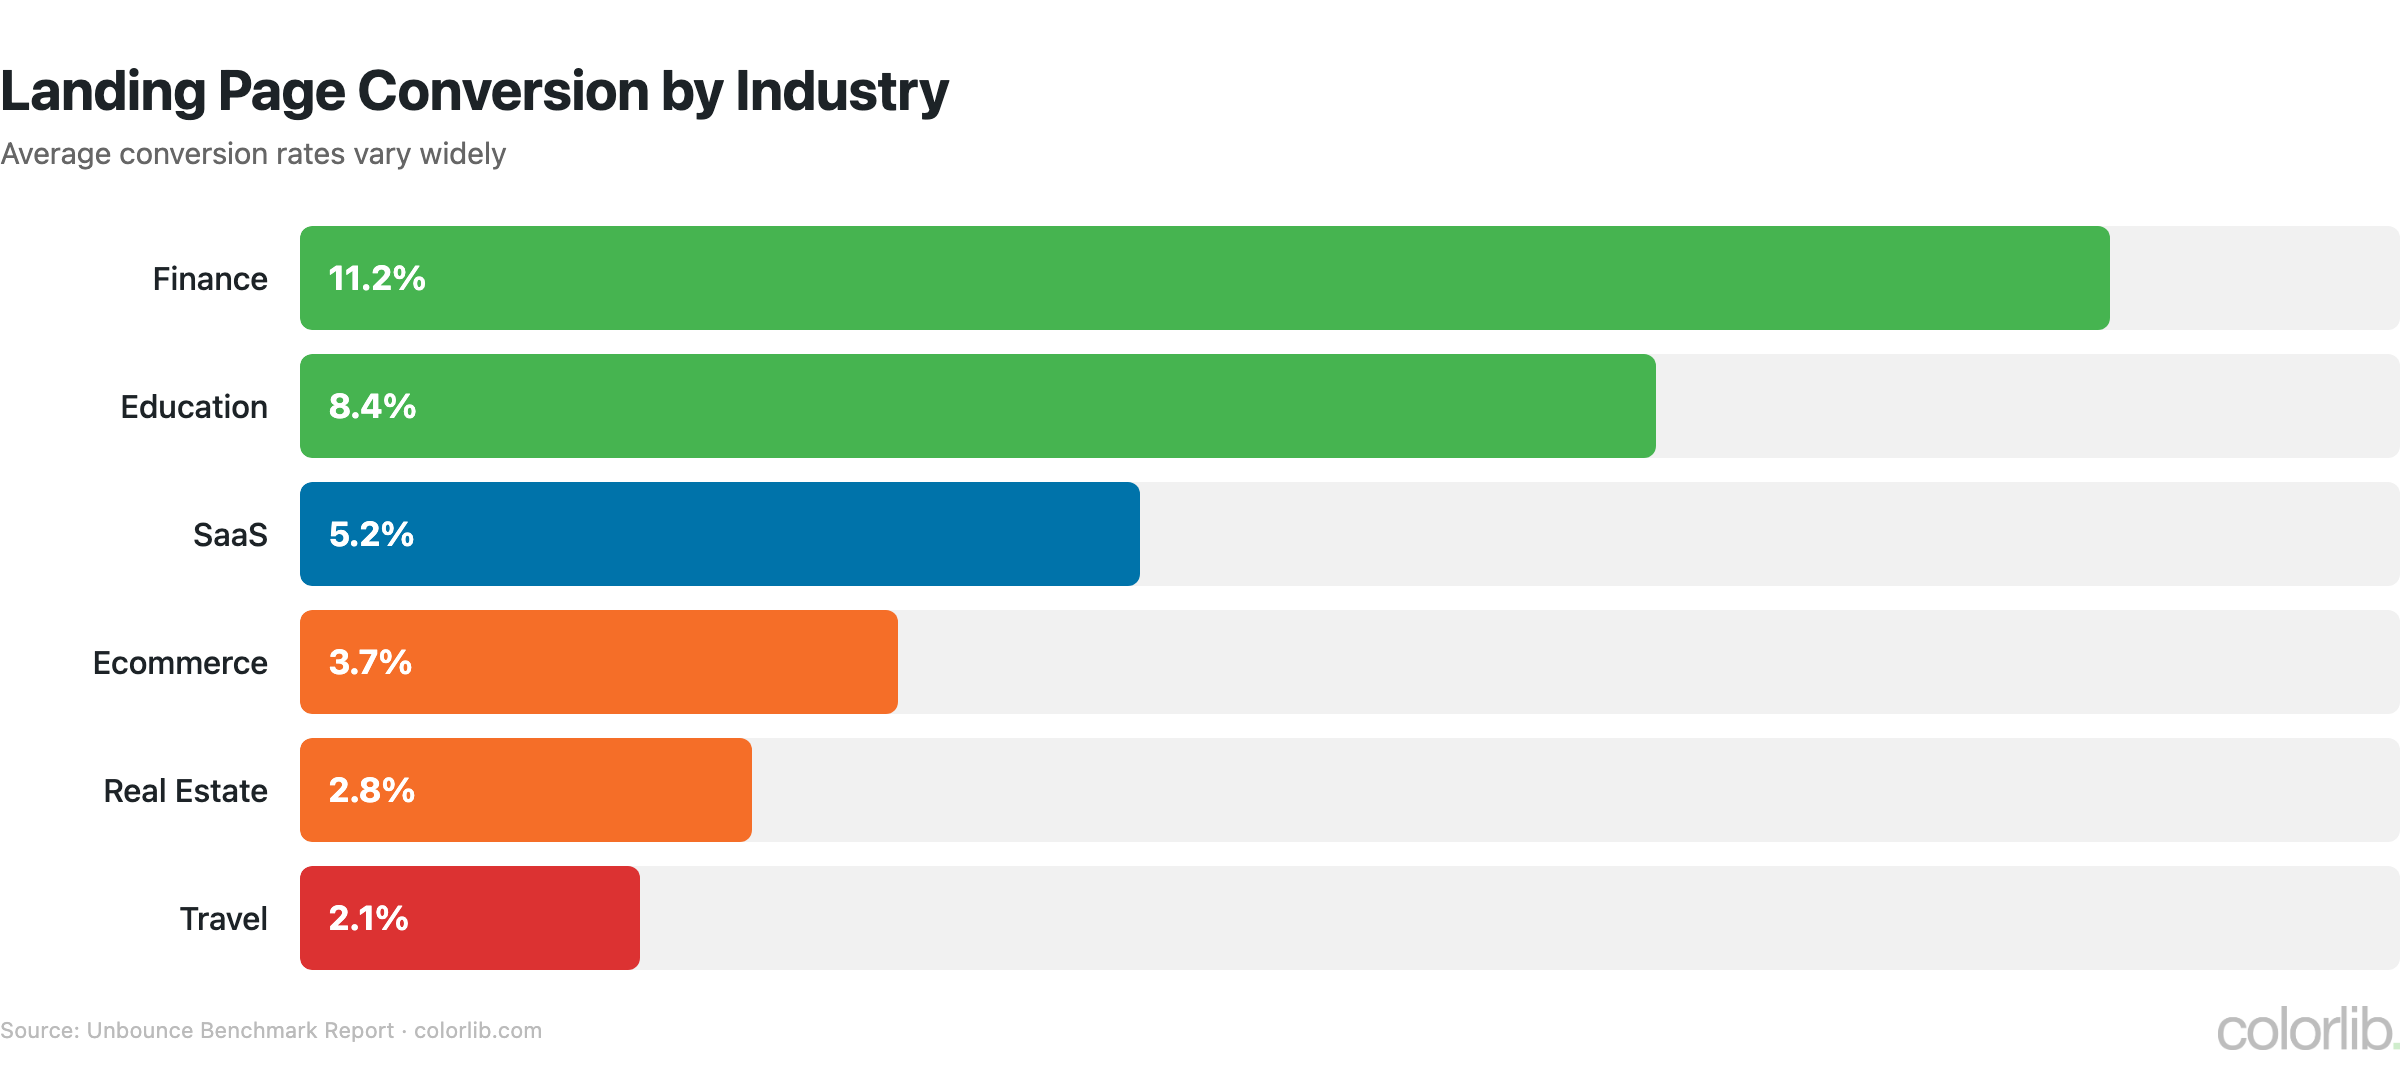
Conversion Rate Benchmarks
| Industry | Median Conversion Rate | Top 25% Rate |
|---|---|---|
| Catering & Restaurants | 9.8% | 18.2% |
| Media & Entertainment | 7.9% | 14.5% |
| Finance & Insurance | 6.2% | 12.0% |
| Education | 5.8% | 11.4% |
| Fitness & Nutrition | 5.6% | 10.8% |
| Legal | 5.4% | 10.2% |
| Travel | 4.8% | 9.5% |
| SaaS | 4.2% | 8.8% |
| Ecommerce | 3.7% | 7.4% |
| Real Estate | 3.6% | 7.1% |
- The overall average landing page conversion rate is 5.89%, but performance varies dramatically by industry — from 3.6% (real estate) to 9.8% (catering)
- The top 25% of landing pages convert at 10%+, while the bottom 25% convert below 3% — a 3x+ performance gap driven by design and optimization
- Ecommerce landing pages average 3.7%, lower than lead-gen pages because purchasing requires more commitment than form submissions
- SaaS free trial landing pages convert at 4.2% median, but the best performers (with clear value propositions and social proof) exceed 15%
- Landing pages with a single CTA convert 266% better than pages with multiple competing calls to action
Design & Elements Statistics
| Element | Impact on Conversion | Source |
|---|---|---|
| Video on landing page | +86% conversion | EyeView Digital |
| Personalized CTAs | +202% vs generic | HubSpot |
| Social proof (testimonials) | +34% conversion | WikiJob |
| Trust badges | +42% conversion | Baymard Institute |
| Reducing form fields (5 → 3) | +50% conversion | Unbounce |
| Single CTA vs multiple | +266% conversion | Unbounce |
| Countdown timers | +9% conversion | Invesp |
| Above-the-fold CTA | +20% conversion | NNG |
- Videos on landing pages increase conversions by 86% — product demos, explainer videos, and testimonial videos all perform well
- Personalized CTAs (based on user data, location, or behavior) convert 202% better than static, one-size-fits-all buttons
- The average landing page has 5 form fields, but reducing to 3 fields improves conversion by 50% — every additional field adds friction
- Trust signals (badges, testimonials, security seals, client logos) collectively increase conversion by 34-42% — credibility removes purchase hesitation
- Landing pages with navigation menus removed convert 100% better than pages with full site navigation — focus beats choice
A/B Testing Statistics
| Metric | Value | Source |
|---|---|---|
| A/B testing conversion improvement | +49% average | Invesp |
| Companies A/B testing landing pages | 44% | Unbounce |
| Tests that produce winners | 1 in 8 | CXL |
| Most tested element | Headlines (58%) | Invesp |
| Second most tested element | CTA buttons (53%) | Invesp |
| Minimum sample size for valid results | 1,000+ visitors/variant | CXL |
| Companies using multivariate testing | 18% | Invesp |
- A/B testing improves landing page conversions by 49% on average, yet only 44% of companies regularly test their landing pages
- Only 1 in 8 A/B tests produces a statistically significant winner — most tests result in no meaningful difference, making iteration essential
- Headlines are the most commonly tested element (58%), followed by CTA buttons (53%), images (42%), and form length (35%)
- Companies running 5+ tests per month see 2x the conversion improvements of companies testing less frequently
- AI-powered testing tools are emerging that can automatically optimize headlines, images, and CTAs based on visitor behavior patterns
Mobile Landing Page Statistics
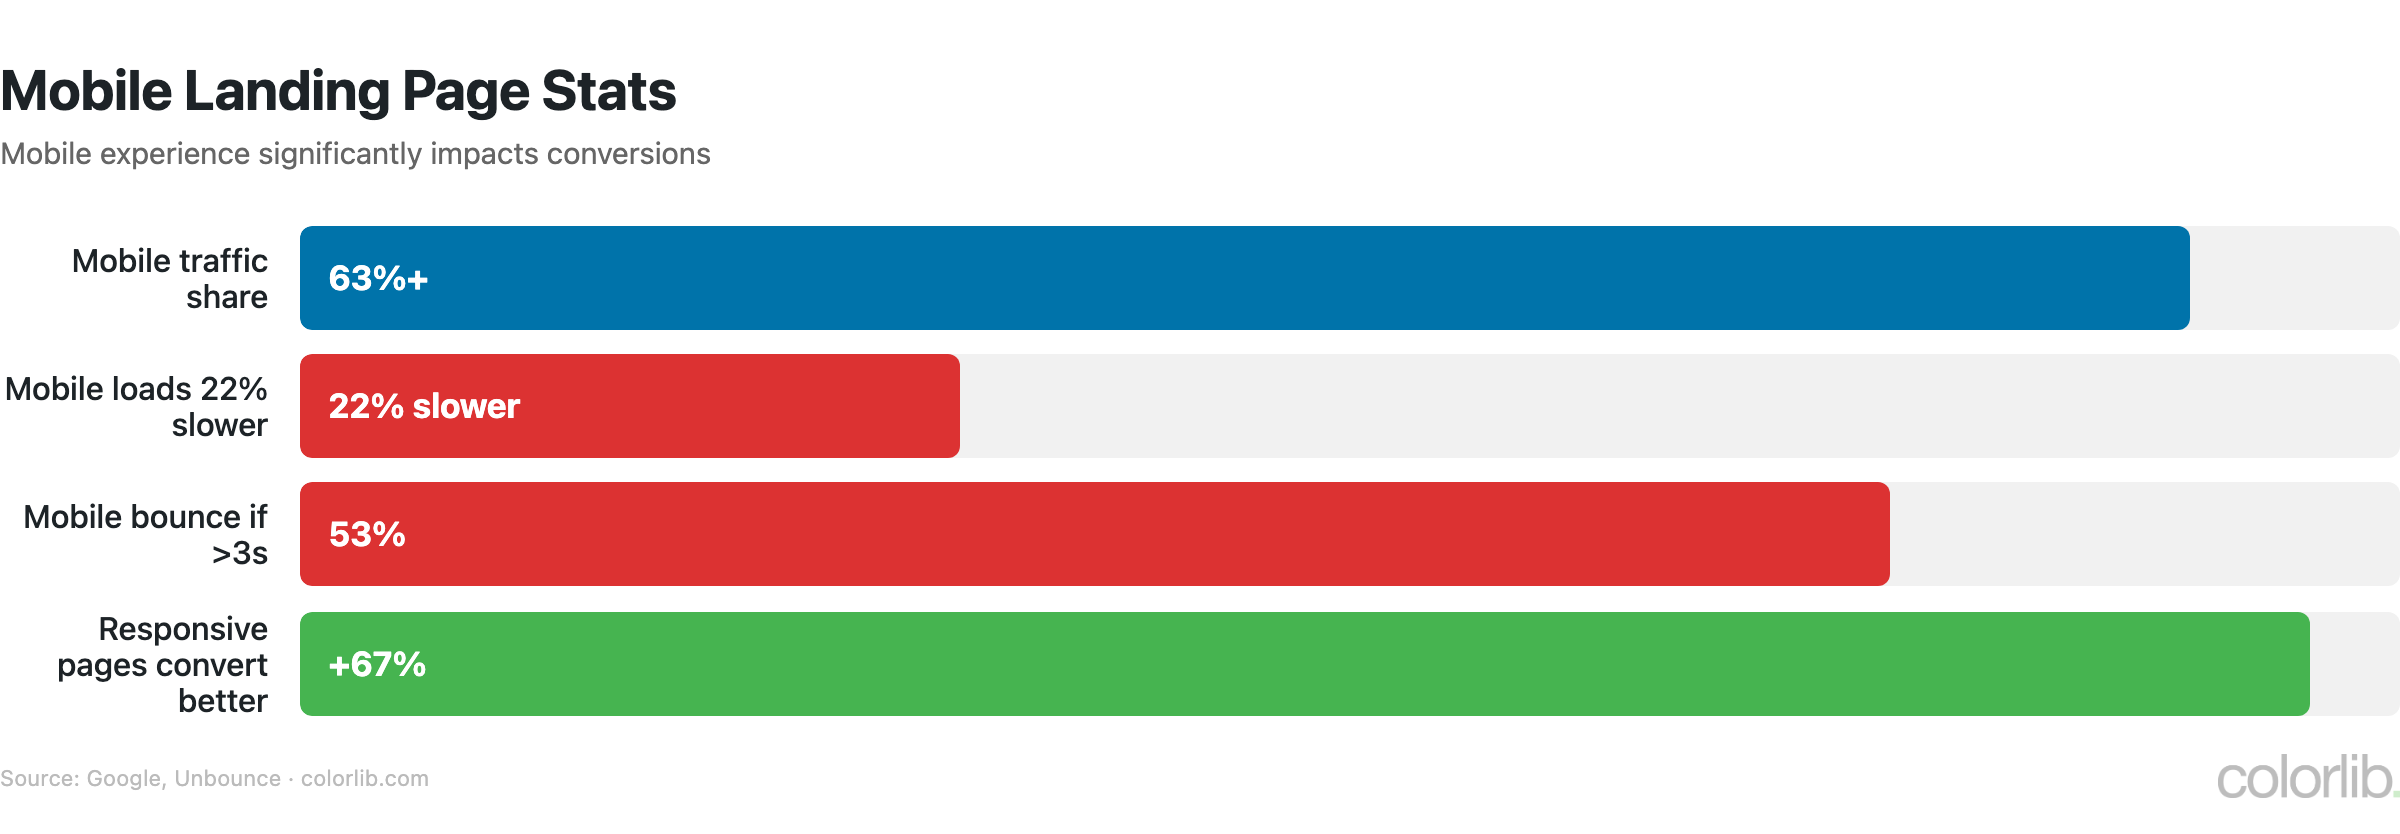
| Metric | Desktop | Mobile |
|---|---|---|
| Average conversion rate | 6.3% | 4.1% |
| Average page load time | 2.5s | 3.1s |
| Share of landing page traffic | ~40% | ~60% |
| Bounce rate (slow pages) | +32% | +90% |
| Form completion rate | 48% | 32% |
| Average scroll depth | 70% | 55% |
- Mobile landing pages convert at 4.1% compared to desktop’s 6.3% — a 35% performance gap driven by smaller screens and slower connections
- Mobile landing pages load 22% slower than desktop versions (3.1s vs 2.5s), directly impacting bounce rates and conversions
- Despite receiving 60% of traffic, mobile landing pages generate only ~40% of conversions — the mobile conversion gap represents significant lost revenue
- Mobile form completion rates are 32% vs 48% desktop — shorter forms, larger input fields, and autofill support are critical for mobile
- For broader mobile performance data, see our web design statistics report
Industry Benchmarks
| Metric | Value | Source |
|---|---|---|
| Companies with 40+ landing pages | 12x more leads vs. <5 | HubSpot |
| Marketers using landing pages | 68% | Unbounce |
| Average landing pages per company | 10-15 | Unbounce |
| Long landing pages | Generate 220% more leads | Marketing Experiments |
| Landing page builder market | $1.5 billion+ | Industry estimates |
| Most popular builder: Unbounce | 15,000+ customers | Unbounce |
| Average cost per landing page (agency) | $1,000-$3,000 | Industry estimates |
- Companies with 40+ landing pages generate 12x more leads than those with 5 or fewer — more pages mean more targeted offers for different audiences
- Long-form landing pages (below the fold) generate 220% more leads than short pages for complex offers that require more explanation
- The average company has only 10-15 landing pages — significantly fewer than the 40+ threshold that drives maximum lead generation
- Agency-built landing pages cost $1,000-$3,000 each, while landing page builders like Unbounce, Leadpages, and Instapage offer DIY options from $50-$200/month
- For how landing pages connect to broader digital strategy, see our digital marketing statistics and lead generation statistics reports
Key Takeaways
- The average converts at 5.89%, but the best hit 10%+. The gap between median and top-performing landing pages is enormous, and it’s driven by design optimization, not luck.
- More landing pages = more leads. Companies with 40+ pages generate 12x more leads, yet the average company has only 10-15. Building targeted pages for each audience segment is one of the highest-ROI marketing activities.
- Video and personalization are the top conversion drivers. Videos boost conversion 86%, personalized CTAs convert 202% better, and social proof adds 34-42%. These aren’t marginal improvements — they’re transformative.
- Simplicity wins. Reducing form fields from 5 to 3 improves conversion by 50%, removing navigation doubles conversion, and single CTAs outperform multiple by 266%. Less is more on landing pages.
- Mobile is underperforming. Despite receiving 60% of traffic, mobile converts 35% worse than desktop. Closing the mobile conversion gap is the single biggest opportunity for most businesses.
- A/B testing pays for itself. A 49% average improvement means testing is the most reliable way to improve landing page performance — yet only 44% of companies do it regularly.
Sources
- Unbounce — Conversion Benchmark Report
- HubSpot — Marketing Statistics
- WordStream — Conversion Rate Benchmarks
- Invesp — A/B Testing Statistics
- EyeView Digital — Video Marketing Research
- Baymard Institute — Trust & Checkout Research
- CXL — A/B Testing & CRO Research
Frequently Asked Questions
What is a good landing page conversion rate?
The average landing page converts at 5.89%, but a “good” rate depends on your industry. The top 25% of landing pages convert at 10%+, while the top 10% exceed 15%. Catering and restaurants average 9.8%, while ecommerce averages 3.7%. If you’re below your industry median, there’s significant room for optimization through A/B testing, simplified forms, and stronger CTAs.
How many landing pages should a company have?
As many as possible for different audience segments and offers. HubSpot found that companies with 40+ landing pages generate 12x more leads than those with 5 or fewer. Each landing page should target a specific keyword, offer, or audience segment. The average company has only 10-15 landing pages — well below the 40+ threshold that maximizes lead generation.
What elements increase landing page conversions?
The highest-impact elements: video (+86%), personalized CTAs (+202%), trust badges (+42%), social proof/testimonials (+34%), and reducing form fields from 5 to 3 (+50%). Removing navigation menus doubles conversion, and using a single CTA instead of multiple boosts conversion by 266%. Above-the-fold CTAs add 20%. For broader design insights, see our web design statistics report.
Do landing pages work better on desktop or mobile?
Desktop landing pages convert significantly better at 6.3% vs 4.1% for mobile — a 35% gap. Despite mobile receiving 60% of traffic, it generates only ~40% of conversions. This gap is driven by slower load times (3.1s vs 2.5s), smaller screens making forms harder to complete (32% vs 48% completion rate), and less scroll depth (55% vs 70%). Optimizing for mobile — shorter forms, larger buttons, faster load times — represents one of the biggest conversion opportunities. For broader performance context, see our lead generation statistics report.
Related Posts


Comments (0)