60+ Digital Marketing Statistics & Trends (2026)
Last updated: March 2026
Digital marketing now commands over $740 billion in global ad spend, SEO drives 53% of all website traffic, and email marketing delivers an unmatched $36-42 ROI per dollar spent. Here are 100+ digital marketing statistics covering market size, SEO, email, social media, content marketing, video, and AI adoption for 2026.
Key Digital Marketing Statistics (2026)
- Global digital ad spend: $740+ billion in 2025 (Statista)
- SEO drives 53% of all website traffic (BrightEdge)
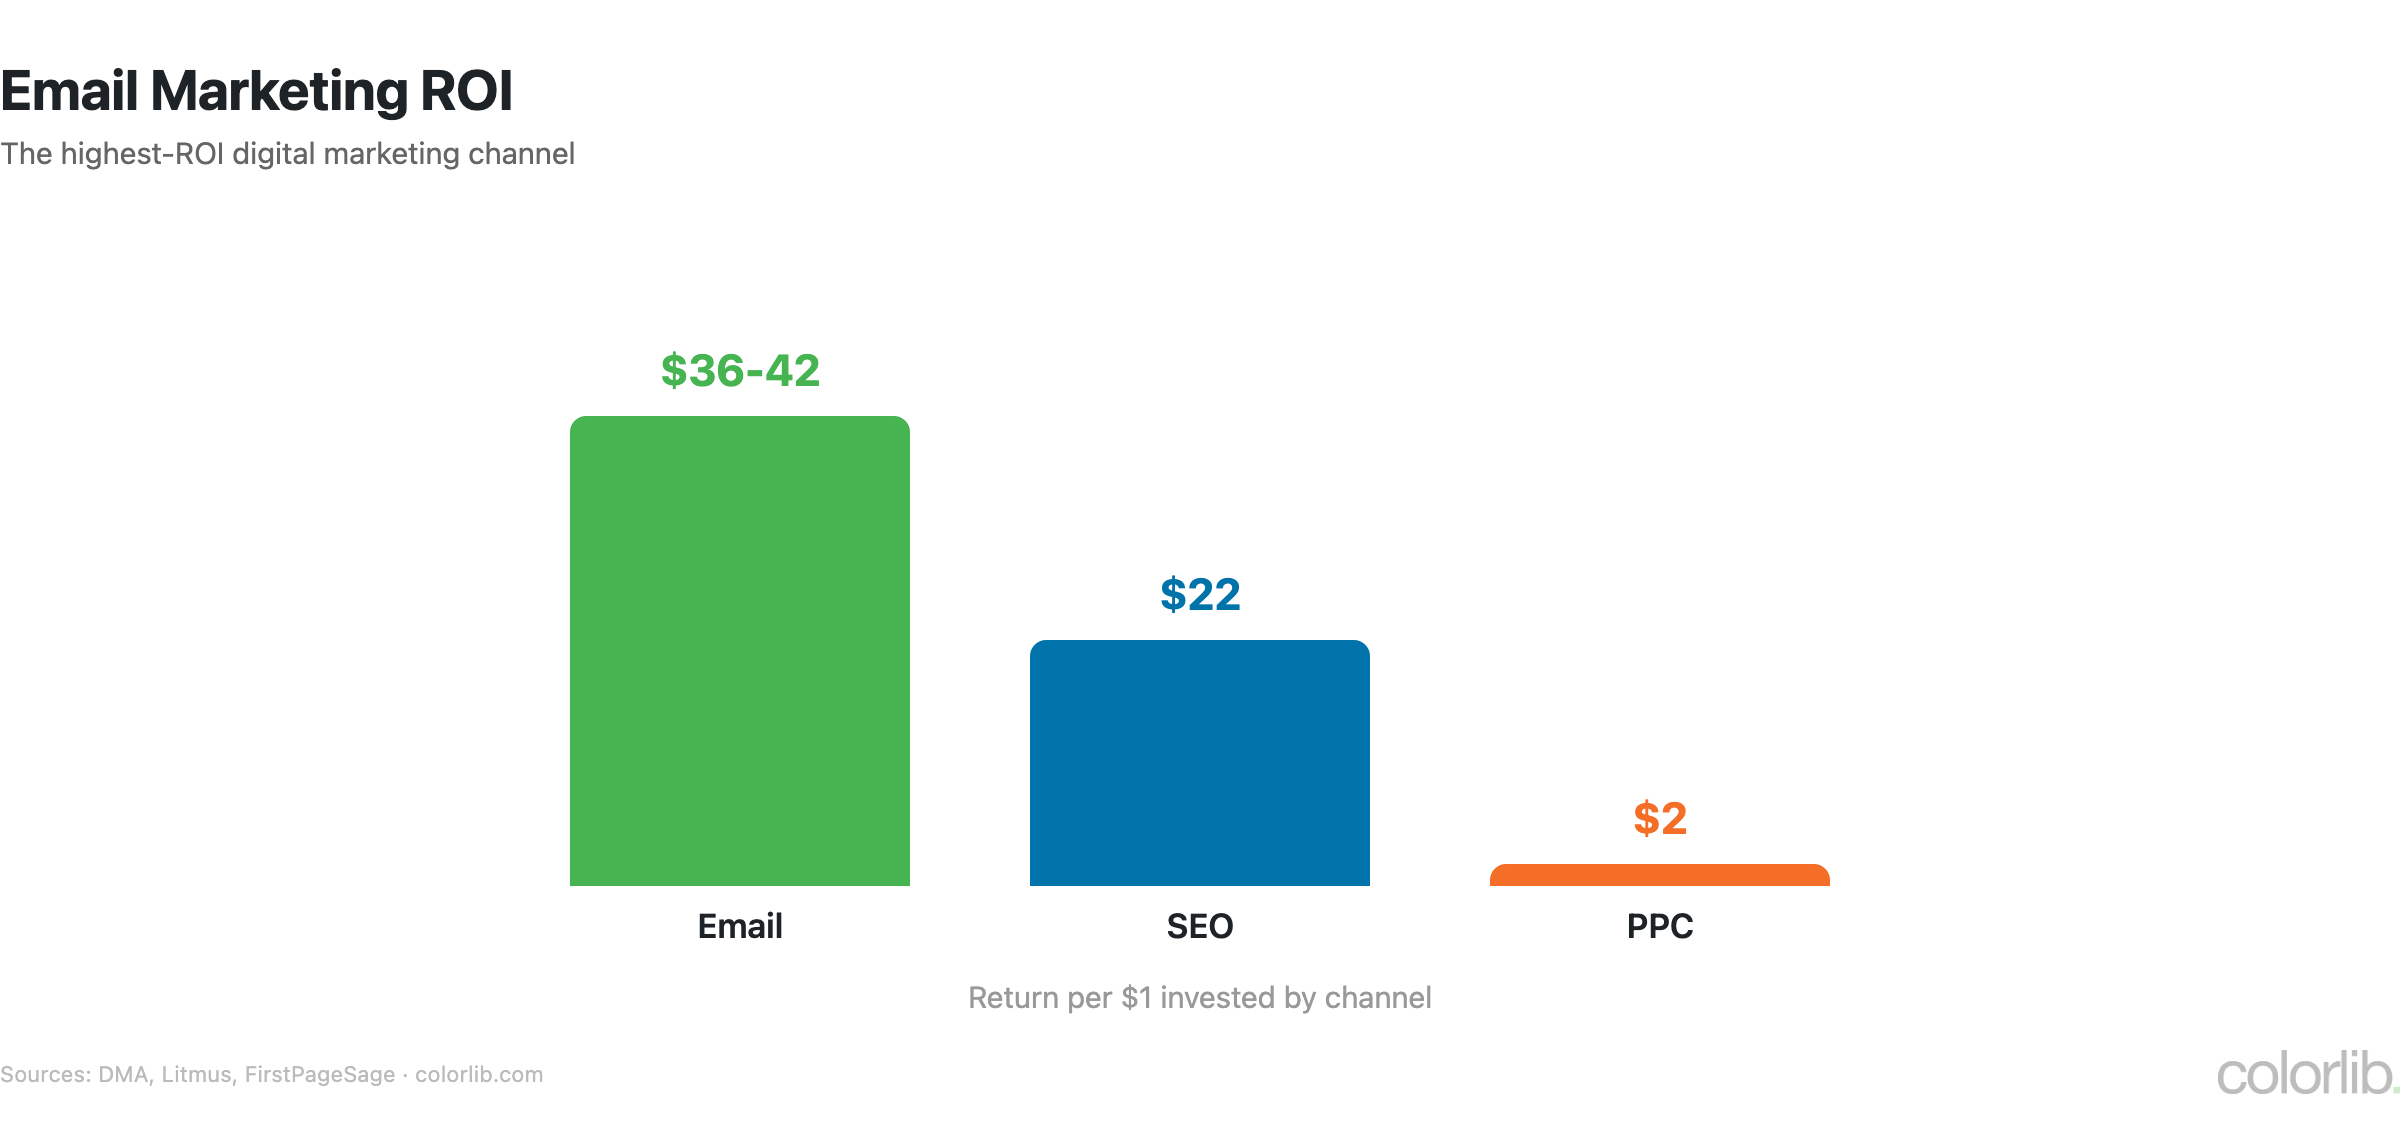
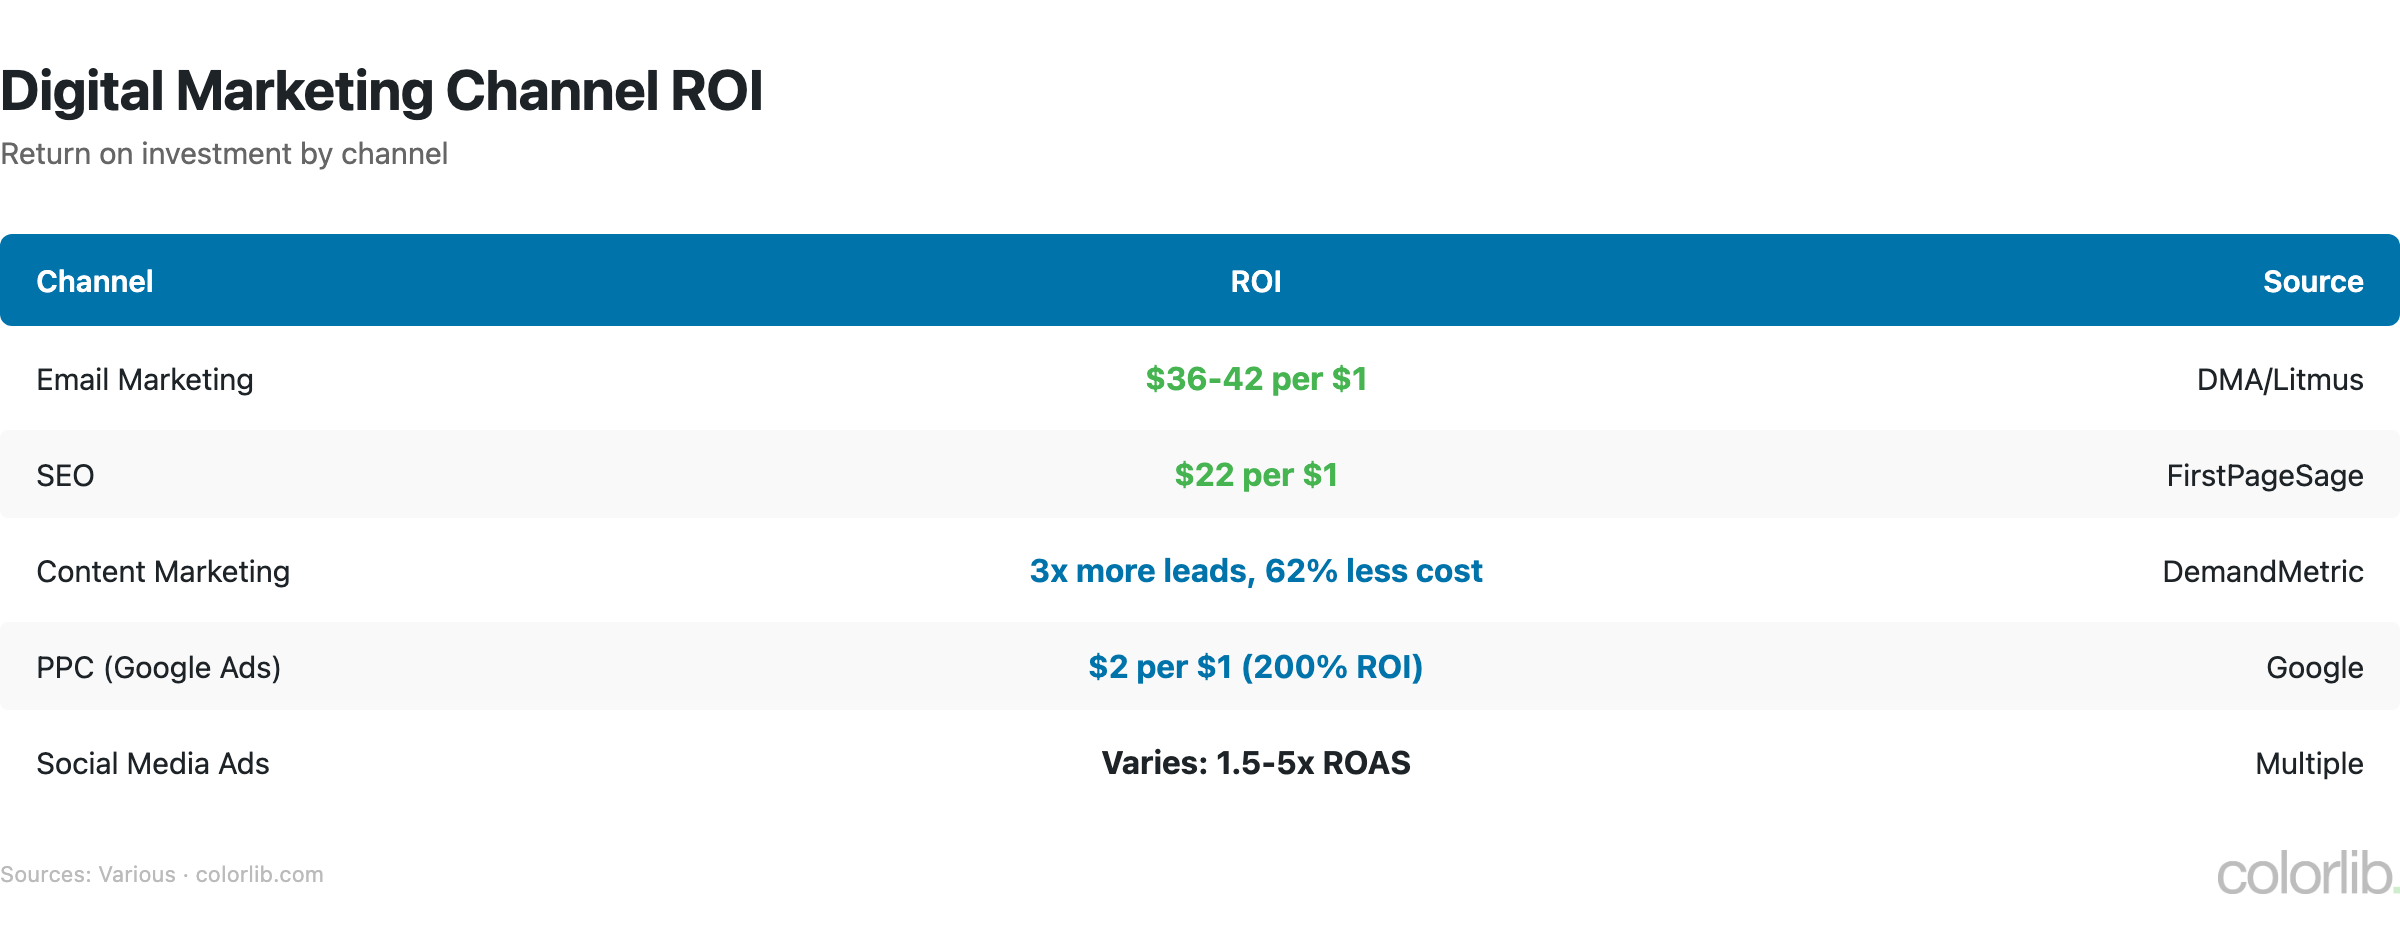
- Email marketing ROI: $36-42 per $1 spent (Litmus)
- 91% of B2B marketers use content marketing (CMI)
- Social media ad spend exceeds $230 billion globally (Statista)
- 91% of businesses use video as a marketing tool (Wyzowl)
- Mobile accounts for 60%+ of web traffic (StatCounter)
- 72% of marketers have adopted AI tools (Salesforce)
Digital Marketing Market Size & Growth
| Metric | Value | Source |
|---|---|---|
| Global digital ad spend (2025) | $740+ billion | Statista |
| Digital share of total ad spend | 73% | GroupM |
| Marketing automation market | $8.4 billion | MarketsandMarkets |
| Global martech landscape | 14,000+ solutions | ChiefMartec |
| Average company marketing budget | 9.1% of revenue | Gartner CMO Survey |
| US digital ad spend | $298 billion | eMarketer |
| Digital marketing CAGR (2024-2030) | 13.6% | Grand View Research |
| Average marketing team size | 11 people | HubSpot |
- Digital ad spend surpassed $1 trillion when combined with digital marketing services, martech, and agency fees
- SMBs allocate 45-55% of their total marketing budget to digital channels — up from 30% five years ago
- The average company uses 12 different marketing technology tools (ChiefMartec)
- 63% of businesses have increased their digital marketing budgets in the past year
- Performance marketing now accounts for 62% of all digital spend, with brand marketing at 38%
SEO Statistics
| Statistic | Value | Source |
|---|---|---|
| Organic search share of web traffic | 53% | BrightEdge |
| Google search market share | 91.6% | StatCounter |
| Click-through rate for #1 organic result | 27.6% | Backlinko |
| Pages with zero organic traffic | 96.55% | Ahrefs |
| Average time to rank on page 1 | 3-6 months | Ahrefs |
| Long-tail keywords share of searches | 70% | Semrush |
| Global SEO industry value | $80+ billion | Statista |
| Voice search share of queries | 20%+ |
- 68% of online experiences begin with a search engine (BrightEdge)
- The #1 organic result gets 10x more clicks than the #10 result
- Featured snippets appear in 12.3% of search queries and steal clicks from the #1 position
- 46% of all Google searches have local intent — critical for businesses with physical locations
- Websites with blogs generate 55% more traffic than those without (HubSpot)
- AI overviews now appear in 30%+ of Google searches, changing traditional SEO click-through rates
Email Marketing Statistics
| Metric | Value | Source |
|---|---|---|
| Email marketing ROI | $36-42 per $1 spent | Litmus |
| Global email users | 4.5 billion | Statista |
| Average open rate (all industries) | 21.5% | Mailchimp |
| Average click-through rate | 2.3% | Mailchimp |
| Segmented campaign revenue lift | 760% | Campaign Monitor |
| Personalized subject line open boost | 26% | Campaign Monitor |
| Automated emails conversion rate | 2x higher than batch sends | Omnisend |
| Email marketing market size | $12.6 billion | Statista |
- 77% of marketers have seen email engagement increase over the past year (Litmus)
- Welcome emails have an average open rate of 82% — the highest of any email type
- Cart abandonment emails recover 5-11% of otherwise lost revenue
- 59% of consumers say email influences their purchase decisions
- Mobile devices account for 41% of email opens, making responsive email design essential
- Interactive emails (AMP, polls, carousels) increase click rates by 73% compared to static emails
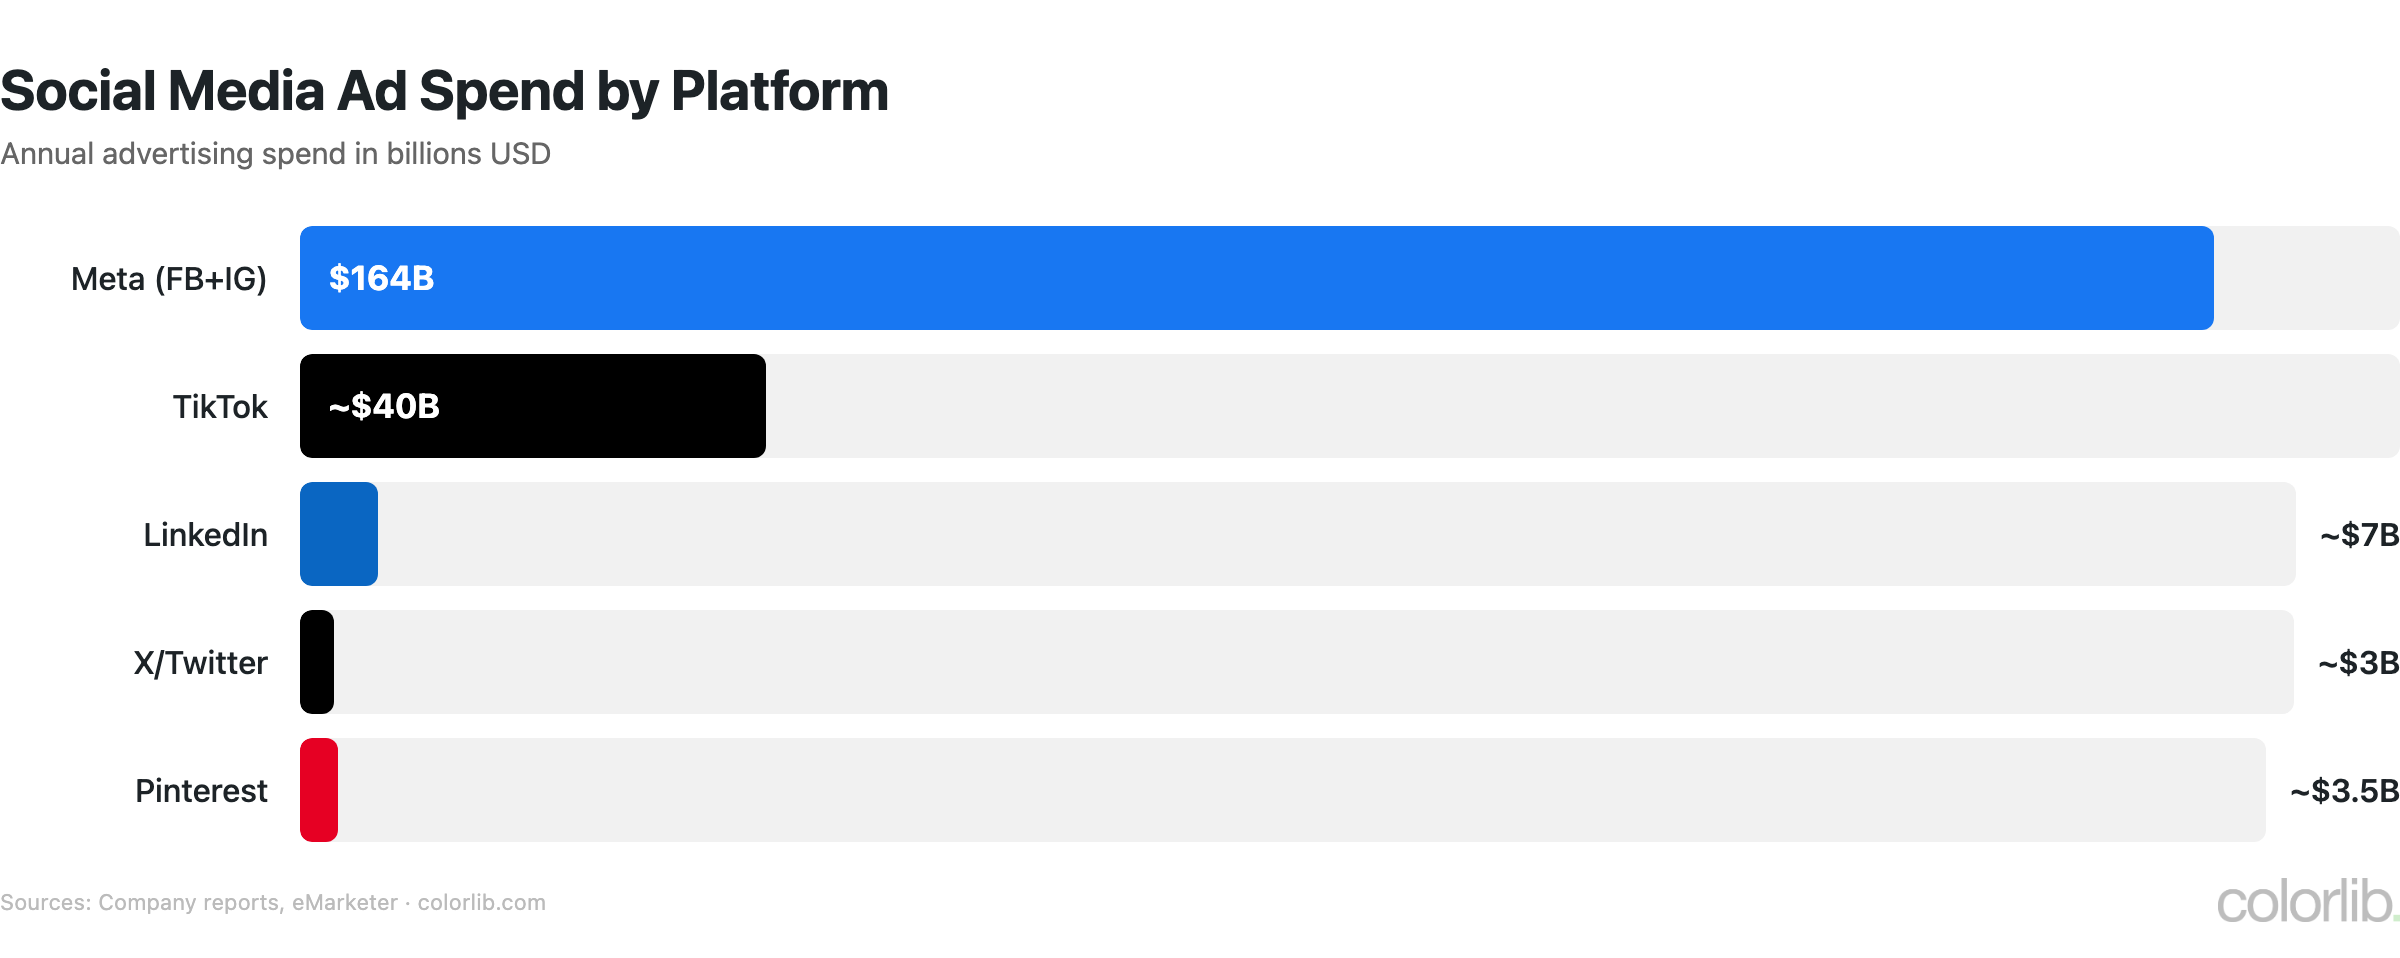
Social Media Marketing Statistics
| Platform / Metric | Value | Source |
|---|---|---|
| Global social media ad spend | $230+ billion | Statista |
| Social media users worldwide | 5.2 billion | DataReportal |
| Average daily social media time | 2 hours 23 minutes | DataReportal |
| Instagram average engagement rate | 0.60% | Socialinsider |
| TikTok average engagement rate | 2.65% | Socialinsider |
| LinkedIn B2B lead gen share | 80% of B2B social leads | |
| Social commerce revenue (US) | $80+ billion | eMarketer |
| Influencer marketing market size | $24 billion | Influencer Marketing Hub |
- 83% of marketers rank social media as their top marketing channel for ROI
- Short-form video (Reels, TikTok, Shorts) delivers 2.5x higher engagement than static posts
- 54% of consumers use social media to research products before purchasing
- Micro-influencers (10K-100K followers) generate 60% higher engagement than mega-influencers
- Paid social CPMs average $6-10, with TikTok offering the lowest CPMs among major platforms
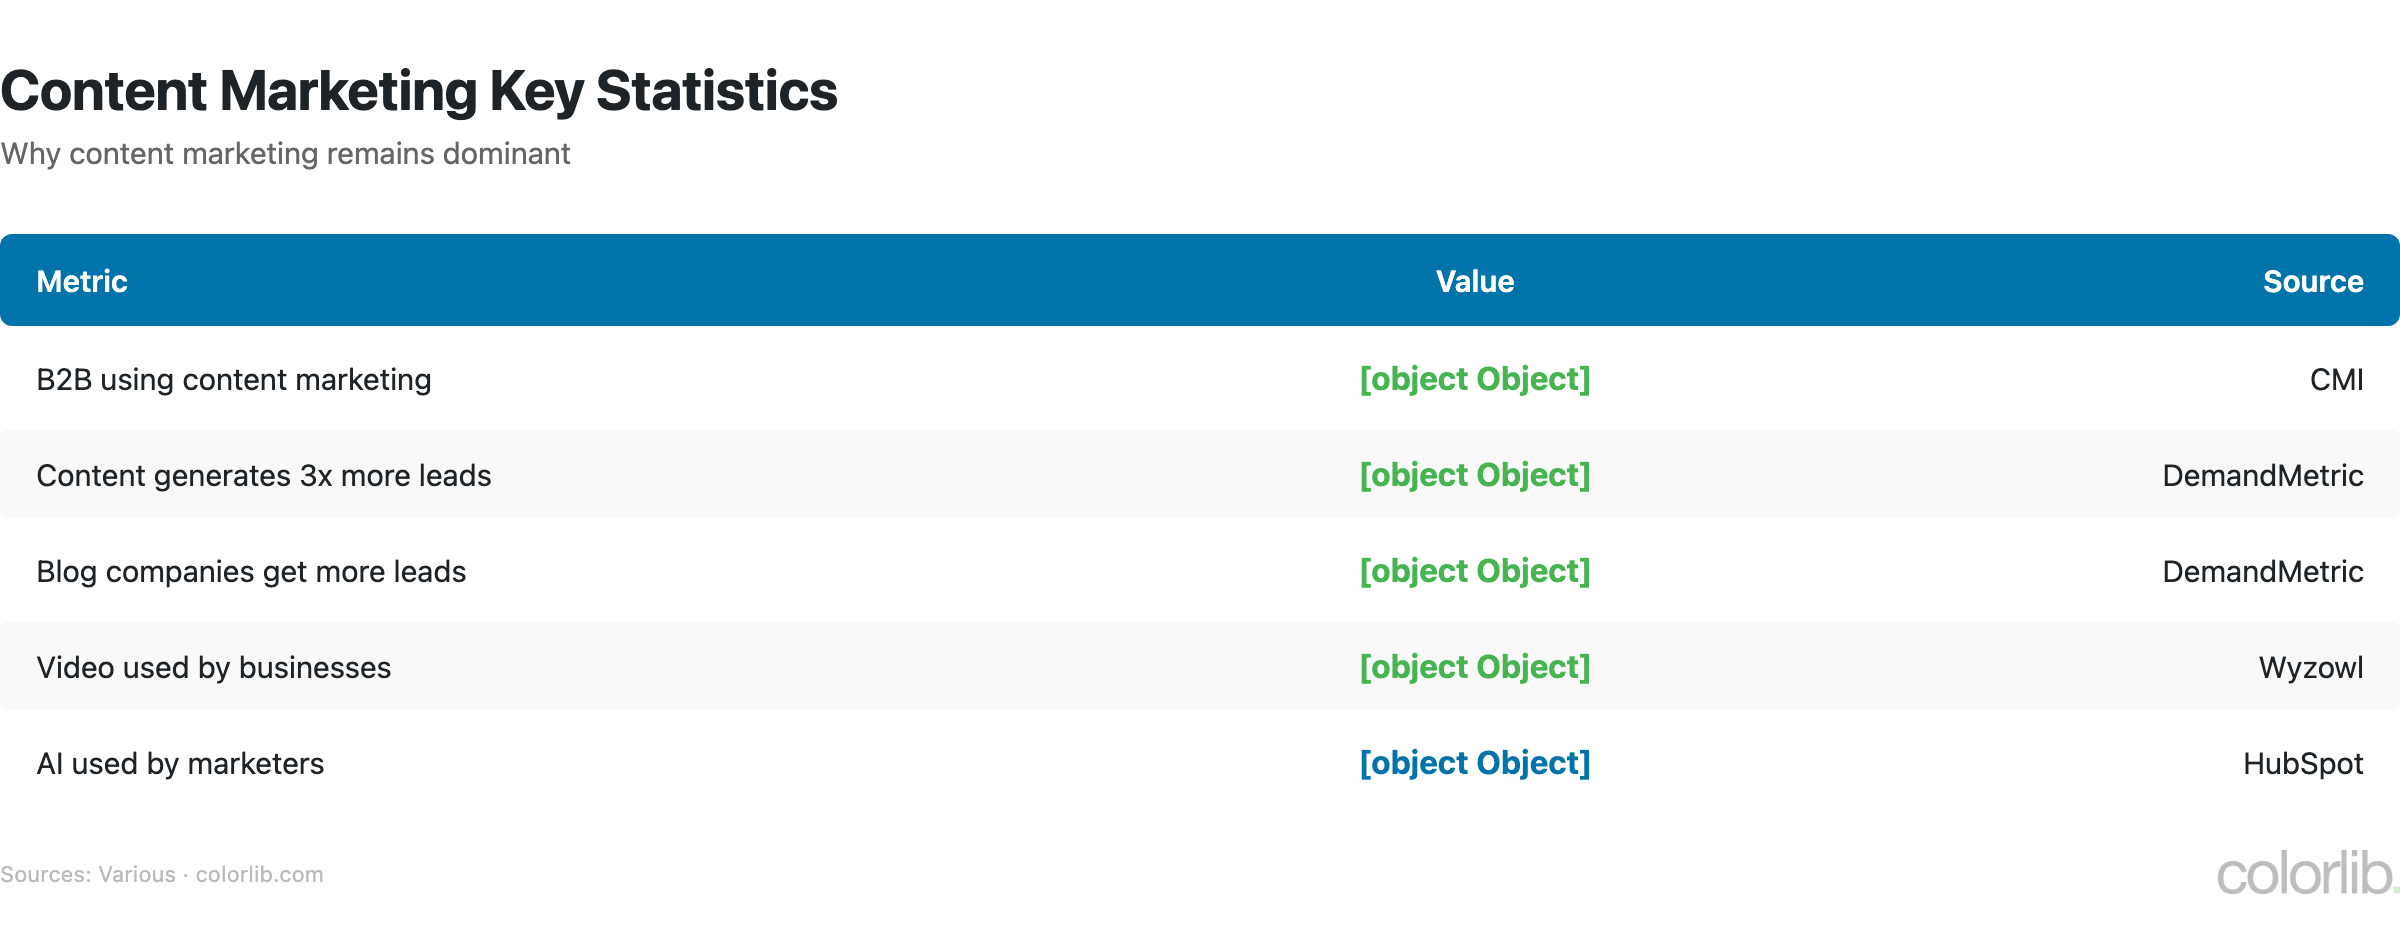
Content Marketing Statistics
| Metric | Value | Source |
|---|---|---|
| B2B marketers using content marketing | 91% | CMI |
| Content marketing cost vs. outbound | 62% less | Demand Metric |
| Content marketing leads vs. outbound | 3x more | Demand Metric |
| Businesses using video | 91% | Wyzowl |
| Blog posts published daily | 7.5 million | Internet Live Stats |
| Long-form content (2,000+ words) share advantage | 77.2% more backlinks | Backlinko |
| Companies with documented strategy | 40% | CMI |
| Content marketing industry size | $600+ billion | Statista |
- The average blog post takes 4 hours 10 minutes to write — up from 3.5 hours in 2020 (Orbit Media)
- 47% of buyers view 3-5 pieces of content before engaging with a sales rep
- Interactive content (quizzes, calculators) generates 2x more conversions than static content
- Podcasts are used by 26% of B2B marketers, with the audience growing 15% year-over-year
- Companies that blog receive 97% more inbound links than those that don’t (HubSpot)
AI in Marketing Statistics
| Metric | Value | Source |
|---|---|---|
| Marketers who have adopted AI | 72% | Salesforce |
| AI in marketing market size | $36 billion | Grand View Research |
| Productivity gains from AI tools | 40% time saved on content creation | HubSpot |
| AI-generated content share | 30%+ of marketing content | Gartner |
| Top AI use: content creation | 48% of marketers | HubSpot |
| AI personalization revenue lift | 15-20% | McKinsey |
| Chatbot adoption in marketing | 58% of B2B companies | Drift |
| AI ad optimization users | 63% of digital advertisers | eMarketer |
- 85% of marketers say AI has changed how they create content in the past year
- AI-powered email subject lines improve open rates by 5-10% on average
- 67% of marketers cite data quality as the biggest challenge to AI adoption
- Predictive analytics used by 44% of marketing teams for audience targeting and budget allocation
- AI-driven ad creative testing reduces cost per acquisition by 20-30% compared to manual A/B testing
Key Takeaways
- Digital dominates. $740B+ in ad spend, 73% of total advertising. Traditional media continues to shrink as budgets shift online.
- SEO remains the best long-term investment. 53% of traffic is organic. But AI overviews are disrupting click-through rates — adapt or lose visibility.
- Email is unbeatable on ROI. $36-42 return per dollar, 760% revenue lift from segmentation. No channel comes close for owned-audience monetization.
- Short-form video wins engagement. 91% of businesses use video. TikTok and Reels deliver 2.5x higher engagement than static content.
- AI is reshaping every channel. 72% adoption, 40% time savings on content. Marketers who resist AI tools will fall behind on both speed and personalization.
- Content quality beats quantity. Long-form content gets 77% more backlinks. Companies with documented strategies outperform those without by 3x.
Sources
- Statista — Digital Advertising Outlook
- BrightEdge — Organic Channel Share Research
- Litmus — State of Email Report
- Content Marketing Institute — B2B Content Marketing Research
- Wyzowl — Video Marketing Statistics
- Salesforce — State of Marketing Report
- HubSpot — State of Marketing
- DataReportal — Digital 2025 Global Overview
- GroupM — Global Ad Spend Forecast
- McKinsey — Marketing & Sales Insights
Frequently Asked Questions
How much do businesses spend on digital marketing?
Global digital ad spend exceeded $740 billion in 2025, representing 73% of all advertising spend. The average company allocates 9.1% of total revenue to marketing, with 45-55% of that going to digital channels. US businesses alone spent $298 billion on digital advertising. For more context on how this compares to total advertising, see our advertising statistics.
What is the most effective digital marketing channel?
It depends on the goal. For long-term ROI, SEO delivers 53% of website traffic at no per-click cost. For immediate ROI, email marketing returns $36-42 per $1 spent. For engagement, short-form video on TikTok and Instagram Reels drives 2.5x more interaction than static content. Most successful strategies combine multiple channels.
How is AI changing digital marketing?
72% of marketers now use AI tools, primarily for content creation (48%), email optimization, and ad targeting. AI saves marketers 40% of time on content creation and reduces cost per acquisition by 20-30% through automated creative testing. However, 67% cite data quality as the biggest barrier to full AI adoption. The AI in marketing market is valued at $36 billion and growing rapidly.
Is email marketing still effective in 2026?
Absolutely. Email marketing delivers the highest ROI of any digital channel at $36-42 per $1 spent. Segmented campaigns drive 760% more revenue than generic blasts, and 77% of marketers report increasing email engagement. With 4.5 billion email users worldwide, the channel continues to grow. Check our lead generation statistics for more on how email drives conversions.
For more data on the marketing landscape, explore our advertising statistics, online shopping statistics, and lead generation statistics.
Related Posts


Comments (0)