Skip to content
Our free WordPress themes are downloaded over 7 MILLION times. Get them now!

75+ Instagram Engagement Rate Statistics & Benchmarks (2026)

Brand posts on Instagram averaged a 0.48% engagement rate in 2025, and Rival IQ’s all-industry median slipped 17% to 0.30%. Carousels now edge out Reels, image engagement is falling fastest, and smaller accounts still post the highest rates. Here are 75+ Instagram engagement statistics covering benchmarks by content type, follower count, industry, posting times, and advertising for 2026.

Key Instagram Engagement Statistics (2026)

  • Average brand engagement rate: 0.48% per post in 2025 (Socialinsider)
  • Carousel engagement: 0.55%, the highest of any format (Socialinsider)
  • Reels engagement: 0.52%, up 4% year over year (Socialinsider)
  • Image engagement: 0.37%, down 18% year over year (Socialinsider)
  • All-industry median engagement: 0.30%, down from 0.36% (Rival IQ)
  • 3 billion+ monthly active users and 2 billion daily actives (Meta)
  • Instagram is used by 70% of marketers, more than any other platform (HubSpot)

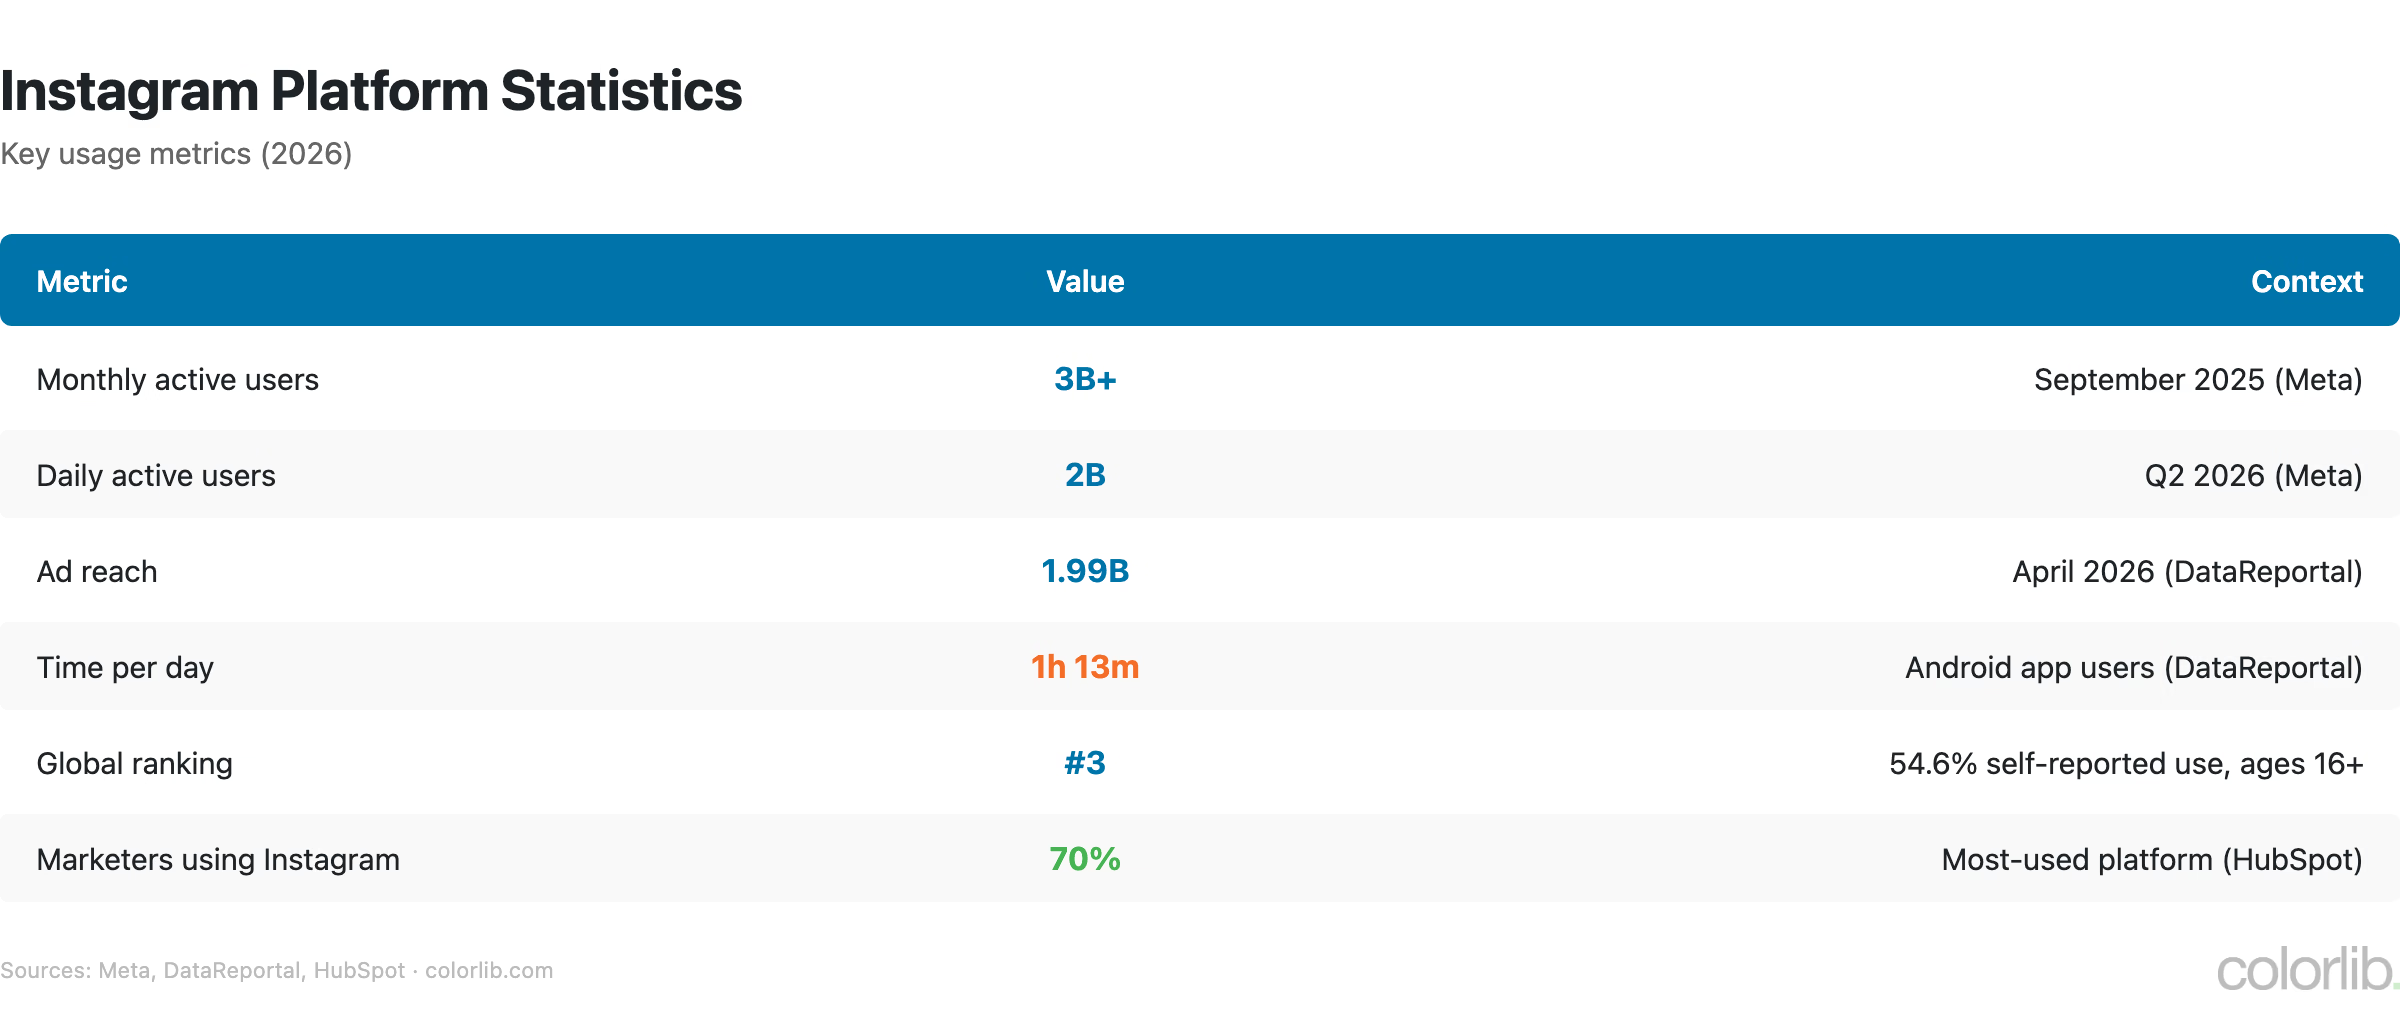
Instagram Usage Statistics

Table of Instagram usage statistics, 3 billion monthly and 2 billion daily active users, 1h 13m daily time, used by 70% of marketers
MetricValueSource
Monthly active users3 billion+ (Sept 2025)Meta
Daily active users2 billion (Q2 2026)Meta
Time per day (Android app users)1h 13mDataReportal
Global ranking (self-reported use, 16+)#3 social platform (54.6%)DataReportal
Time spent growth (Q2 2026)Double digits YoYMeta
Marketers using Instagram70%HubSpot
Ad reach (April 2026)1.99 billionDataReportal

Instagram Demographics

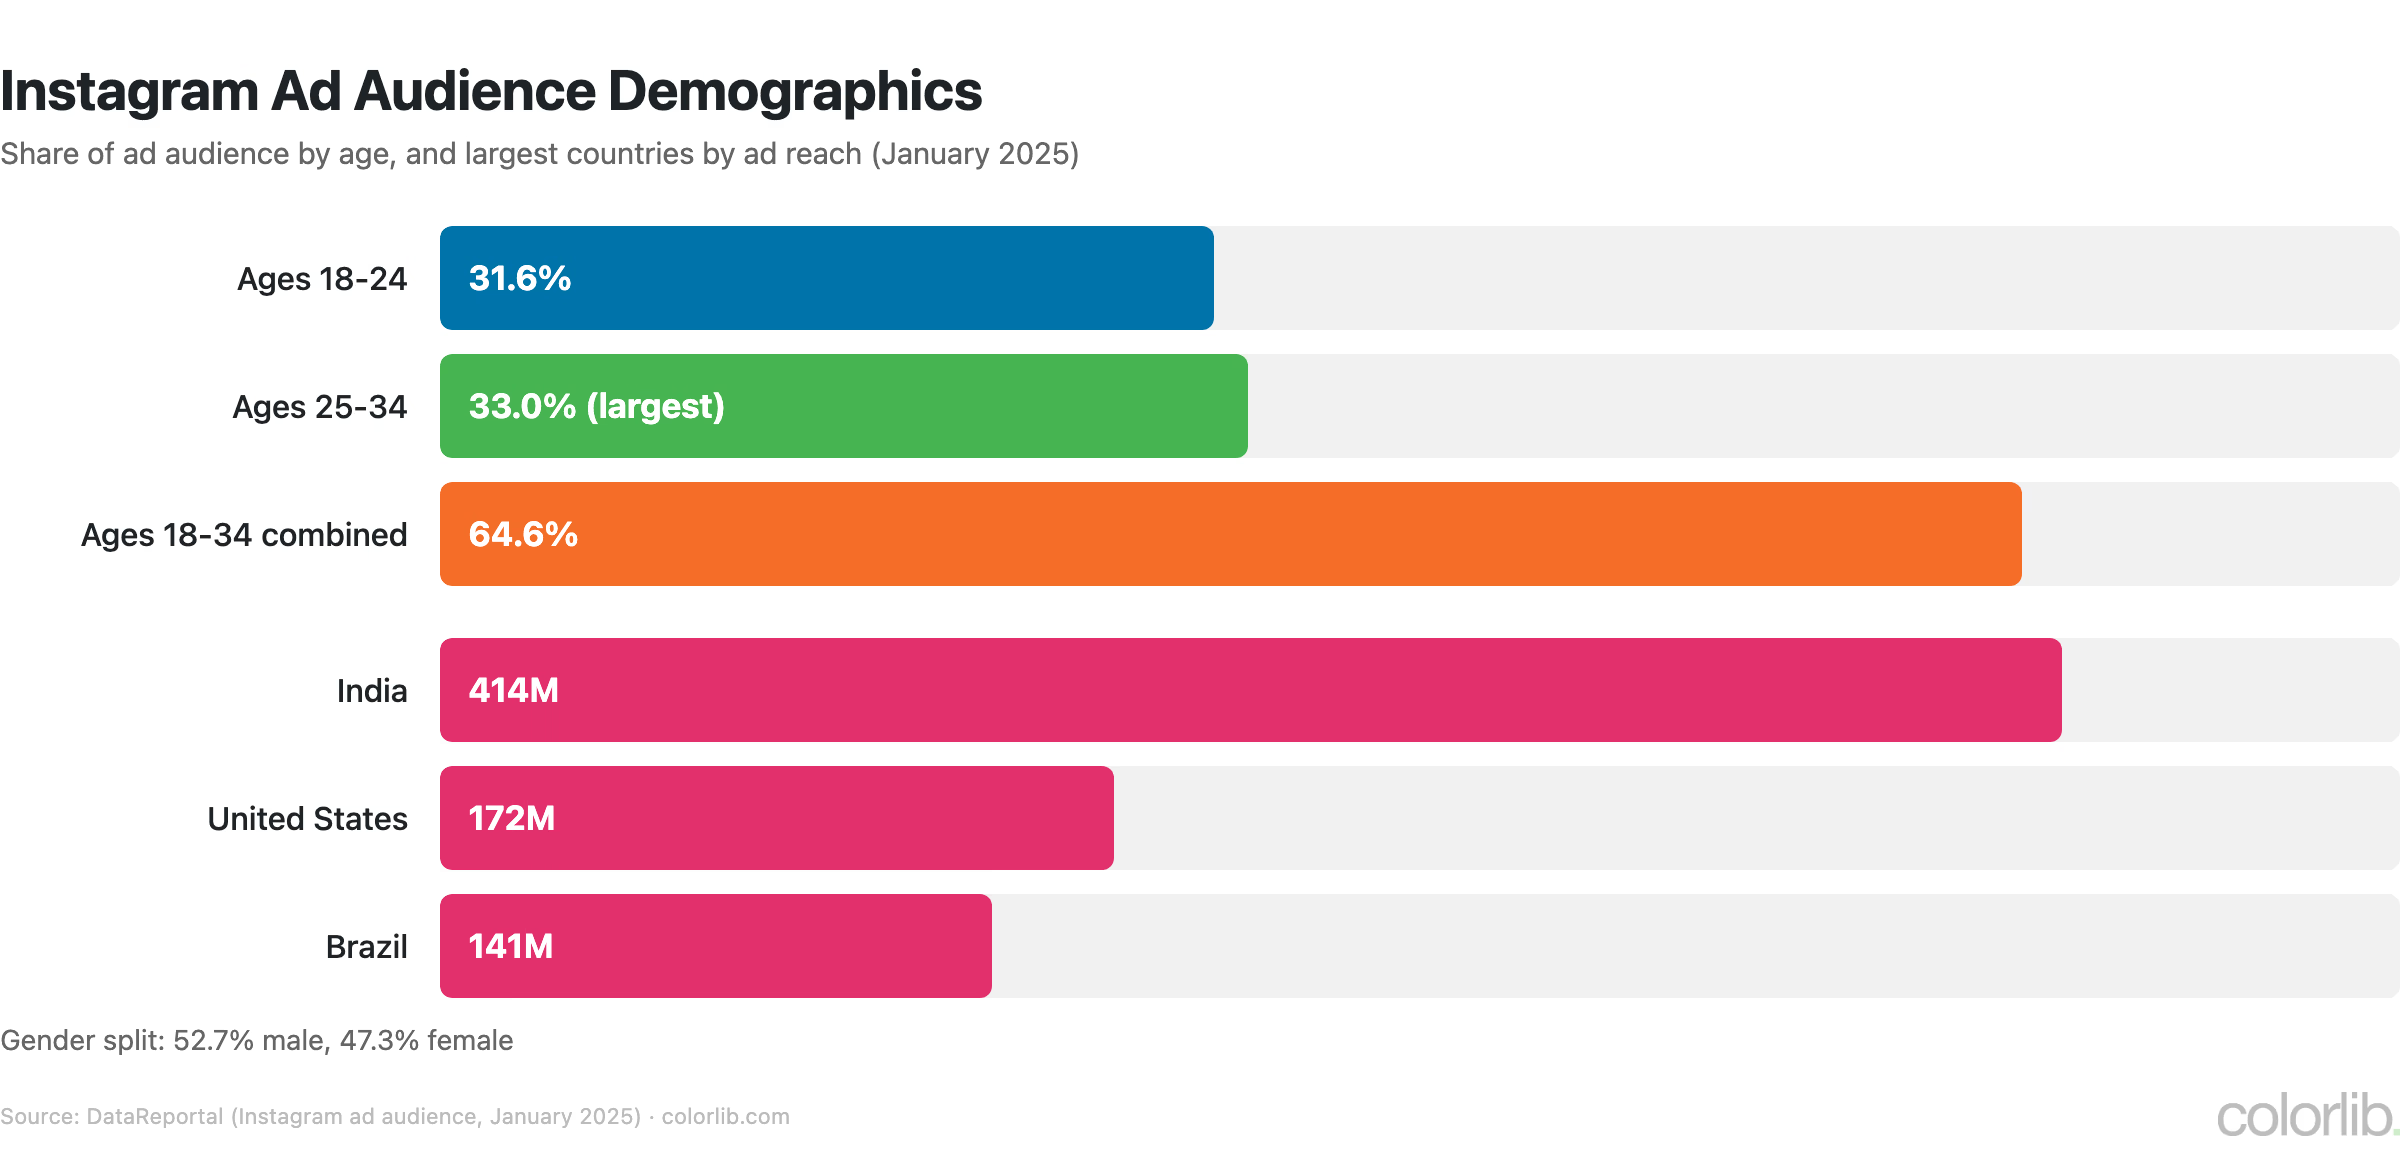
Bar chart of Instagram ad audience by age group and top countries, India 414 million, US 172 million, Brazil 141 million
DemographicValue
Ad audience aged 18-3464.6%
18-24 age group31.6%
25-34 age group (largest)33.0%
Gender split52.7% male, 47.3% female
#1 country: India414 million
#2 country: US172 million
#3 country: Brazil141 million
Source: DataReportal (Instagram ad audience, January 2025)

Engagement Rate by Content Type

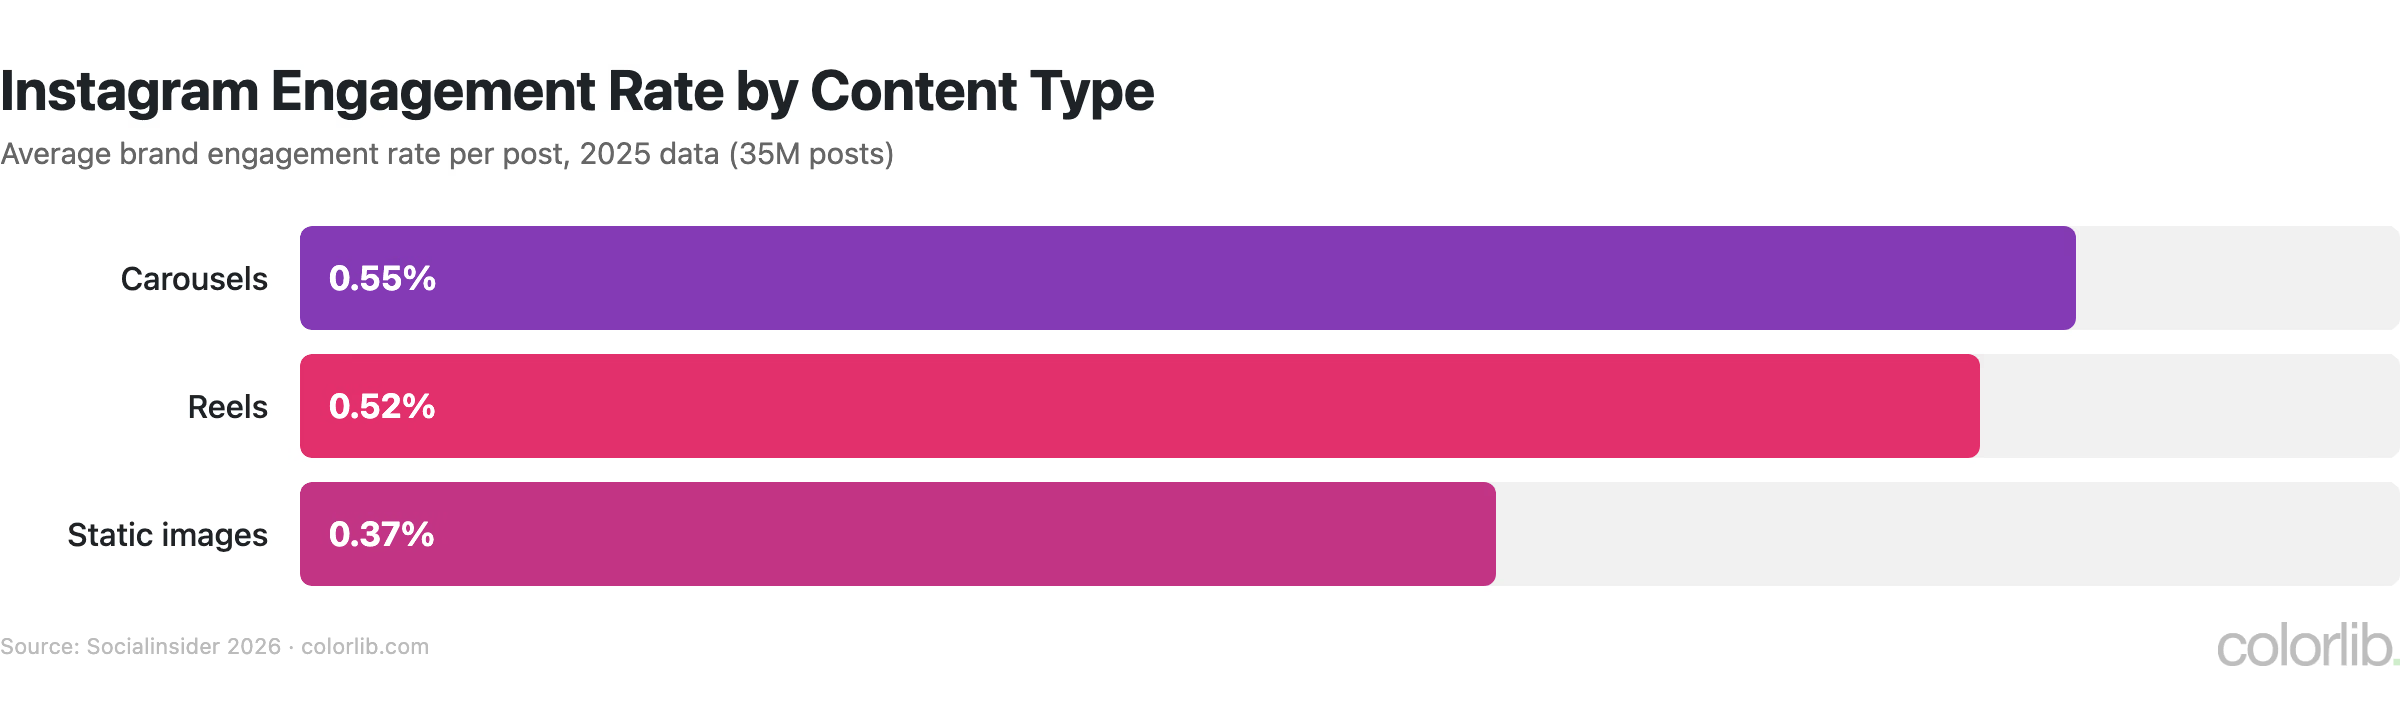
Bar chart of Instagram engagement rate by content type in 2025, carousels 0.55%, Reels 0.52%, static images 0.37%
Content TypeAvg Engagementvs Static Images
Carousels0.55%🟢 +49%
Reels0.52%🟢 +41%
Static images0.37%Baseline
Source: Socialinsider 2026 (2025 data, 35M posts)
  • Carousels were the most resilient format in 2025, holding at 0.55% while image engagement fell 18% (Socialinsider)
  • Reels engagement rose 4% to 0.52%, the only format to grow (Socialinsider)
  • Instagram time spent grew double digits year over year in Q2 2026, which Meta credits to better Feed and Reels recommendations (Meta)
  • Brands publish about 8 Reels, 7 images and 5 carousels per month (Socialinsider)

Engagement Rate by Follower Count

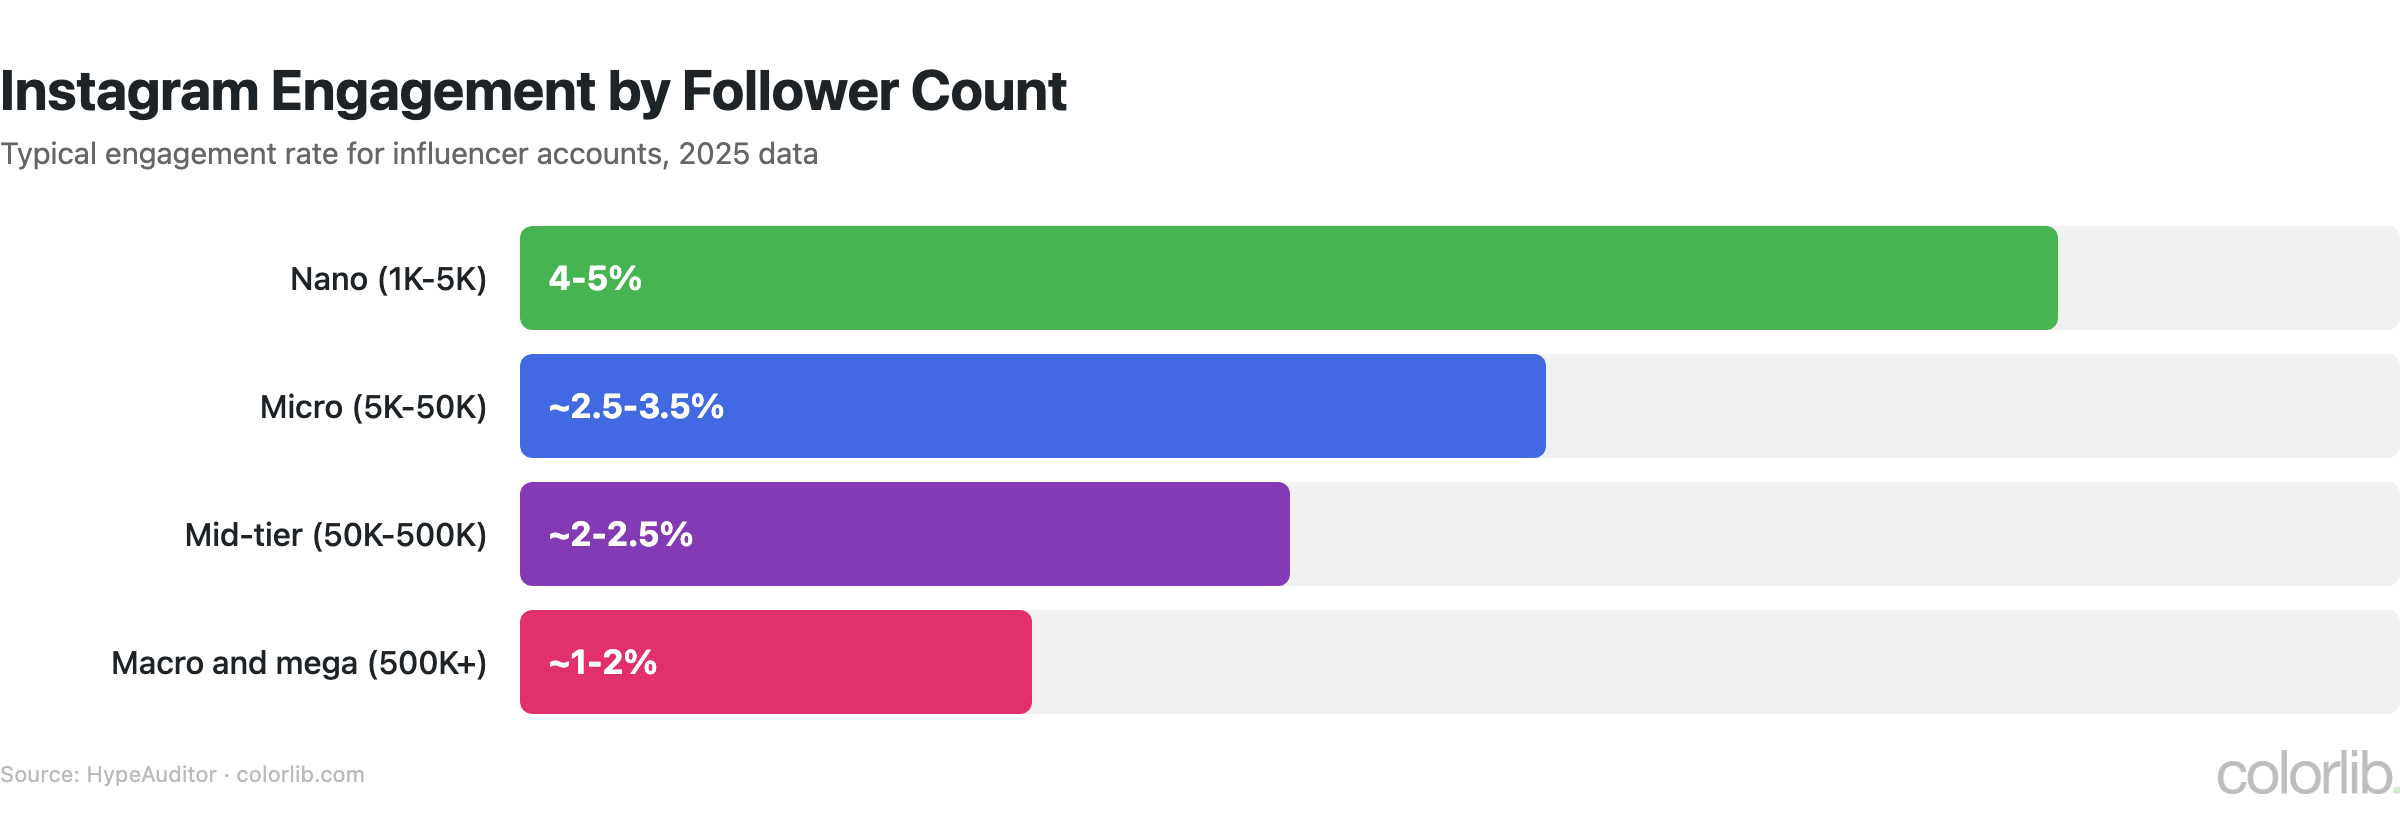
Bar chart of Instagram engagement rate by follower tier, from 4-5% for nano accounts to about 1-2% for 500K+ accounts
TierFollowersAvg Engagement
Nano1K-5K4-5%
Micro5K-50K~2.5-3.5%
Mid-tier50K-500K~2-2.5%
Macro and mega500K+~1-2%
Source: HypeAuditor (influencer accounts, 2025 data)
  • Engagement falls steadily as follower counts rise: accounts with 1K-5K followers engage at roughly 4-5%, against about 1-2% for 500K+ (HypeAuditor)
  • Brand accounts grow more slowly too: profiles with 1K-5K followers grew their audience 22% in 2025, versus 11.25% for 100K-1M (Socialinsider)

Engagement Rate by Industry

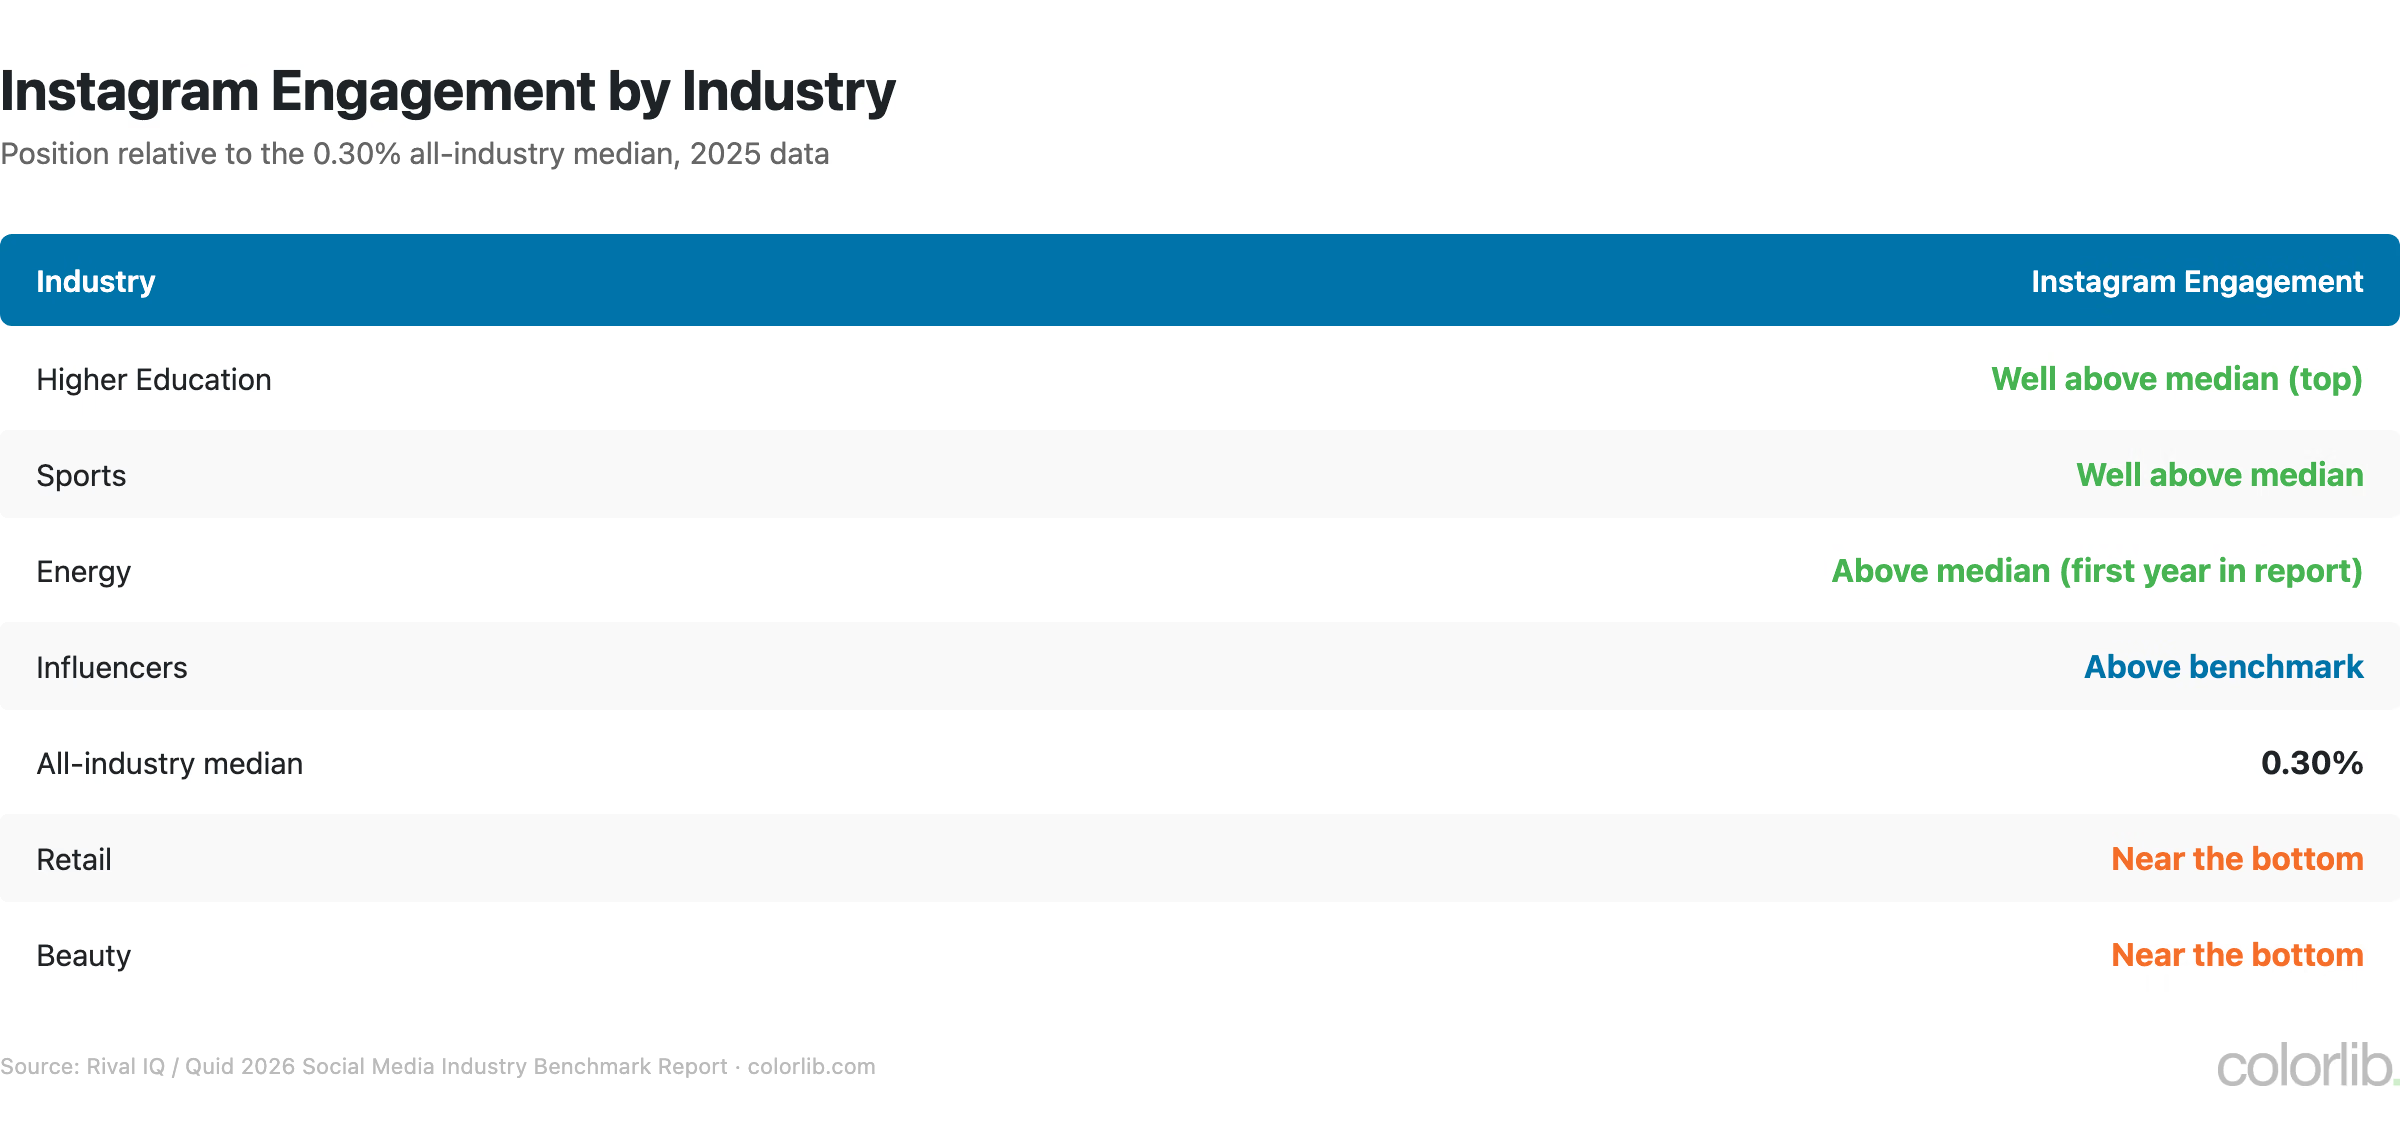
Table ranking Instagram engagement by industry against the 0.30% all-industry median, Higher Education and Sports on top
IndustryInstagram Engagement
Higher EducationWell above median (top)
SportsWell above median
EnergyAbove median (first year in report)
InfluencersAbove benchmark
All-industry median0.30%
RetailNear the bottom
BeautyNear the bottom
Source: Rival IQ / Quid 2026 Social Media Industry Benchmark Report (2025 data)

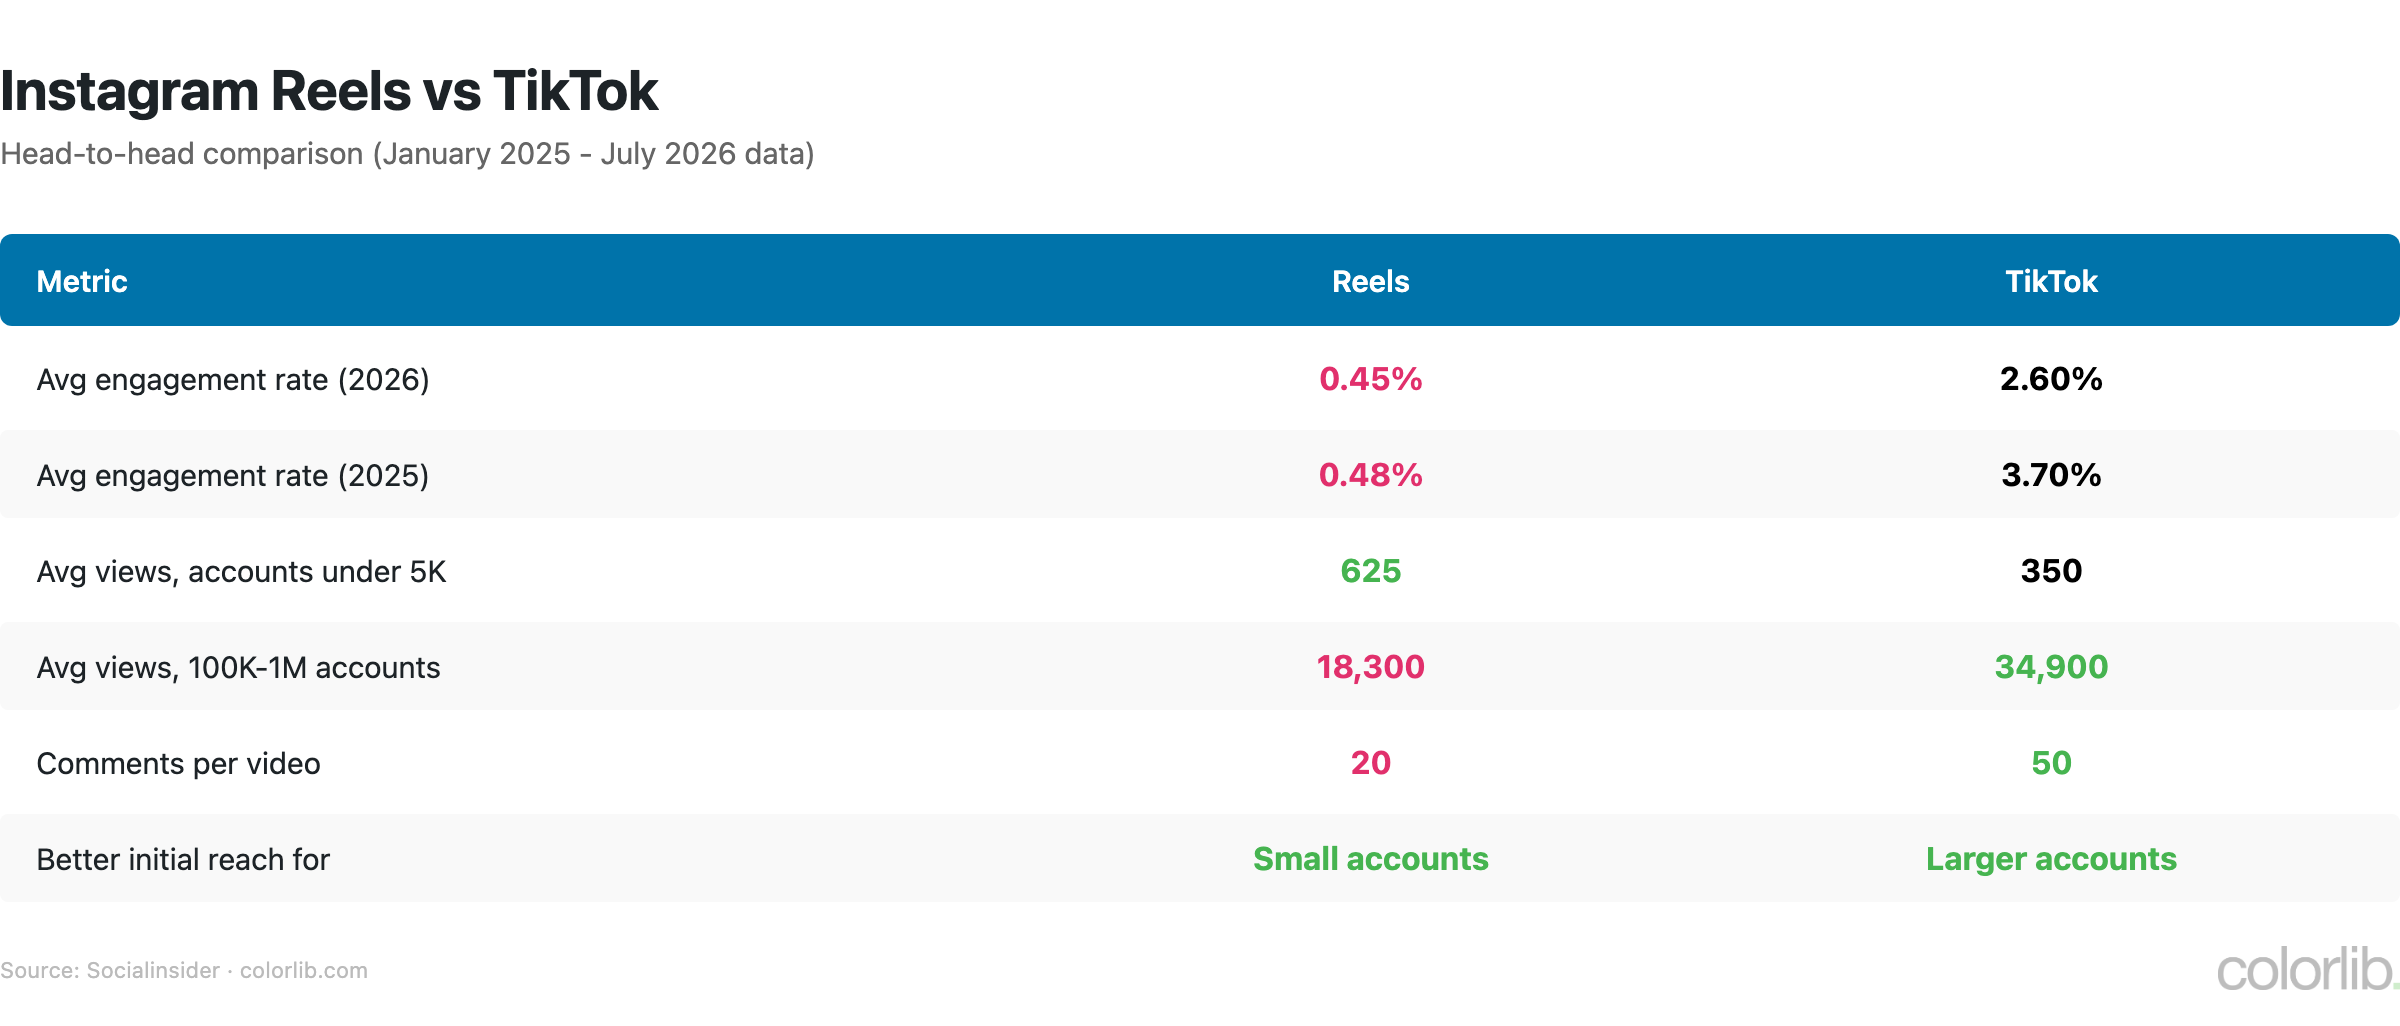
Instagram Reels vs TikTok

Table comparing Instagram Reels and TikTok engagement rate, views and comments, TikTok 2.60% vs Reels 0.45% in 2026
MetricInstagram ReelsTikTok
Avg engagement rate (2026)0.45%2.60%
Avg engagement rate (2025)0.48%3.70%
Avg views, accounts under 5K625350
Avg views, 100K-1M accounts18,30034,900
Comments per video2050
Better initial reach forSmall accountsLarger accounts
Source: Socialinsider (January 2025 – July 2026)

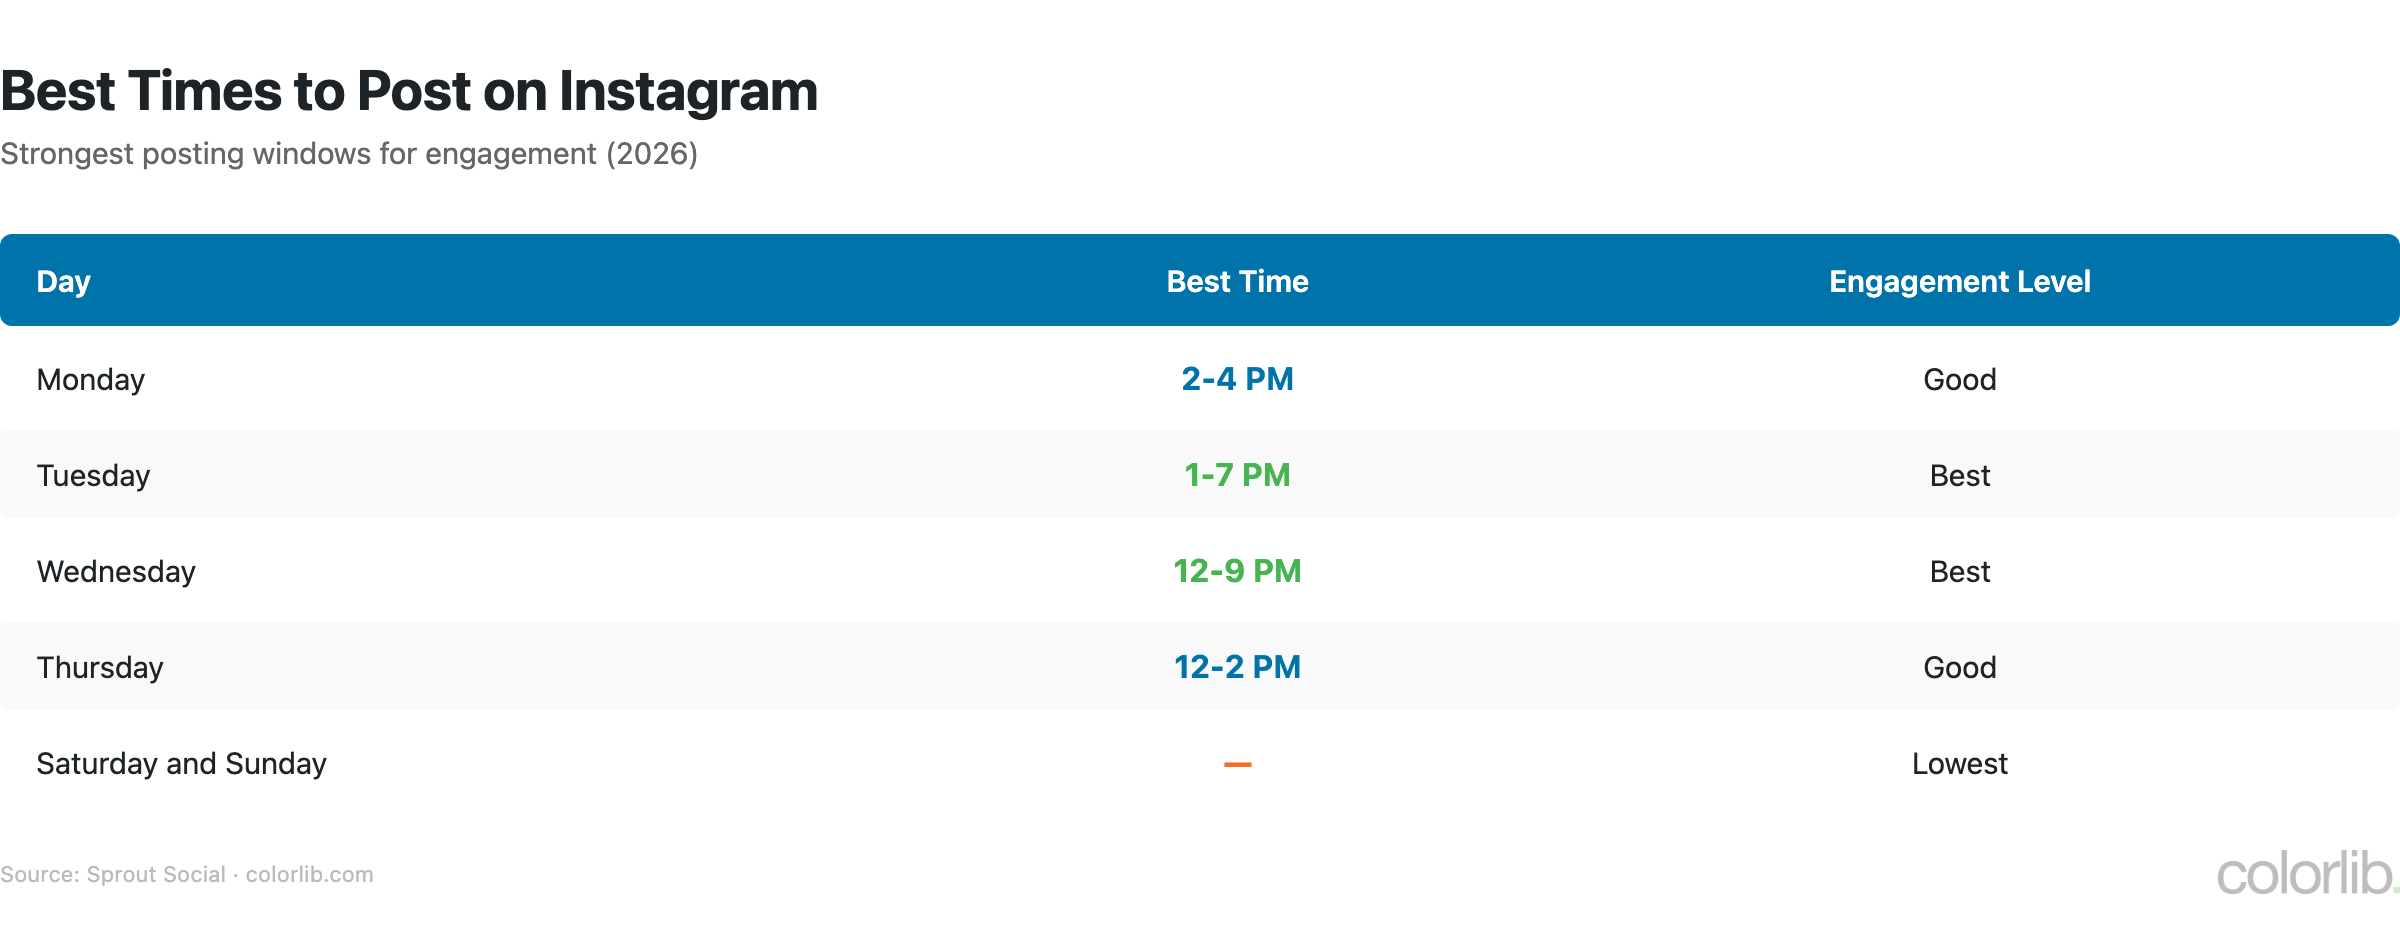
Best Times to Post

Table of best times to post on Instagram, Tuesday 1-7 PM and Wednesday 12-9 PM strongest, weekends lowest
  • Best times: Tuesdays 1-7 PM and Wednesdays 12-9 PM, plus Mondays 2-4 PM and Thursdays 12-2 PM (Sprout Social)
  • Best days: Tuesday and Wednesday
  • Worst days: Saturday and Sunday
  • Typical frequency: brands post a median 3.7 times per week, a six-year low (Rival IQ)

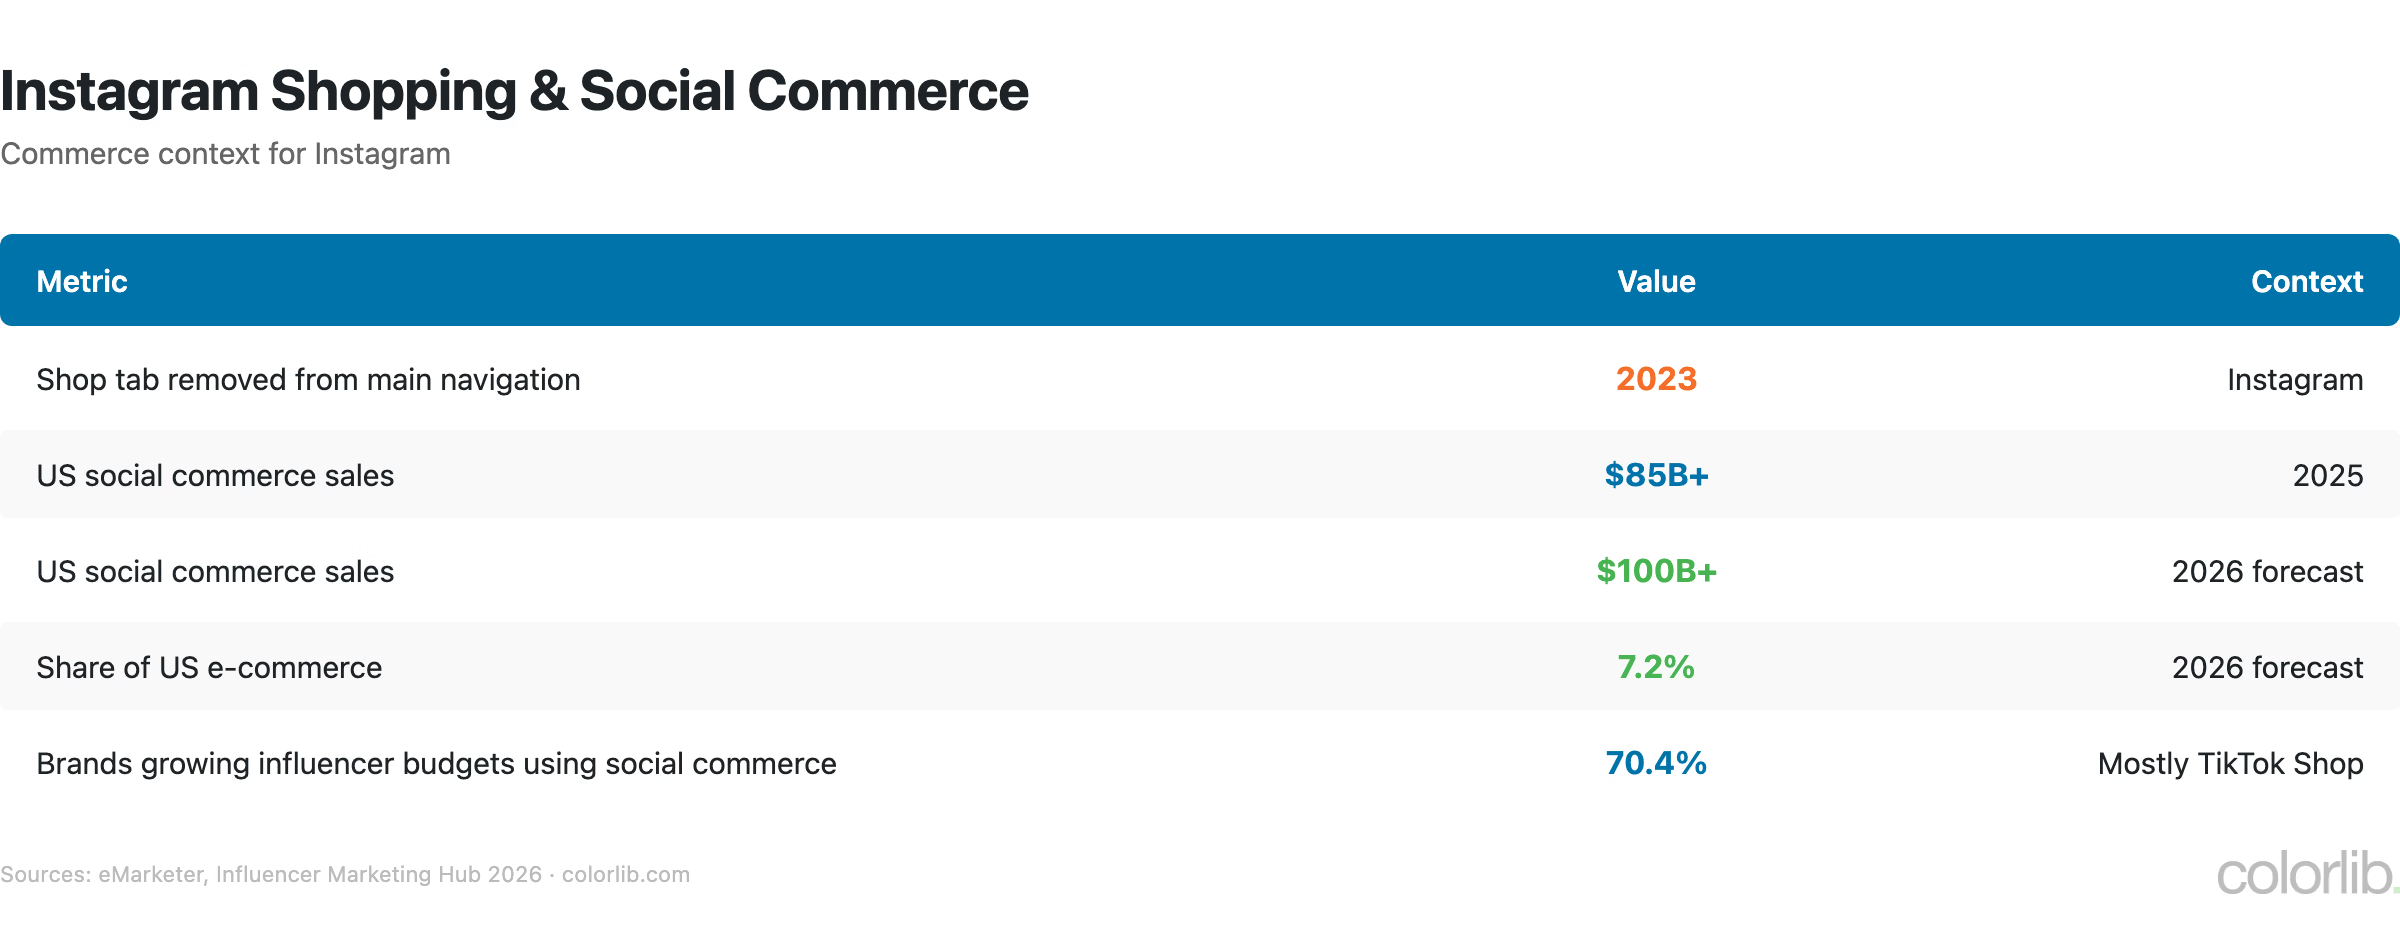
Instagram Shopping & Ecommerce

Table of Instagram shopping and US social commerce statistics, $85 billion in 2025 and $100 billion forecast for 2026
MetricValue
Instagram Shop tab removed from main navigation2023
US social commerce sales (2025)$85+ billion
US social commerce sales (2026 forecast)$100+ billion
Share of US e-commerce (2026 forecast)7.2%
Brands growing influencer budgets that use social commerce70.4%, mostly TikTok Shop
Sources: eMarketer, Influencer Marketing Hub 2026

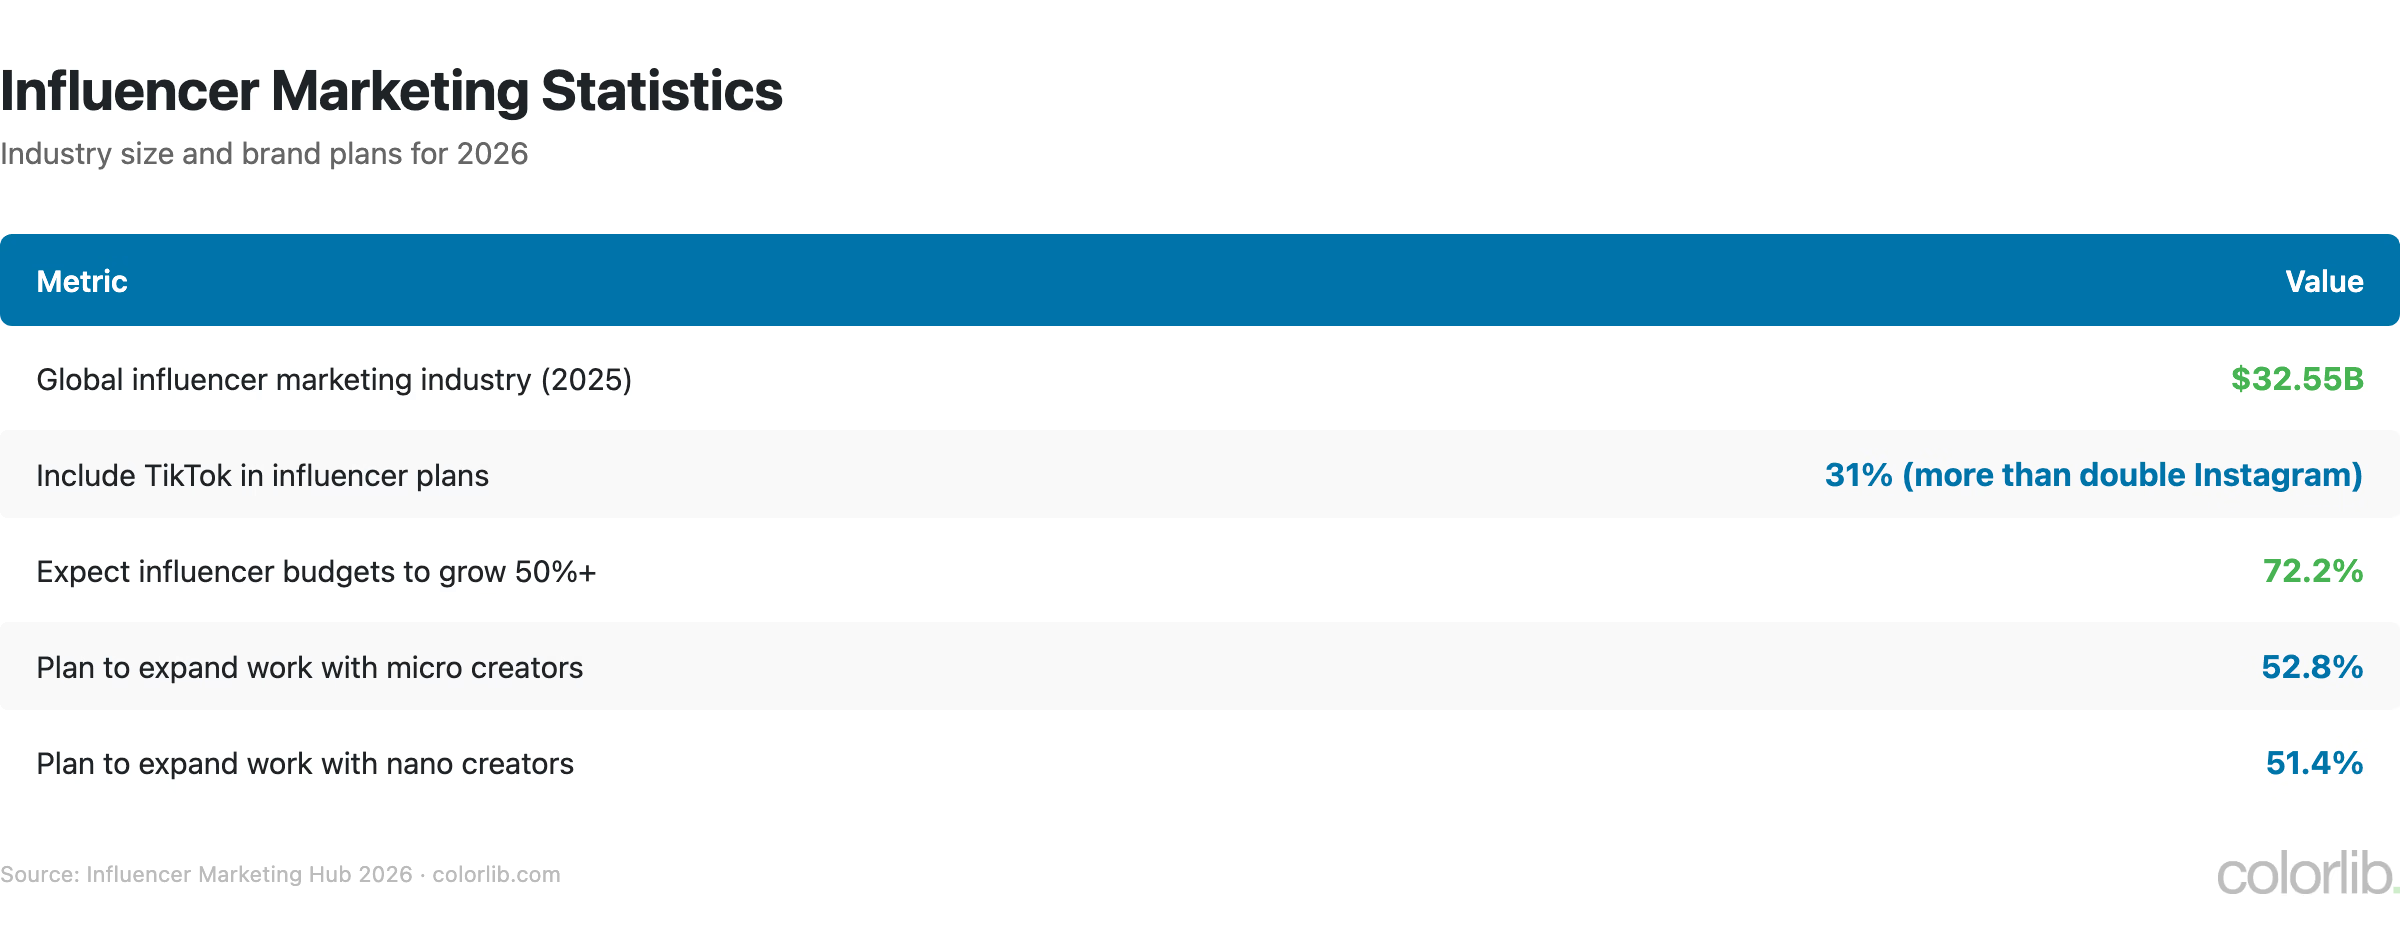
Influencer Marketing on Instagram

Table of influencer marketing statistics, $32.55 billion industry in 2025 and brand budget plans for 2026
MetricValue
Global influencer marketing industry$32.55 billion (2025)
Respondents including TikTok in influencer plans31%, more than double Instagram
Expect influencer budgets to grow 50%+72.2%
Plan to expand work with nano creators51.4%
Plan to expand work with micro creators52.8%
Source: Influencer Marketing Hub 2026

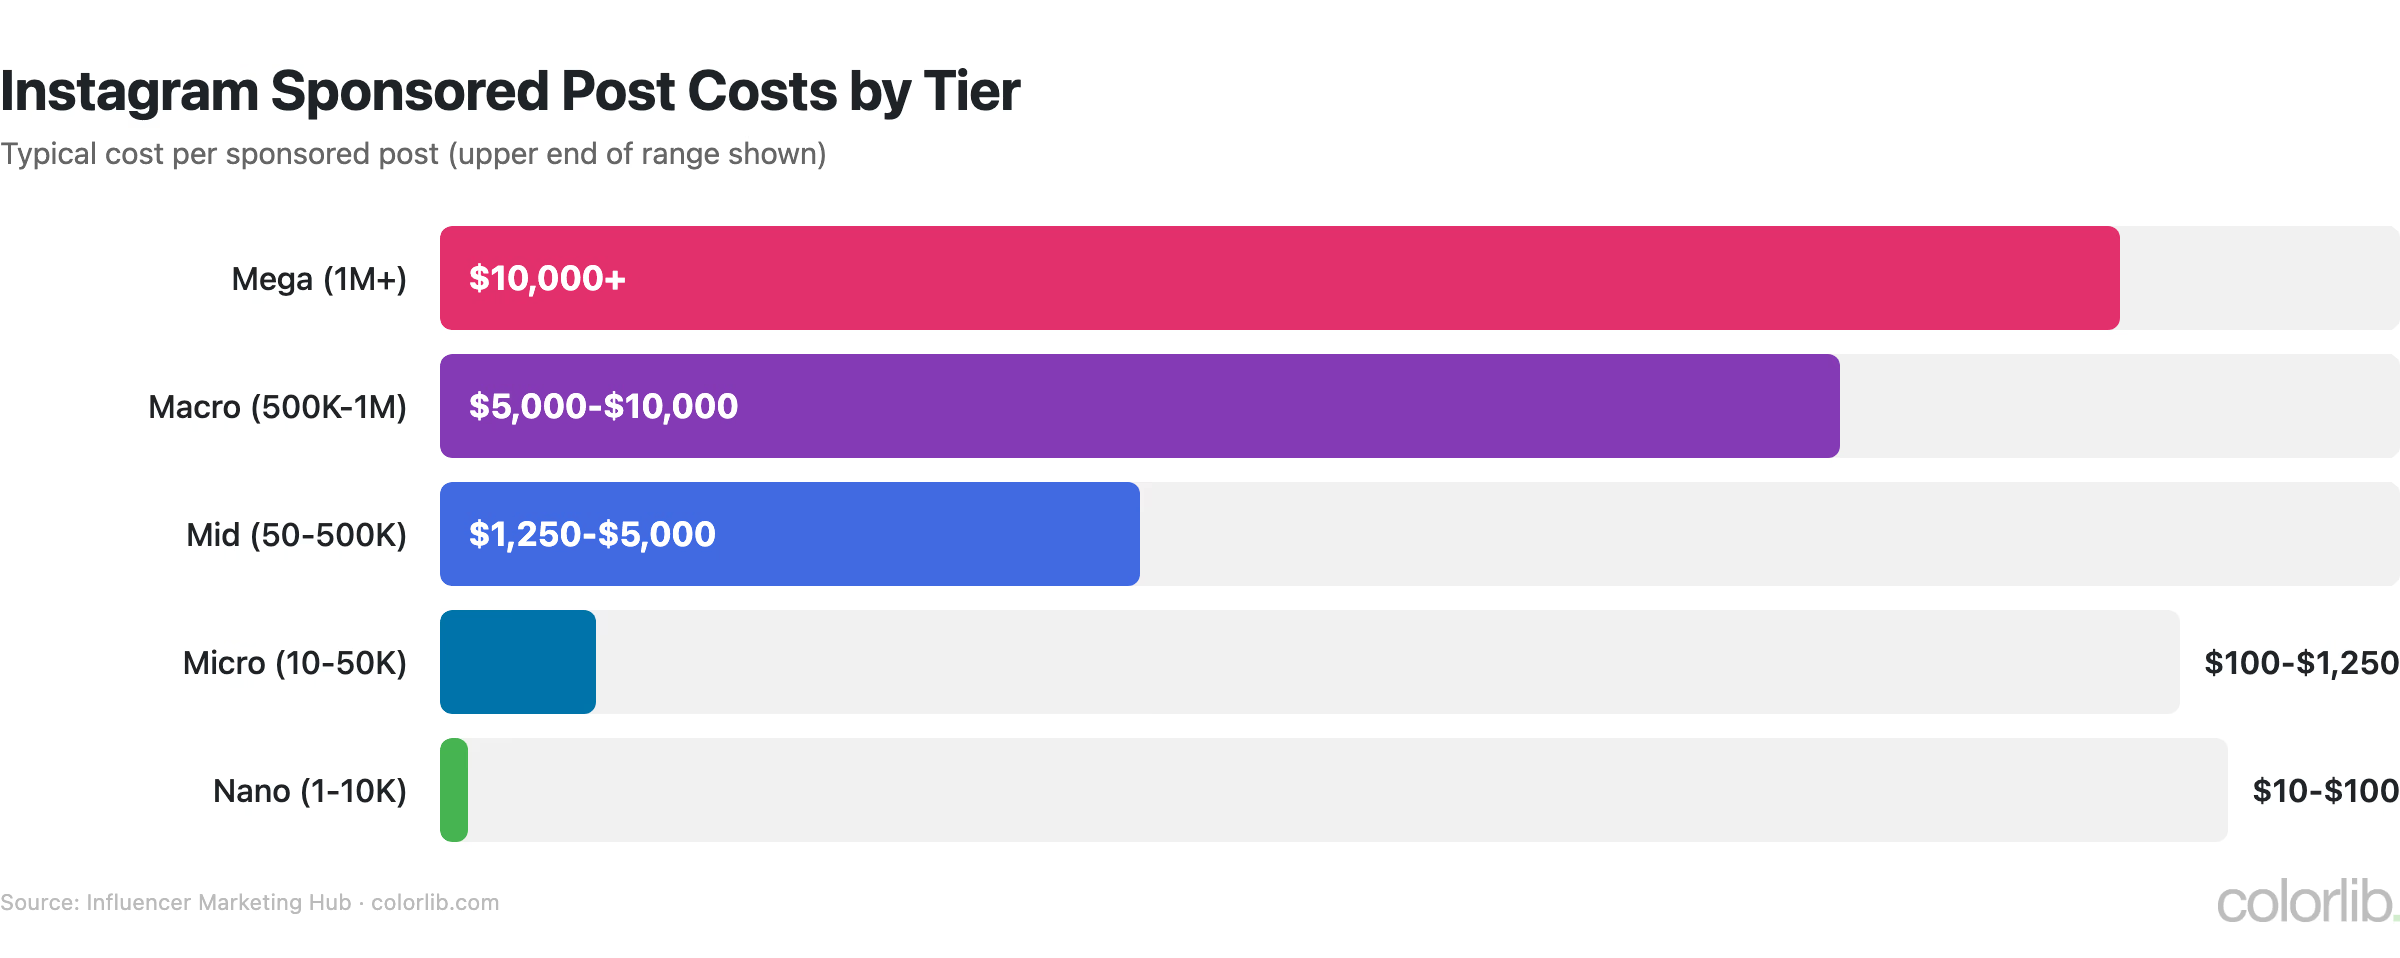
Sponsored post costs by tier

Bar chart of Instagram sponsored post costs by influencer tier, from $10-$100 for nano to $10,000+ for mega
TierCost per Post
Nano (1-10K)$10-$100
Micro (10-50K)$100-$1,250
Mid (50-500K)$1,250-$5,000
Macro (500K-1M)$5,000-$10,000
Mega (1M+)$10,000+
Source: Influencer Marketing Hub

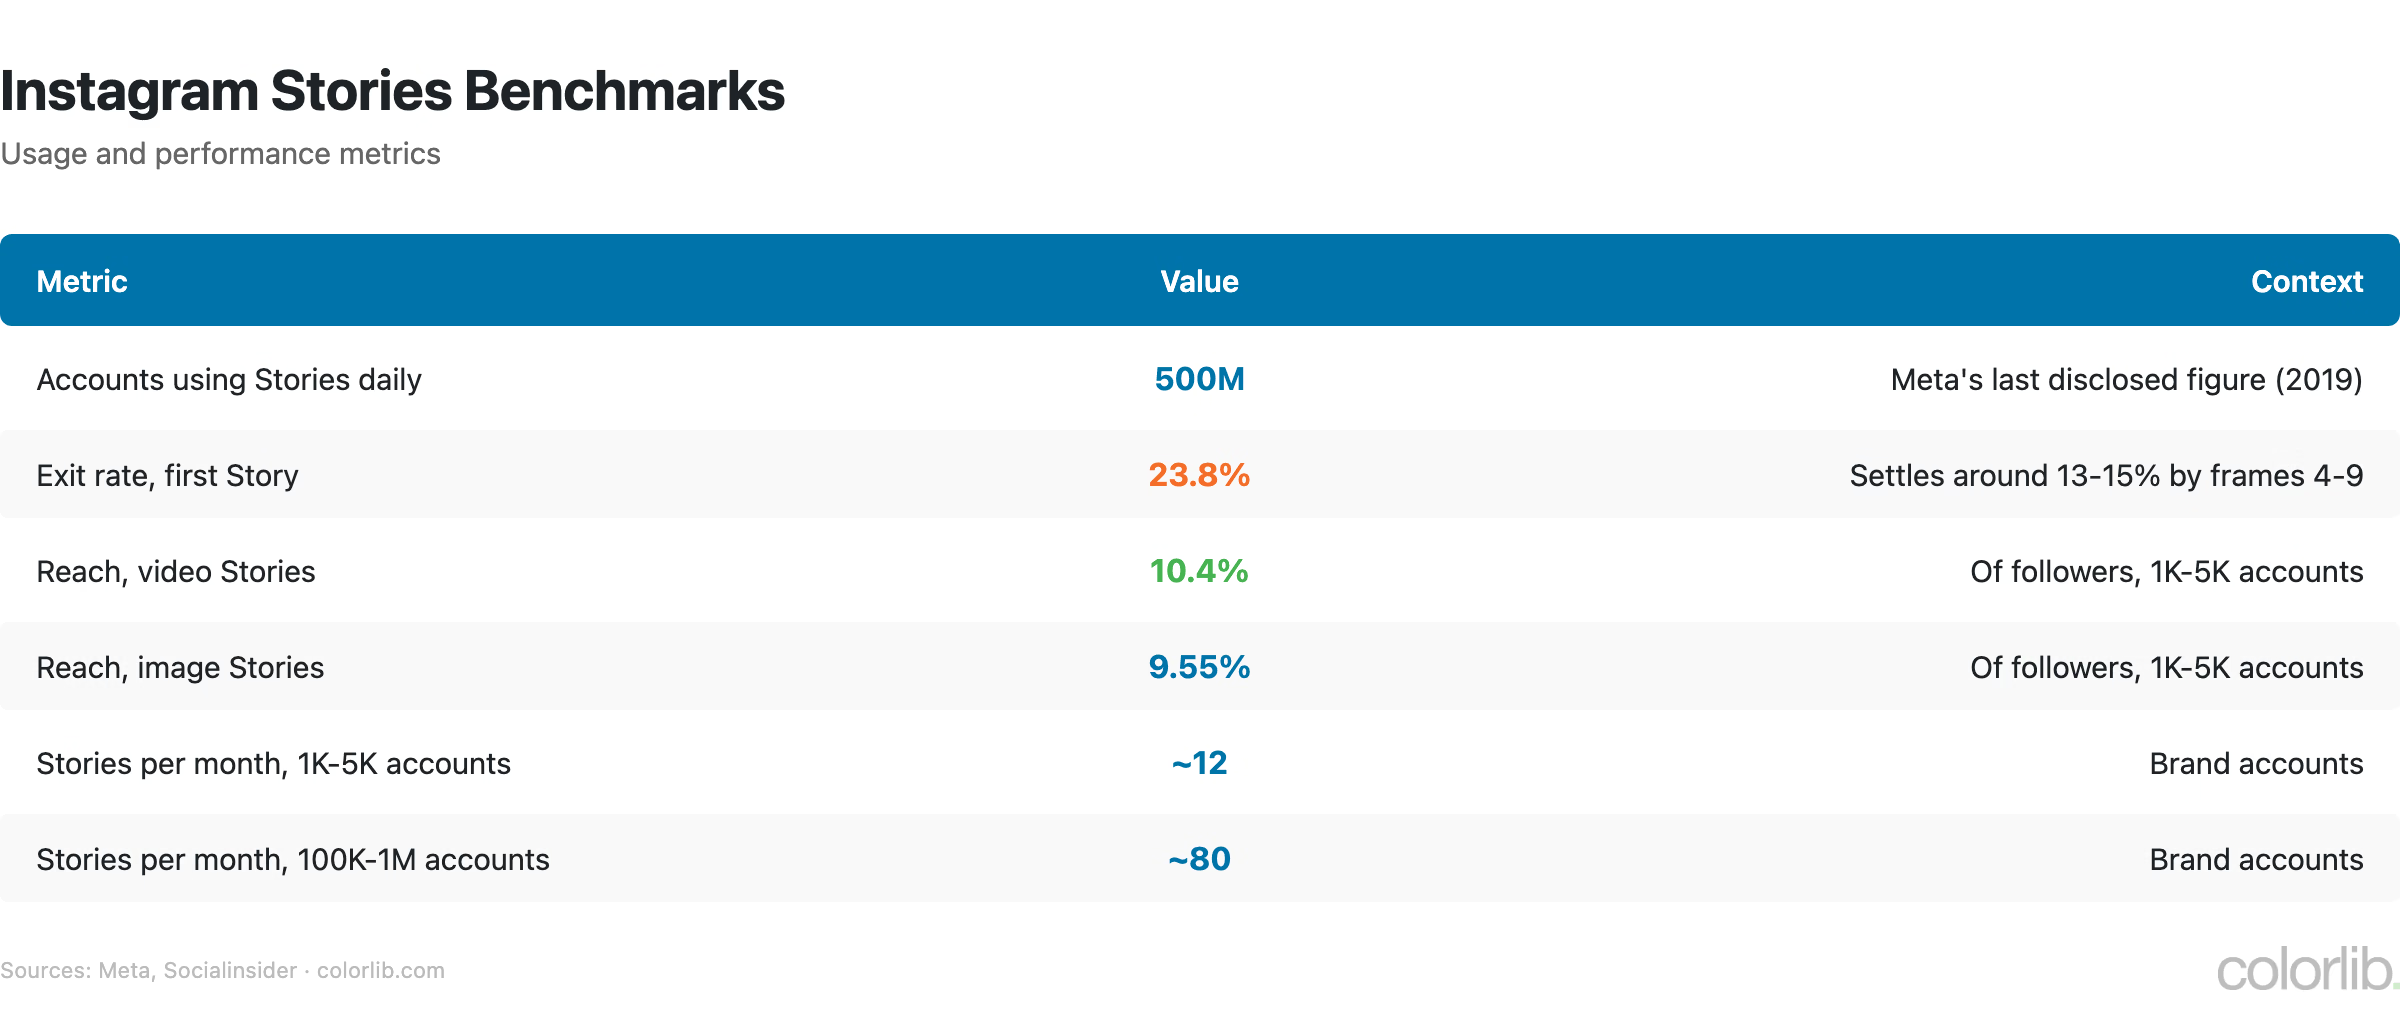
Instagram Stories Benchmarks

Table of Instagram Stories benchmarks, including exit rates, reach for video and image Stories, and posting frequency
  • Meta’s last disclosed figure was 500 million accounts using Stories daily (2019)
  • Exit rate starts at 23.8% on the first Story and settles around 13-15% by frames 4-9 (Socialinsider)
  • Accounts with 1K-5K followers reach about 10.4% of followers with video Stories versus 9.55% with images (Socialinsider)
  • Exit rates rose across the board in 2025, as viewers got more selective (Socialinsider)
  • Polls and other interactive stickers help re-engage viewers in later frames (Socialinsider)
  • Brands with 1K-5K followers post about 12 Stories/month; 100K-1M accounts post about 80 (Socialinsider)

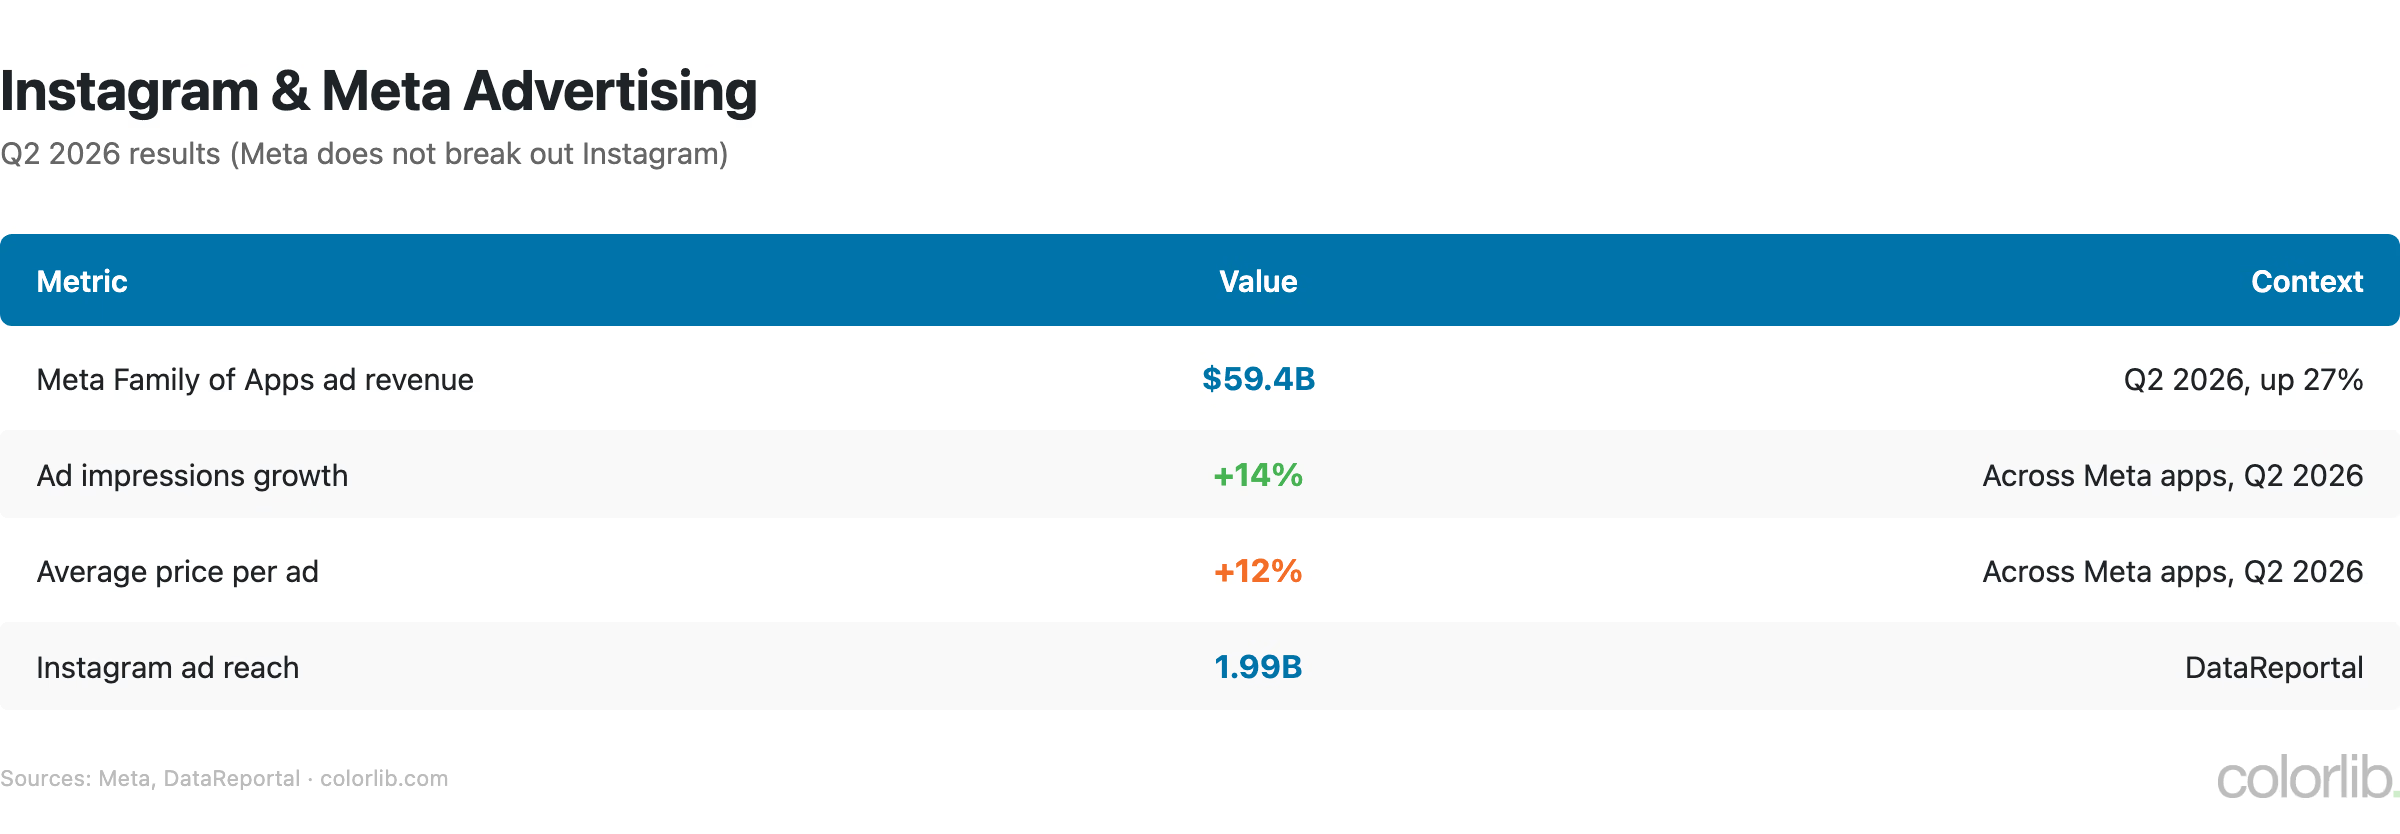
Instagram Advertising Statistics

Table of Meta and Instagram advertising results for Q2 2026, $59.4 billion ad revenue, impressions up 14%, price per ad up 12%
  • Meta’s Family of Apps ad revenue: $59.4 billion in Q2 2026, up 27% (Meta does not break out Instagram) (Meta)
  • Ad impressions across Meta’s apps grew 14% and average price per ad rose 12% in Q2 2026 (Meta)
  • Instagram ads reach 1.99 billion users (DataReportal)

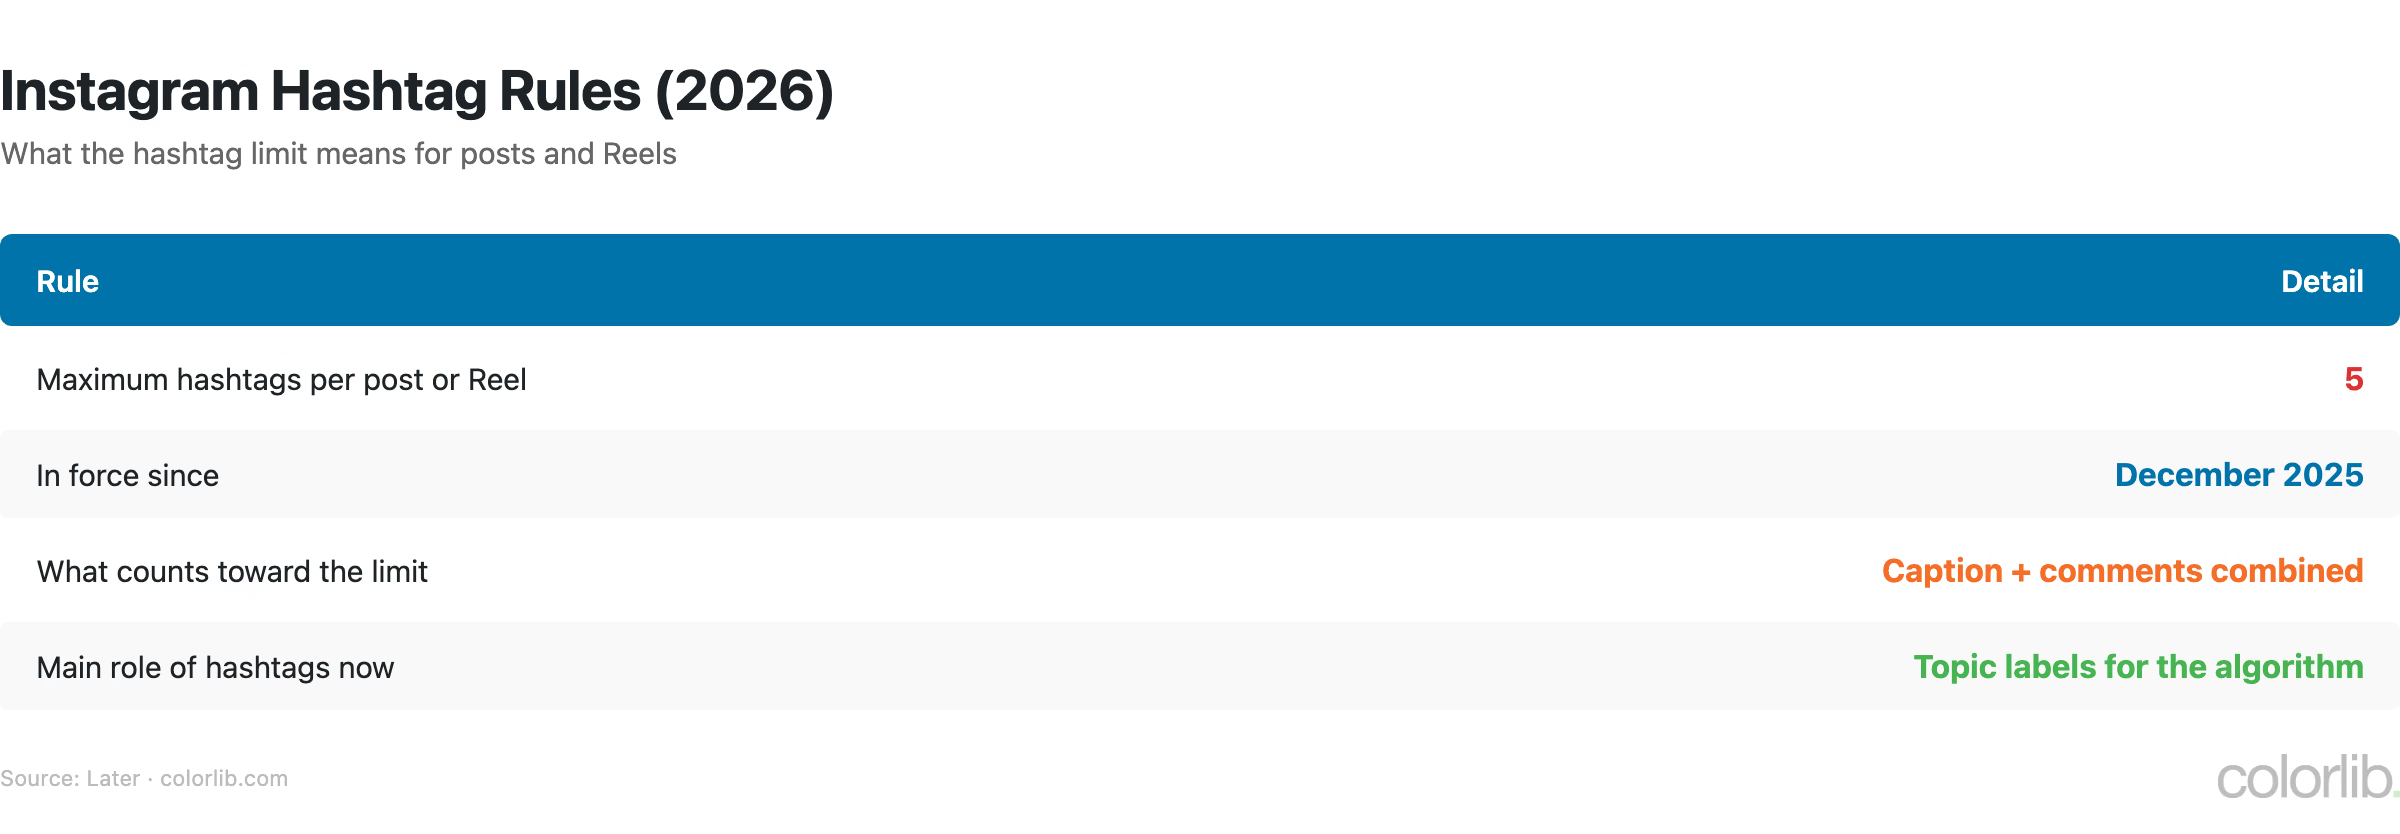
Hashtag Performance

Table of Instagram hashtag rules, a limit of 5 hashtags per post or Reel since December 2025
  • Instagram enforces a hard limit of 5 hashtags per post and Reel since December 2025 (Later)
  • The limit covers caption and comments together, so moving tags to the first comment does not add slots (Later)
  • Hashtags now work mainly as topic labels for the algorithm, while content quality and engagement signals carry more weight (Later)

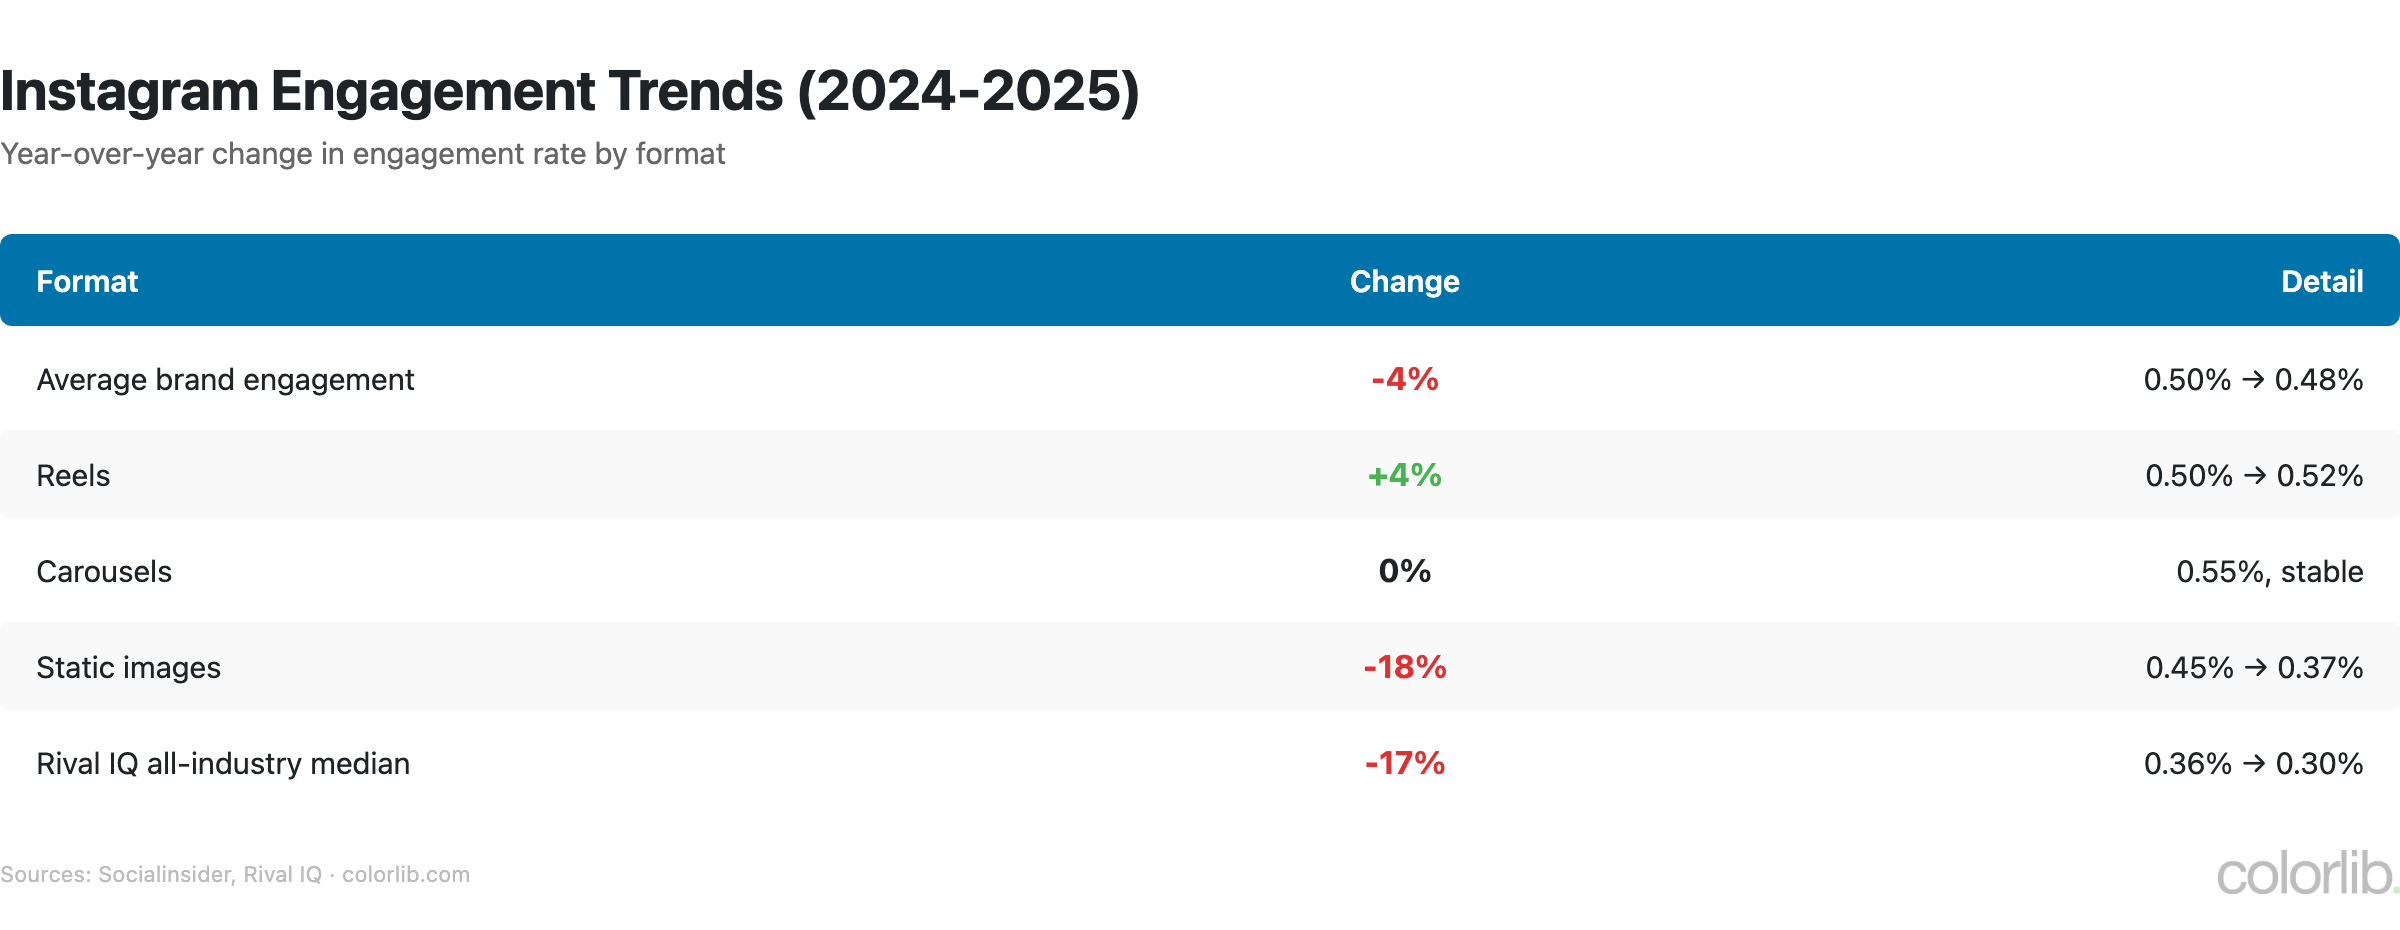
Year-Over-Year Engagement Trends

Table of year-over-year Instagram engagement changes from 2024 to 2025 by format
FormatChange (2024 → 2025)
Average brand engagement🔴 -4% (0.50% → 0.48%)
Reels🟢 +4% (0.50% → 0.52%)
Carousels— 0% (0.55%, stable)
Static images🔴 -18% (0.45% → 0.37%)
Rival IQ all-industry median🔴 -17% (0.36% → 0.30%)
Sources: Socialinsider, Rival IQ

Key Takeaways

  1. Carousels and Reels lead, images fade. Carousels (0.55%) and Reels (0.52%) held up in 2025 while image engagement fell 18%.
  2. Smaller accounts win on engagement. Accounts with 1K-5K followers engage at roughly 4-5%, against about 1-2% for 500K+.
  3. Five hashtags is now the ceiling. Instagram caps posts and Reels at 5 hashtags, so pick precise topic labels.
  4. Carousels are underrated. They are the most-saved and most resilient format, yet brands post them least often.
  5. TikTok still out-engages Reels. TikTok averages 2.60% engagement against 0.45% for Reels in 2026, though Reels gives small accounts better early reach.
  6. Paid reach is getting pricier. Meta’s average price per ad rose 12% in Q2 2026, so organic formats that earn saves and shares matter more.

Sources

Frequently Asked Questions

What is a good Instagram engagement rate in 2026?

Brand posts averaged 0.48% in 2025 (Socialinsider), and Rival IQ’s all-industry median was 0.30%. For a brand account, anything above 0.5% beats the average and above 1% is strong. Carousels (0.55%) and Reels (0.52%) perform best, and small creator accounts with 1K-5K followers typically see 4-5%.

Which content type gets the most engagement?

Carousels at 0.55%, narrowly ahead of Reels at 0.52%, based on Socialinsider’s analysis of 35 million posts from 2025. Static images get just 0.37%, down 18% in a year.

Are Instagram engagement rates declining?

Yes, slowly. Rival IQ’s all-industry median fell about 17% to 0.30% in 2025, and Socialinsider’s average slipped from 0.50% to 0.48%. Static image engagement fell 18%, while Reels grew 4% and carousels held steady.

What industry has the highest Instagram engagement?

Higher Education and Sports lead Rival IQ’s 2026 benchmark, both well above the 0.30% all-industry median, and Energy made a strong debut. Retail and Beauty sit near the bottom.

What are the best times to post on Instagram?

Tuesdays 1-7 PM and Wednesdays 12-9 PM are the strongest windows in Sprout Social’s 2026 data, with Mondays 2-4 PM and Thursdays 12-2 PM close behind. Weekends have the lowest engagement. The median brand posts about 3.7 times per week.

How many hashtags should I use?

Up to 5, because that is now the limit. Since December 2025 Instagram caps posts and Reels at 5 hashtags, counted across the caption and comments together. Choose specific tags that describe the topic rather than broad, crowded ones.

Was this article helpful?
YesNo

Comments (0)

Leave a Reply

Your email address will not be published. Required fields are marked *

Back To Top

Download this template

Enter your email to get the free download link. We'll also send you occasional updates about new templates.

If you wish to withdraw your consent and stop hearing from us, simply click the unsubscribe link at the bottom of every email we send or contact us at [email protected]. We value and respect your personal data and privacy. To view our privacy policy, please visit our website. By submitting this form, you agree that we may process your information in accordance with these terms.