
50+ Email Marketing Statistics: ROI, Benchmarks & Trends (2026)
Last updated: March 2026
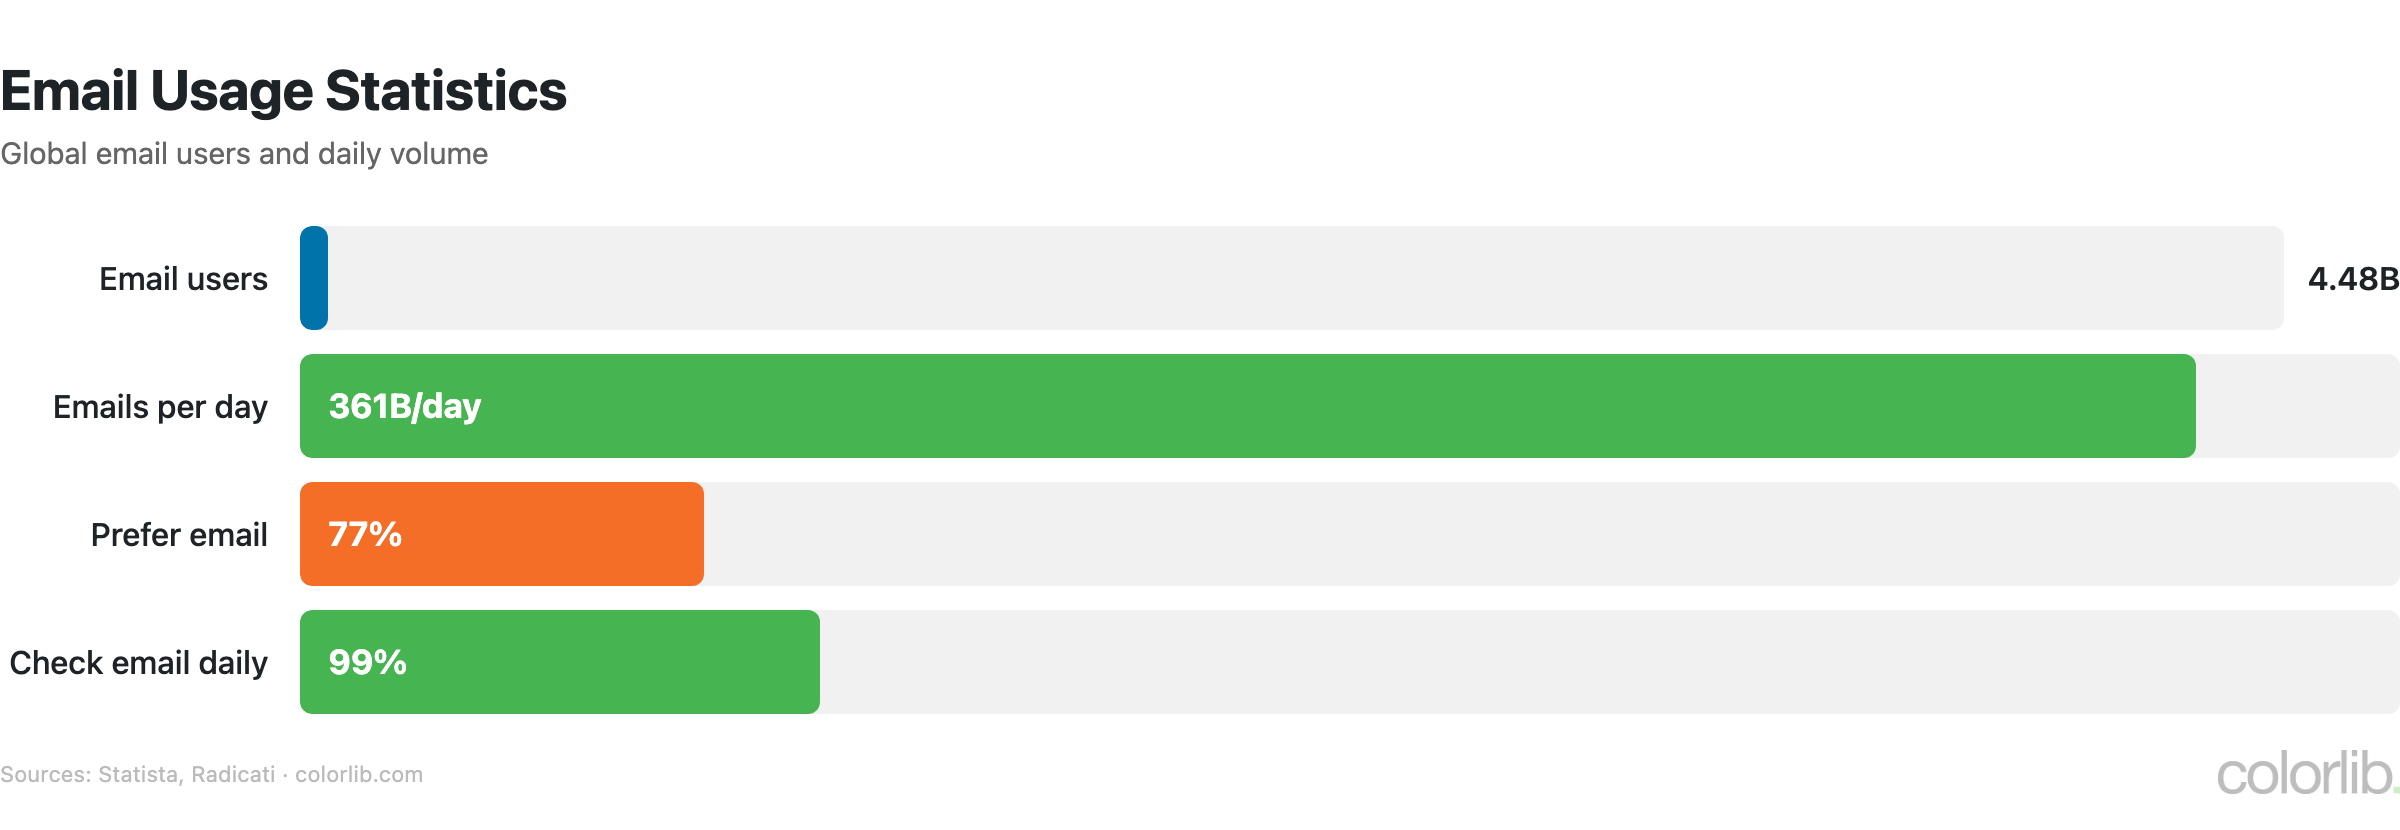
There are 4.48 billion email users worldwide, 361 billion emails are sent every day, and email marketing delivers an average ROI of $36-42 for every $1 spent — the highest of any marketing channel. 77% of consumers prefer email for promotional communications, and segmented campaigns generate 760% more revenue than generic blasts. Here are 100+ email marketing statistics covering usage, ROI, benchmarks, automation, and trends for 2026.
Key Email Marketing Statistics (2026)
- 4.48 billion email users globally (Statista)
- 361 billion emails sent per day (Statista)
- Email marketing ROI: $36-42 per $1 spent (Litmus)
- Average email open rate: 21.33% (Mailchimp)
- Average click-through rate: 2.62% (Mailchimp)
- 77% of consumers prefer email for marketing communications (HubSpot)
- Email marketing industry value: $17.5 billion (Statista)
Email Usage Statistics
| Metric | Value | Source |
|---|---|---|
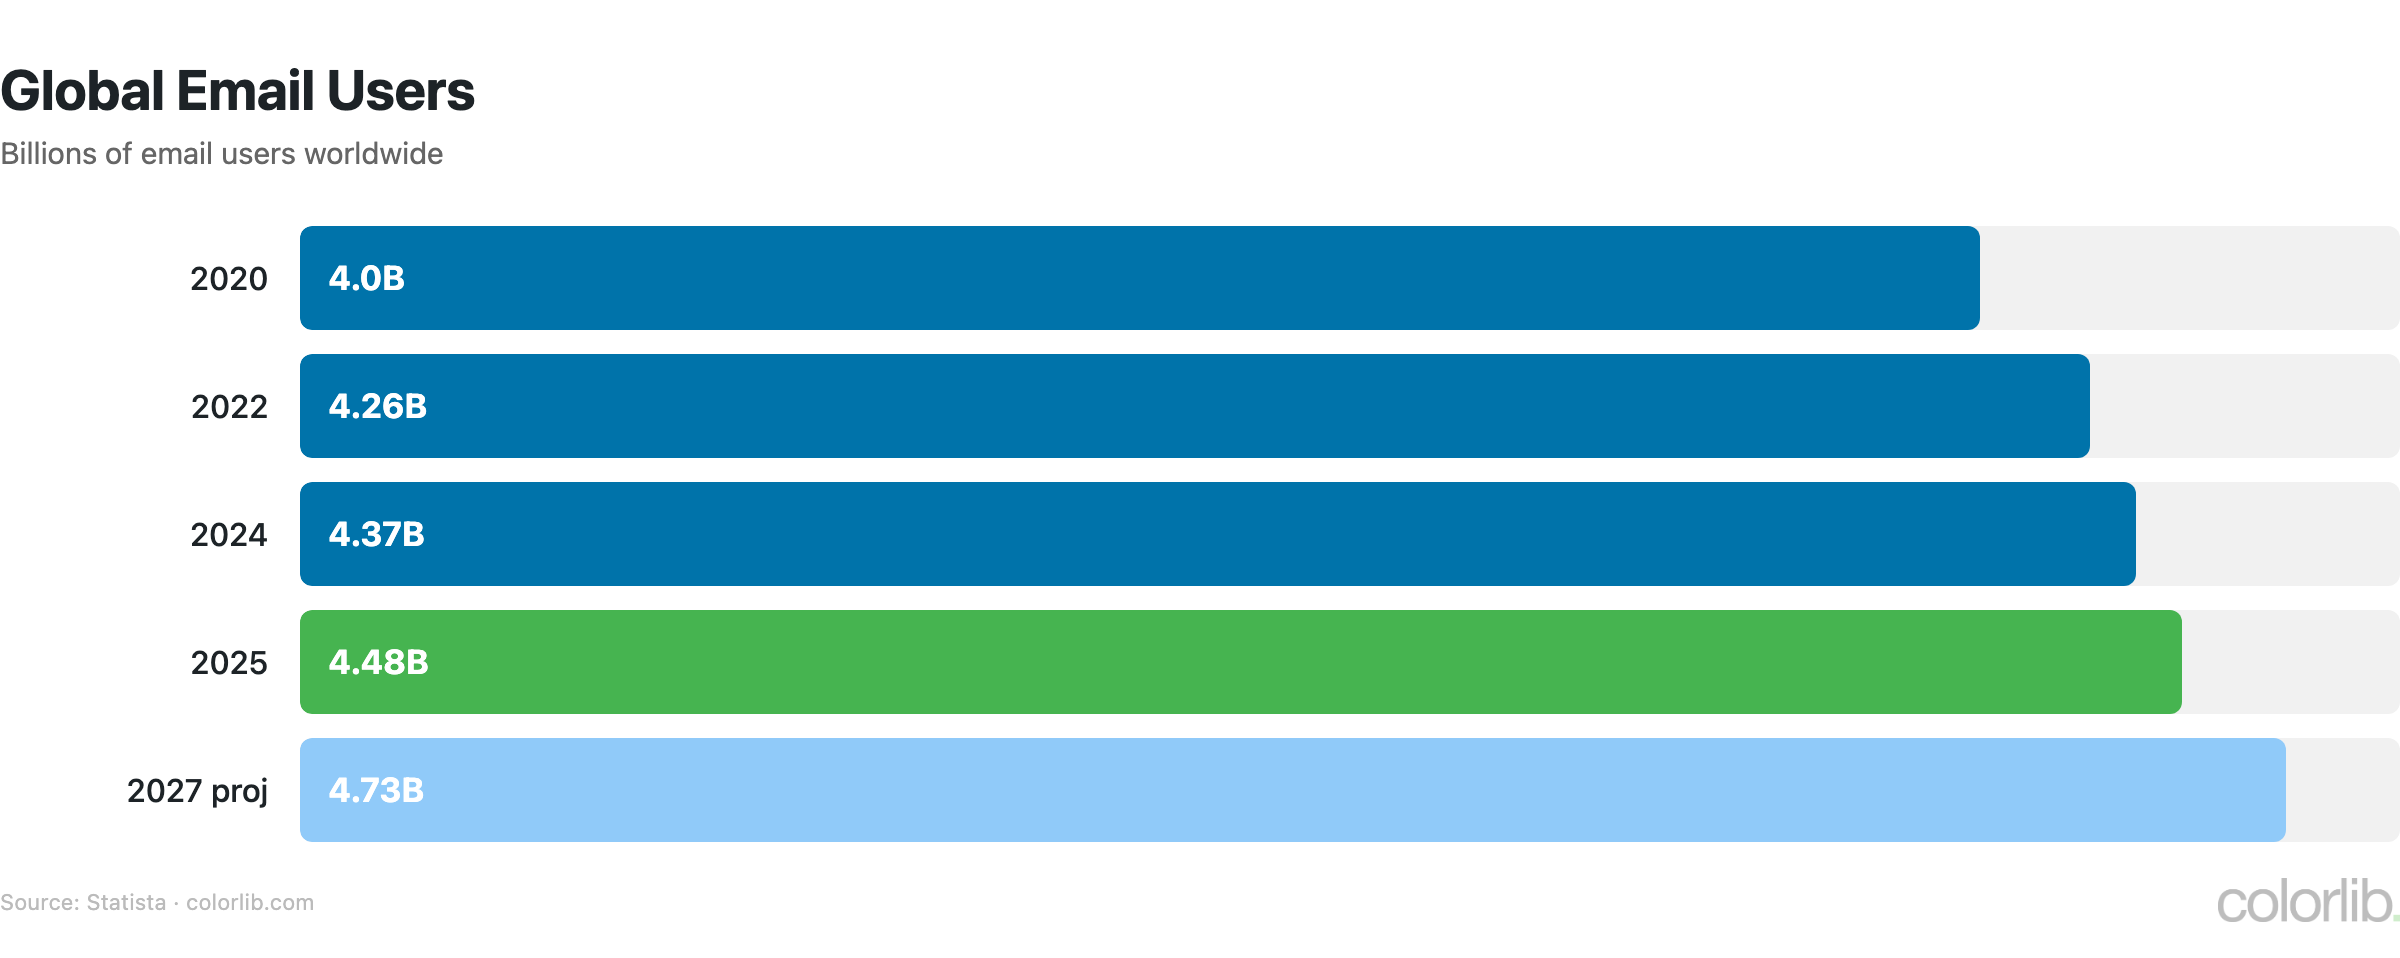
| Email users worldwide | 4.48 billion | Statista |
| Projected email users (2028) | 4.73 billion | Statista |
| Emails sent per day | 361 billion | Statista |
| Business emails per day (per person) | 126 | Radicati Group |
| Spam percentage of all email | 45.6% | Statista |
| Gmail market share | 29.5% | Litmus |
| Apple Mail market share | 58.4% | Litmus |
| Outlook market share | 4.2% | Litmus |
- 4.48 billion people have email accounts — more than use social media, making email the most universal digital communication channel
- The average business professional receives 126 emails per day, highlighting the challenge of standing out in crowded inboxes
- Nearly half of all emails (45.6%) are spam, though modern filters catch the vast majority before they reach the inbox
- Apple Mail dominates email client usage at 58.4% (including iPhone), which is significant because Apple’s Mail Privacy Protection inflates open rate metrics
- Despite competition from Slack, Teams, and other messaging tools, email volumes continue to grow 3-4% annually — email isn’t going anywhere
Email Marketing ROI
| Metric | Value | Source |
|---|---|---|
| Average email ROI | $36-42 per $1 | Litmus |
| Marketers rating email “effective” | 95% | HubSpot |
| Revenue from segmented campaigns | +760% vs. generic | Campaign Monitor |
| Email marketing industry value | $17.5 billion | Statista |
| Projected industry value (2030) | $35 billion | Statista |
| Consumers who made purchase from email | 60% | HubSpot |
| Email’s share of customer acquisition | ~20% | Shopify |
| ROI for e-commerce email | $45 per $1 | Omnisend |
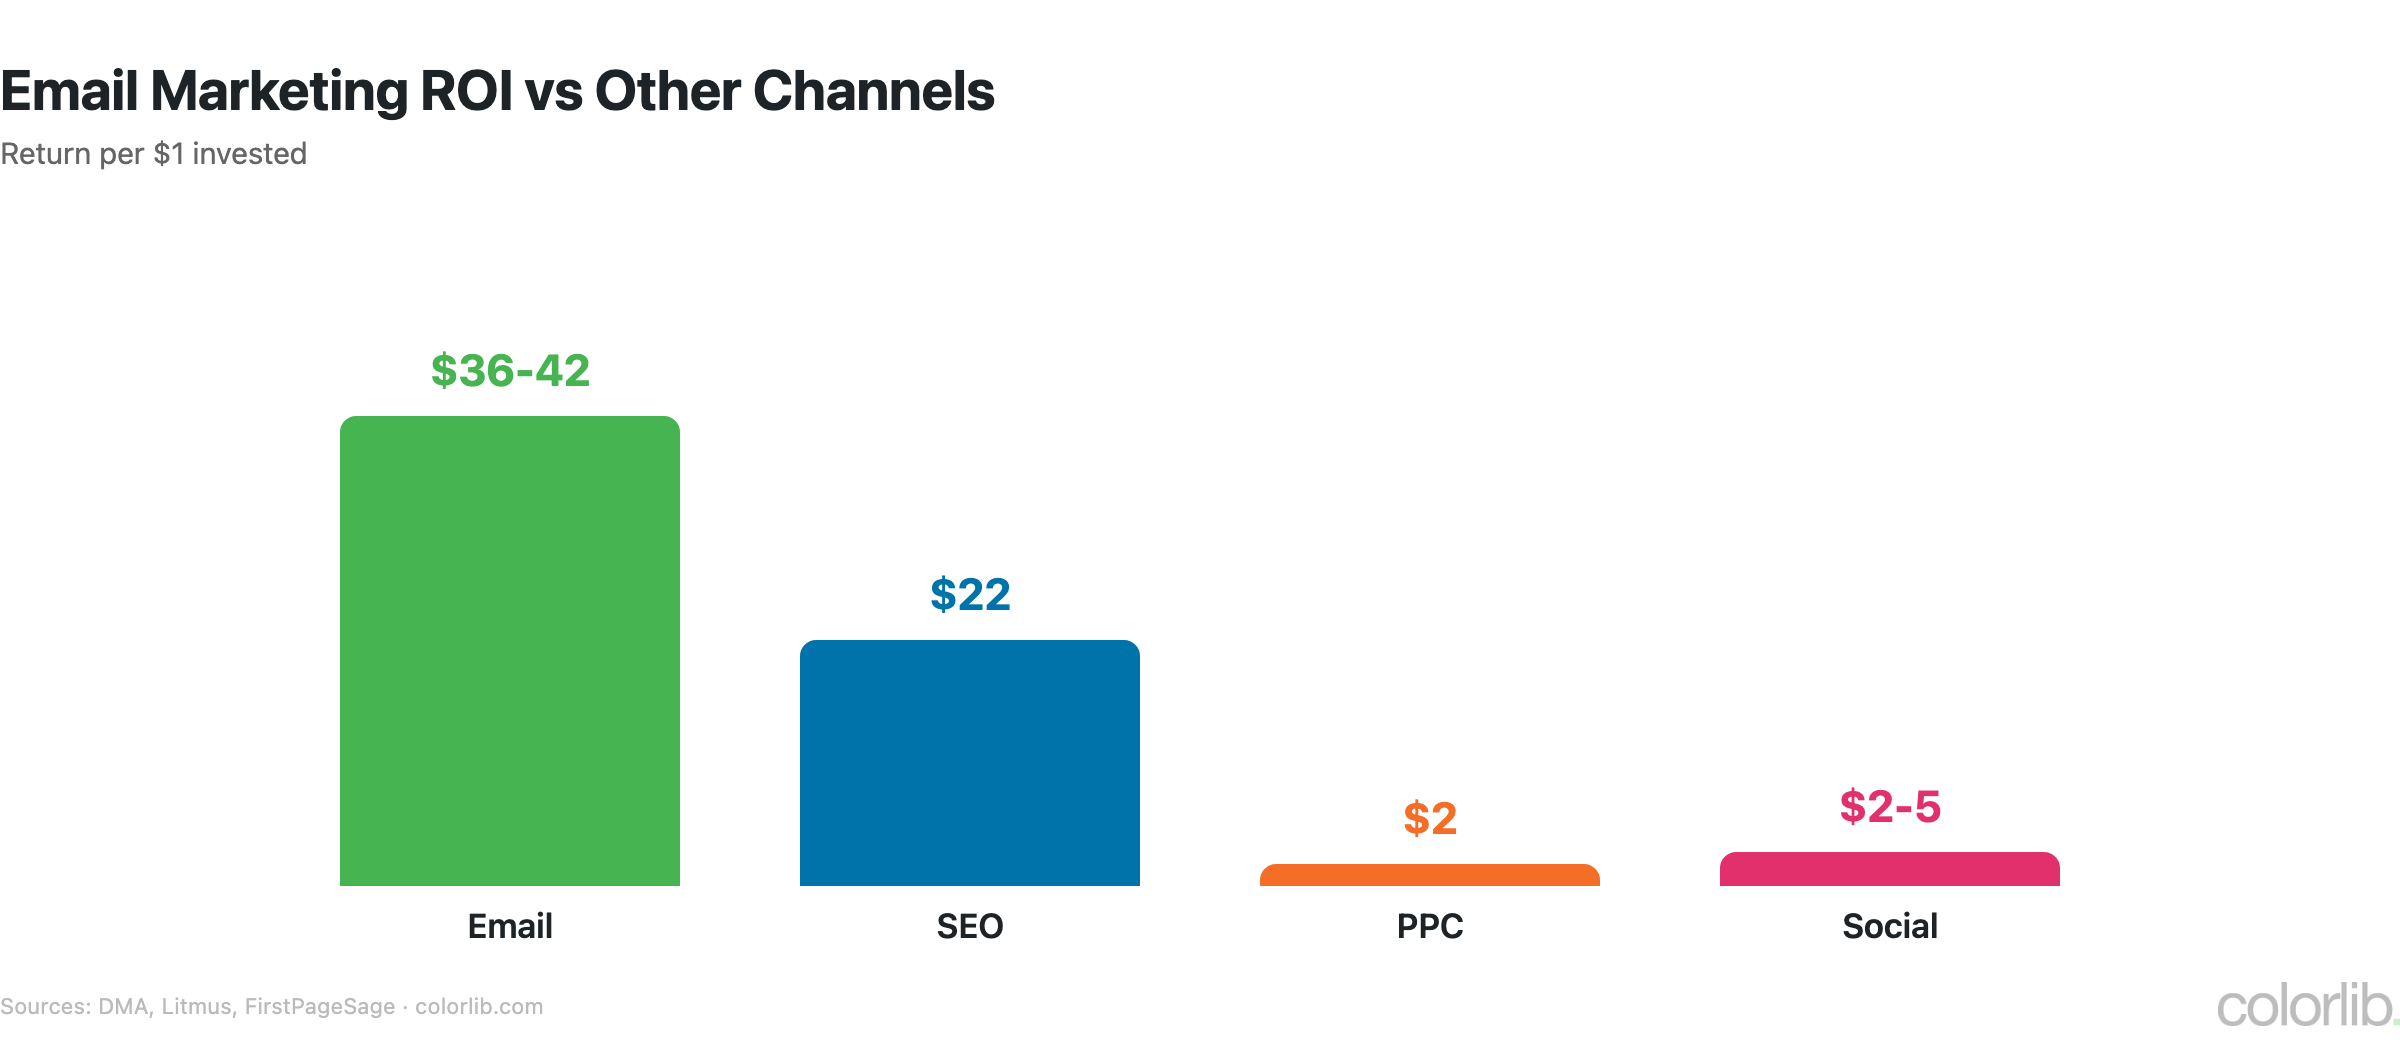
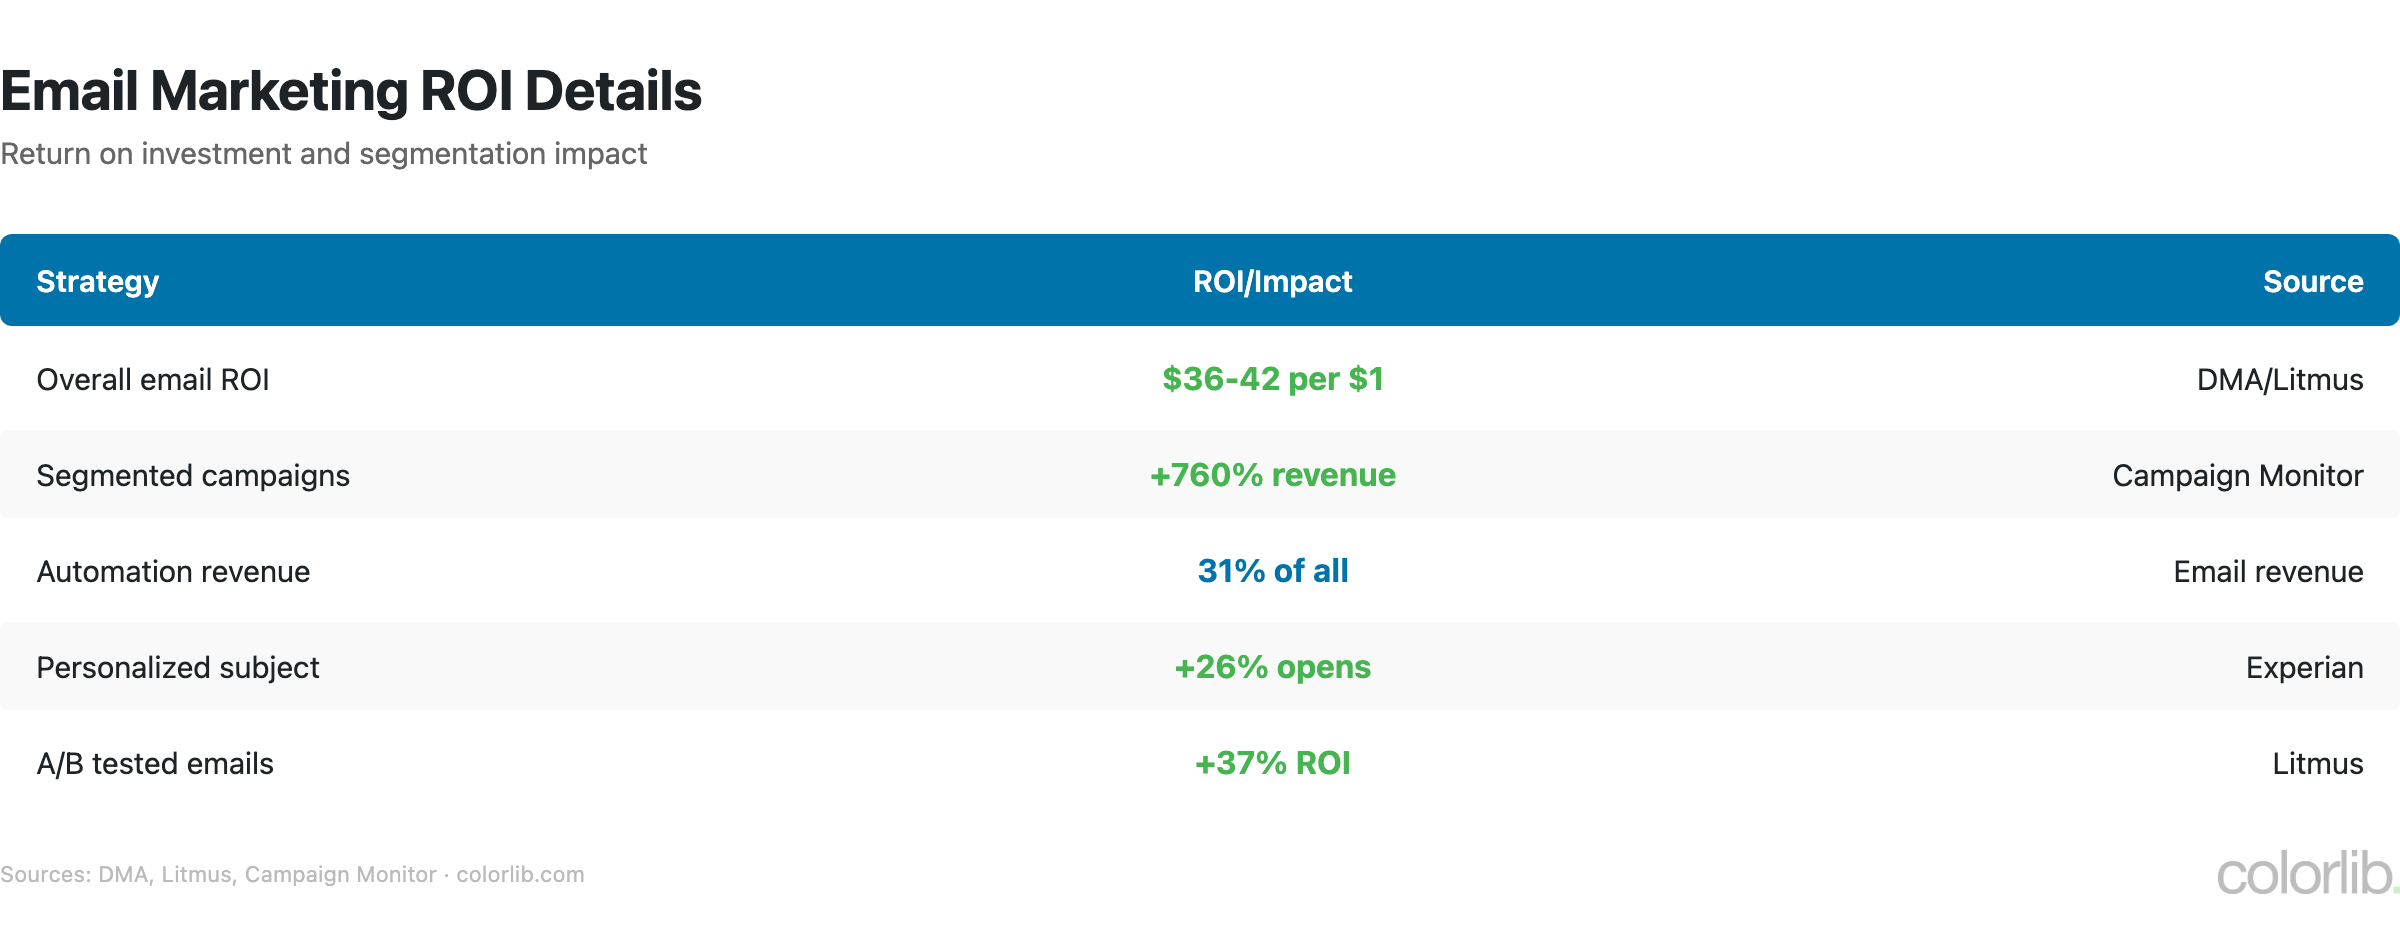
- Email delivers $36-42 for every $1 spent — roughly 4x higher ROI than social media marketing and 2x higher than SEO
- The single most impactful tactic is segmentation: segmented email campaigns drive 760% more revenue than one-size-fits-all broadcasts
- 95% of marketers rate email as an effective channel, making it the most consistently valued marketing tool year after year
- E-commerce businesses see even higher returns at $45 per $1, driven by abandoned cart emails, product recommendations, and post-purchase sequences
- 60% of consumers say they’ve made a purchase as a direct result of a marketing email, compared to 33% for social media and 25% for SMS
Open Rate & Click-Through Rate Benchmarks
| Industry | Open Rate | CTR |
|---|---|---|
| All industries (average) | 21.33% | 2.62% |
| Government & politics | 28.77% | 3.99% |
| Education | 28.5% | 4.34% |
| Nonprofit | 26.6% | 2.79% |
| Healthcare | 23.46% | 3.01% |
| Real estate | 21.7% | 2.18% |
| Retail | 18.39% | 2.25% |
| E-commerce | 15.68% | 2.01% |
| Marketing & advertising | 17.38% | 2.04% |
- The all-industry average open rate is 21.33%, though this metric is increasingly unreliable due to Apple’s Mail Privacy Protection pre-loading images on all emails
- Click-through rate (2.62% average) is a more reliable engagement metric — it measures actual interest rather than just inbox delivery
- Education and government lead in both open rates and CTR, largely because recipients have stronger relationships with senders (their school, their elected officials)
- E-commerce has the lowest open rate (15.68%) due to high email frequency — the average e-commerce brand sends 6-8 emails per week
- Personalized subject lines increase open rates by 26%, and emails with emojis in subject lines see a 15% higher open rate (though this varies by audience)
Email Automation Statistics
| Metric | Value | Source |
|---|---|---|
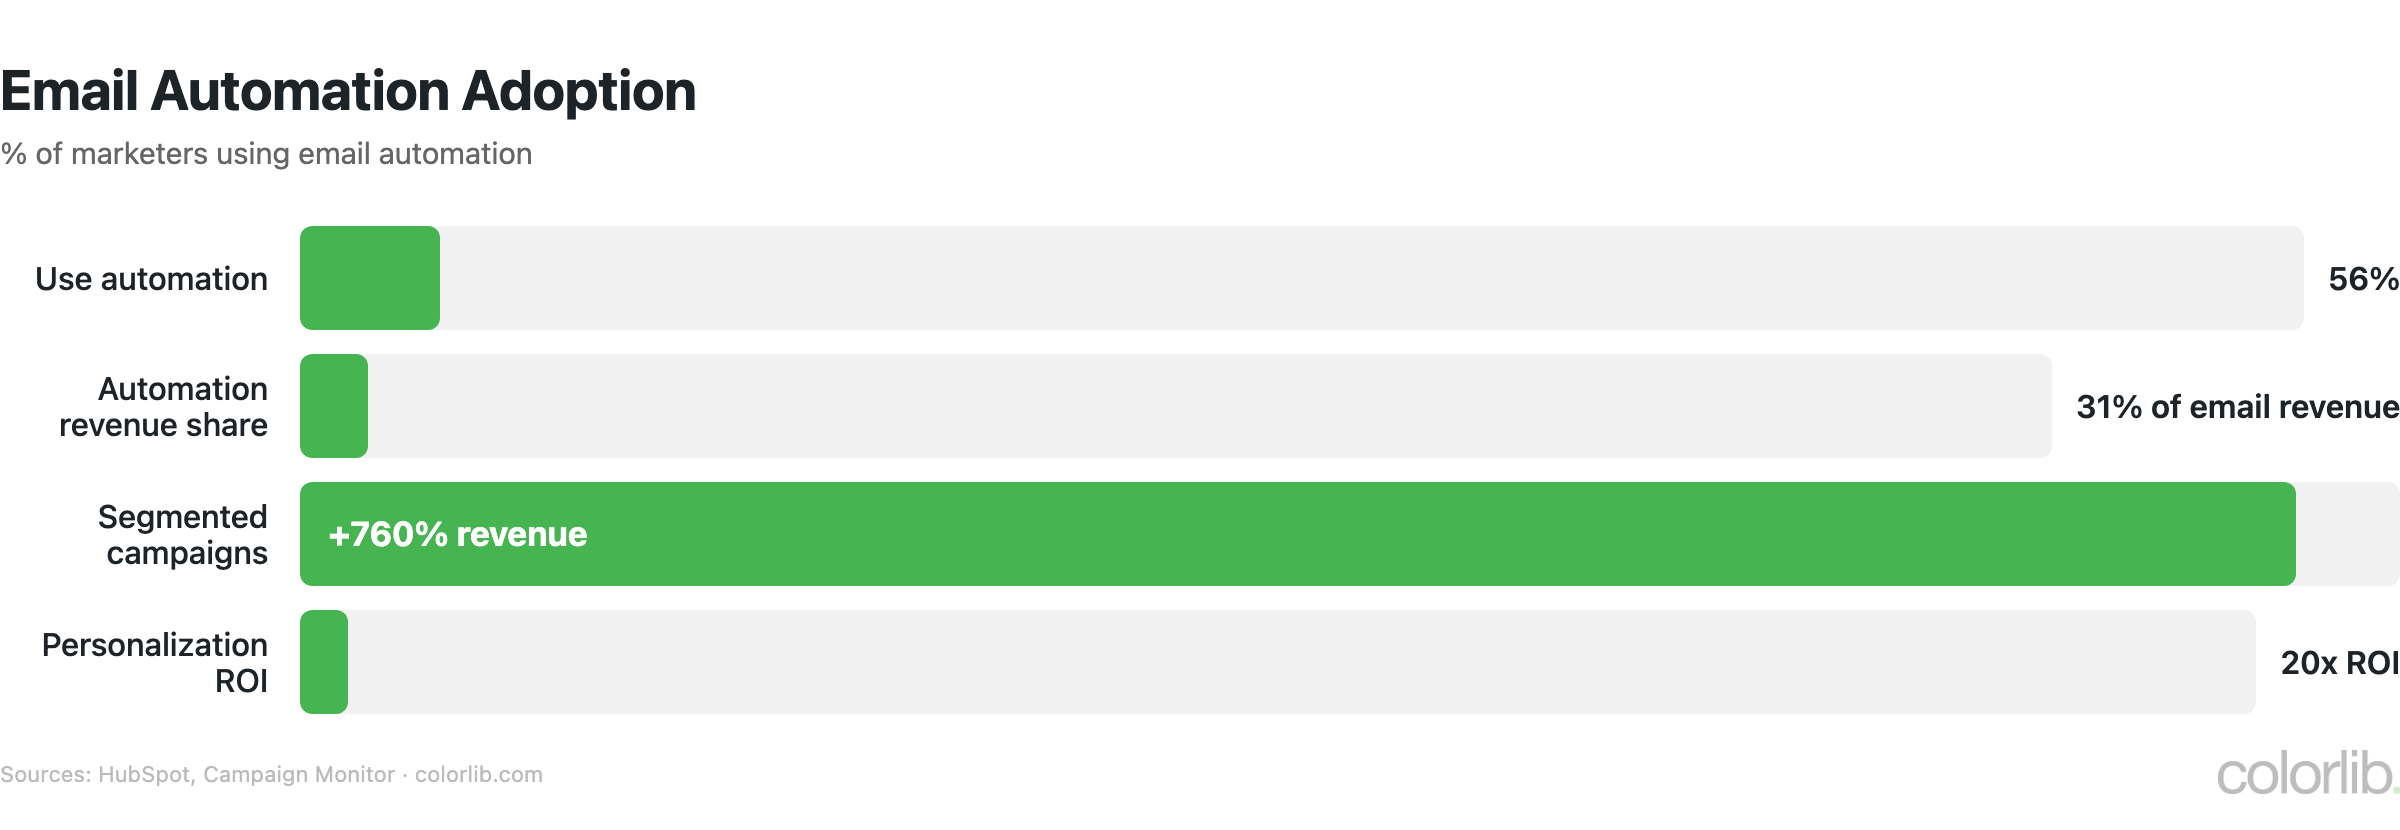
| Marketers using email automation | 56% | HubSpot |
| Revenue from automated emails | 31% of all email revenue | Omnisend |
| Automated email open rate | 42.1% | Omnisend |
| Welcome email open rate | 68.6% | Omnisend |
| Abandoned cart email recovery rate | 4.6% | Omnisend |
| Cart abandonment email CTR | 8.7% | Omnisend |
| Marketers using AI in email | 48% | Litmus |
| Revenue lift from AI-optimized send times | +25% | Braze |
- 56% of marketers use email automation, yet automated emails generate 31% of all email-driven revenue — a disproportionately high return for set-and-forget workflows
- Welcome emails are the highest-performing automated message type with a 68.6% open rate — 3x higher than regular campaigns
- Abandoned cart emails recover 4.6% of abandoned carts, which translates to massive revenue for e-commerce businesses with high cart abandonment (average: 70%)
- 48% of email marketers now use AI for subject line optimization, send time prediction, content personalization, or list segmentation
- AI-optimized send times deliver a 25% revenue lift compared to sending at a fixed time, as AI learns when each individual subscriber is most likely to engage
Mobile Email Statistics
| Metric | Value | Source |
|---|---|---|
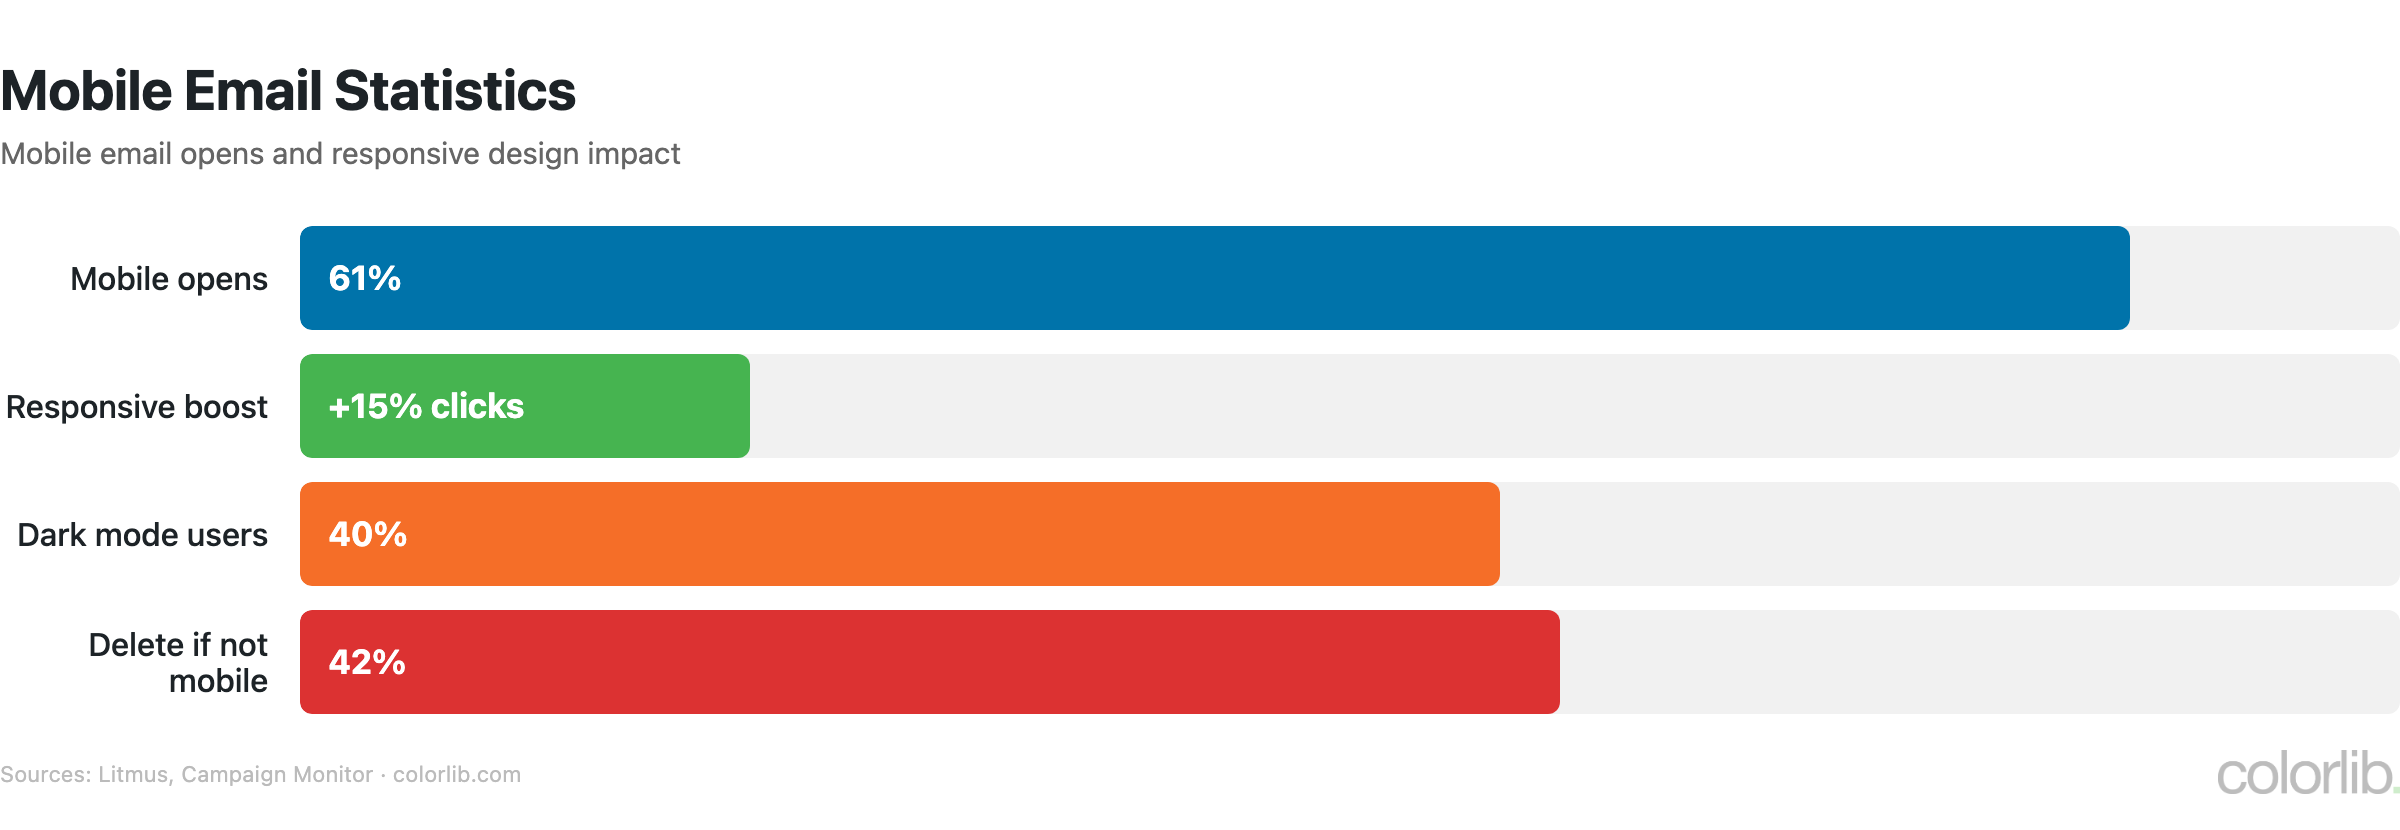
| Emails opened on mobile | 61% | Litmus |
| Emails opened on desktop | 28% | Litmus |
| Emails opened in webmail | 11% | Litmus |
| Delete within 3 seconds on mobile | 70% | Campaign Monitor |
| Mobile-responsive email lift in clicks | +15% | Litmus |
| Users who check email first on phone | 75% | Adestra |
- 61% of all emails are first opened on a mobile device, making mobile-responsive design non-negotiable for email marketers
- 70% of emails that render poorly on mobile are deleted within 3 seconds — you essentially get one shot to make an impression
- Mobile-responsive emails see a 15% higher click rate than non-responsive emails, and a 24% lower unsubscribe rate
- 75% of people check email on their phone first thing in the morning, before switching to desktop later for work-related emails
- The ideal email width for mobile is 600 pixels or less, with a minimum font size of 14px for body text and touch-friendly CTAs (minimum 44x44px)
B2B vs. B2C Email Marketing
| Metric | B2B | B2C |
|---|---|---|
| Average open rate | 22.0% | 19.7% |
| Average CTR | 3.2% | 2.1% |
| Best send day | Tuesday | Thursday/Saturday |
| Optimal send frequency | 2-3x per week | 4-6x per week |
| Top-performing content | Industry insights (47%) | Discounts/offers (62%) |
| Email as primary channel | 81% | 64% |
| Average list size | 12,500 | 45,000 |
| Average unsubscribe rate | 0.21% | 0.34% |
- B2B emails outperform B2C on both open rates (22.0% vs. 19.7%) and CTR (3.2% vs. 2.1%), reflecting more targeted lists and higher relevance
- 81% of B2B marketers say email is their most important content distribution channel, ahead of social media (67%) and their blog (52%)
- B2B email works best on Tuesday, while B2C peaks on Thursday and Saturday — matching when professionals vs. consumers are most receptive
- B2B subscribers are more loyal — the average unsubscribe rate is 0.21% compared to 0.34% for B2C, where higher frequency and promotional content drives more list churn
- The most effective B2B email content is industry insights and thought leadership (47%), while B2C subscribers respond most to discounts and offers (62%). For more on content marketing approaches, see our digital marketing statistics
Sources
- Statista — Number of Email Users Worldwide
- Litmus — Email Marketing ROI Report
- Mailchimp — Email Marketing Benchmarks
- HubSpot — Marketing Statistics
- Campaign Monitor — Email Marketing Benchmarks
- Omnisend — Email & SMS Marketing Statistics
- Radicati Group — Email Statistics Report
- Content Marketing Institute — B2B Research
Frequently Asked Questions
What is a good email open rate?
The all-industry average open rate is 21.33%, so anything above that is above average. However, open rates vary dramatically by industry — education emails see 28.5% while e-commerce averages just 15.68%. More importantly, open rates have become less reliable since Apple introduced Mail Privacy Protection, which pre-loads tracking pixels and inflates open rates by 15-20%. Click-through rate (2.62% average) is now considered a more accurate engagement metric.
How much does email marketing cost?
Email marketing platform costs range from free (up to 500 subscribers on most platforms) to $1,000+/month for enterprise features. Mailchimp charges $13-350/month, Klaviyo $20-2,000/month, and Sendy (self-hosted) is a one-time $69 fee. The median small business spends $300-500/month on email marketing tools. At an ROI of $36-42 per $1, email remains the most cost-effective marketing channel available.
Is email marketing still effective in 2026?
Absolutely. Email delivers $36-42 ROI per dollar spent, 95% of marketers rate it effective, and 77% of consumers prefer email for promotional communications. Despite predictions of its demise, email volumes grow 3-4% annually. The key to effectiveness in 2026 is personalization, segmentation (which drives 760% more revenue), mobile-responsive design, and automation. For broader context on how email fits into the marketing mix, see our lead generation statistics report.
How often should you send marketing emails?
The optimal frequency depends on your audience. B2B marketers see the best results with 2-3 emails per week, while B2C/e-commerce can send 4-6 per week without excessive unsubscribes. The average unsubscribe rate is 0.21% (B2B) to 0.34% (B2C). The most important factor isn’t frequency but relevance — segmented, personalized emails can be sent more frequently than generic blasts without increasing fatigue. Monitor unsubscribe rates and click-through rates to find your audience’s sweet spot.
Key Takeaways
- Email marketing delivers the highest ROI of any channel — $36-42 per $1 spent. No other marketing channel comes close consistently, which is why 95% of marketers rate it effective and 81% of B2B marketers call it their most important distribution channel.
- Segmentation is the single biggest lever. Segmented campaigns generate 760% more revenue than generic blasts. Yet many businesses still send the same email to their entire list.
- Mobile-first design is mandatory. 61% of emails are opened on mobile, and 70% of poorly-rendered mobile emails are deleted within 3 seconds. If your emails aren’t responsive, you’re losing the majority of your audience.
- Automation generates outsized returns. Automated emails account for just 2% of sends but 31% of email revenue. Welcome sequences, abandoned cart flows, and post-purchase emails work 24/7.
Related Posts


Comments (0)