

50+ Advertising Statistics: Spend, Platforms & Trends (2026)
Global advertising revenue reached $1.14 trillion in 2025, Google and Meta alone took in more than $490 billion of it, and about 29.5% of internet users block ads. Here are 50+ advertising statistics covering global market size, digital vs. traditional, top platforms, ad blocking, programmatic, CTV, and ROI benchmarks for 2026.
Key Advertising Statistics (2026)
- Global ad revenue: $1.14 trillion in 2025, up 8.8% (WPP Media)
- Global ad revenue growth forecast for 2026: 8.9% (WPP Media)
- US internet ad revenue: nearly $300 billion in 2025, up 13.9% (IAB/PwC)
- Google ad revenue: $294.7 billion in 2025 (Alphabet 10-K)
- Meta ad revenue: $196.2 billion in 2025 (Meta Investor Relations)
- Amazon ad revenue: $68.6 billion in 2025 (Amazon 10-K)
- Ad blocking used by 29.5% of internet users (Backlinko)
- Commerce (retail media) ad revenue: $178.2 billion globally in 2025 (WPP Media)
Global Advertising Market Size
| Metric | Value | Source |
|---|---|---|
| Global ad revenue (2025) | $1.14 trillion | WPP Media |
| Global ad revenue growth (2025, excl. US political) | 8.8% | WPP Media |
| Global ad revenue growth (2026 forecast) | 8.9% | WPP Media |
| Global ad spend (2026 forecast) | $1.25 trillion | Statista |
| US ad spend (2026 forecast) | $513 billion | Statista |
| US internet ad revenue (2025) | ~$300 billion | IAB/PwC |
| US ad revenue growth (2026 forecast) | 11.9% | WPP Media |
| Global 5-year ad revenue CAGR (forecast) | 6.3% | WPP Media |
- Global ad revenue reached $1.14 trillion in 2025, growing 8.8% excluding US political advertising, with 7.1% growth expected in 2026 at the time of the December forecast
- WPP Media raised its outlook in June 2026 and now expects 8.9% growth in 2026, driven largely by AI investment, with US ad revenue up 11.9%
- Commerce advertising, led by retail media, reached $178.2 billion in 2025 and passed total TV ad revenue for the first time
- Traditional and generative search together will account for 21.8% of global ad revenue in 2026, and WPP Media flags generative search as possibly the fastest channel to $100 billion
- US internet advertising revenue grew 13.9% to nearly $300 billion in 2025, the highest level in the IAB/PwC report’s 30-year history
Digital vs. Traditional Advertising
| Channel | 2025 Revenue | Share of Total |
|---|---|---|
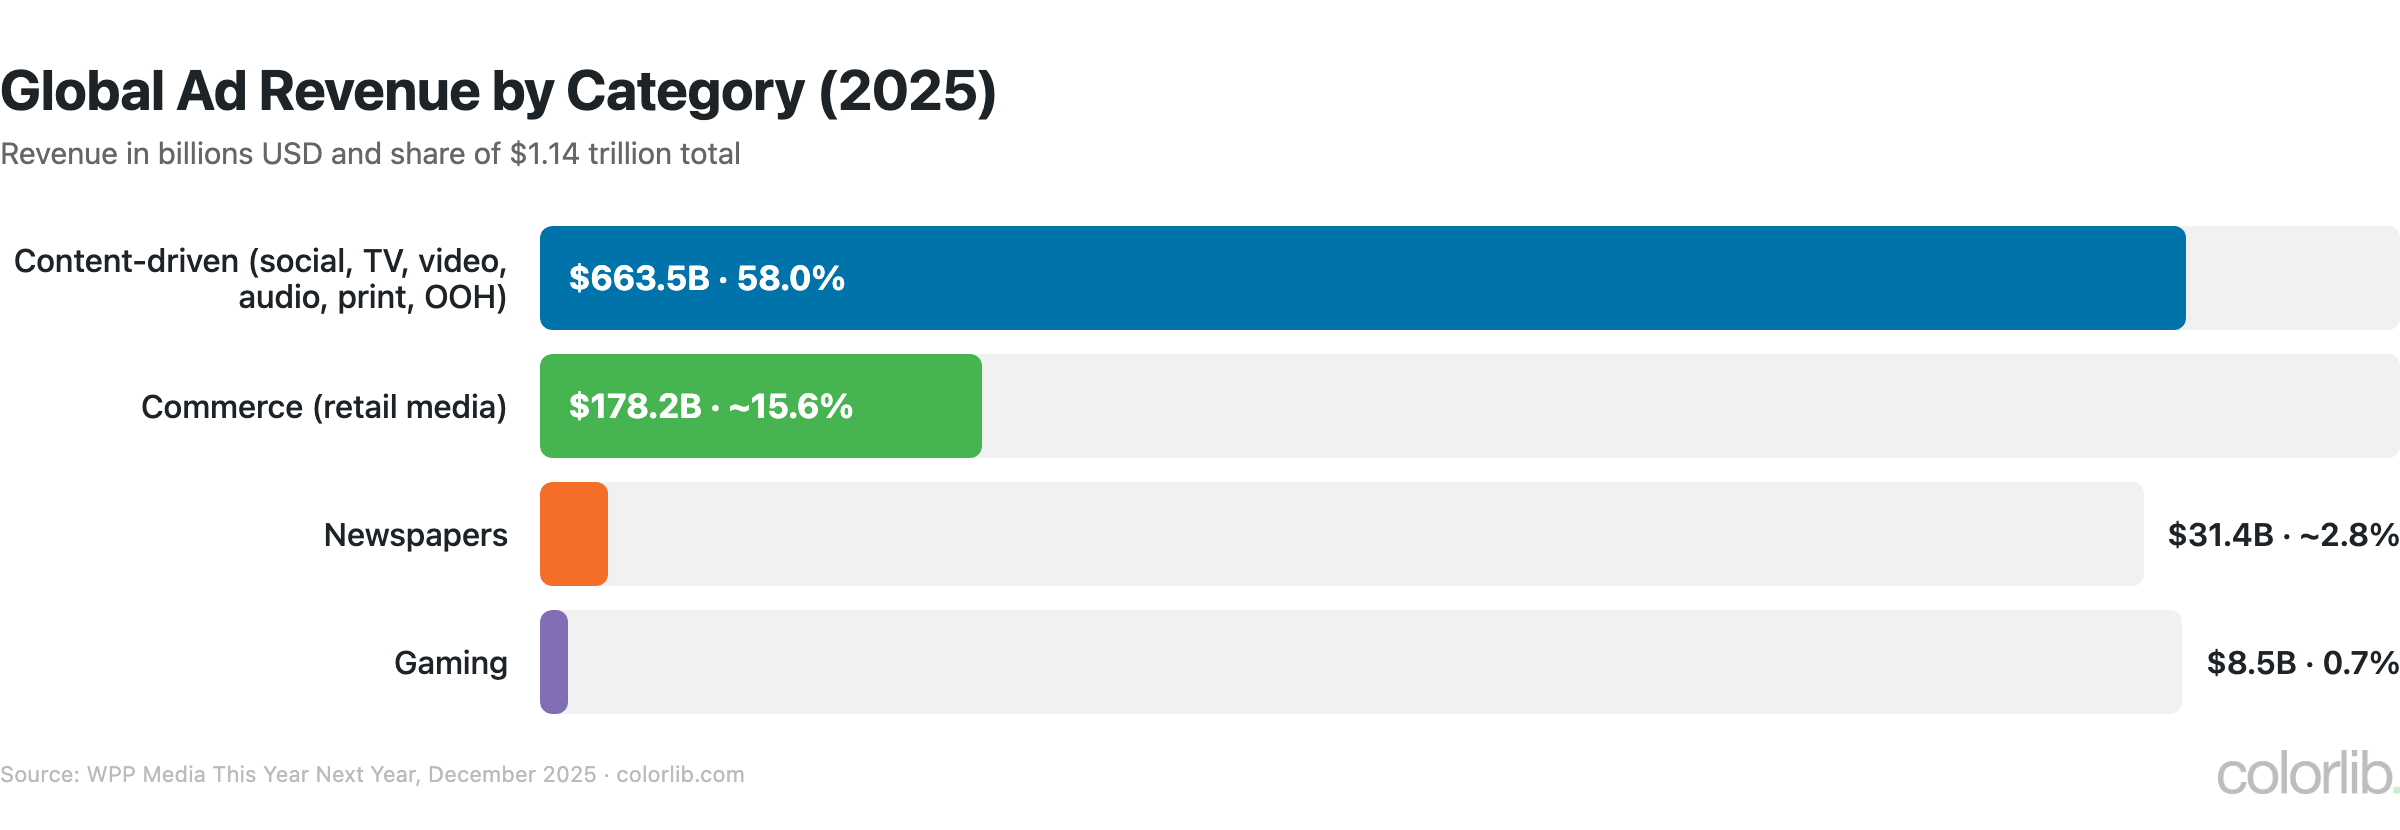
| Content-driven advertising (social, TV, video, audio, print, OOH) | $663.5 billion | 58.0% |
| Commerce (retail media) | $178.2 billion | ~15.6% |
| Newspapers | $31.4 billion | ~2.8% |
| Gaming | $8.5 billion | 0.7% |
- Content-driven advertising is still the largest category at $663.5 billion, 58.0% of global ad revenue, and WPP Media projects it will reach $720.2 billion in 2026
- Social remains the largest single channel, but WPP Media expects its growth to slow to single digits from 2027 as time spent plateaus and age restrictions take effect
- Newspaper advertising is stabilizing at $31.4 billion in 2025 before a projected decline
- Digital out-of-home (DOOH) is forecast to make up 43.9% of all out-of-home revenue by 2030
- Gaming is the fastest-growing content channel, up 29.5% to $8.5 billion in 2025
Top Advertising Platforms
| Platform | Ad Revenue (2025) | Key Metric |
|---|---|---|
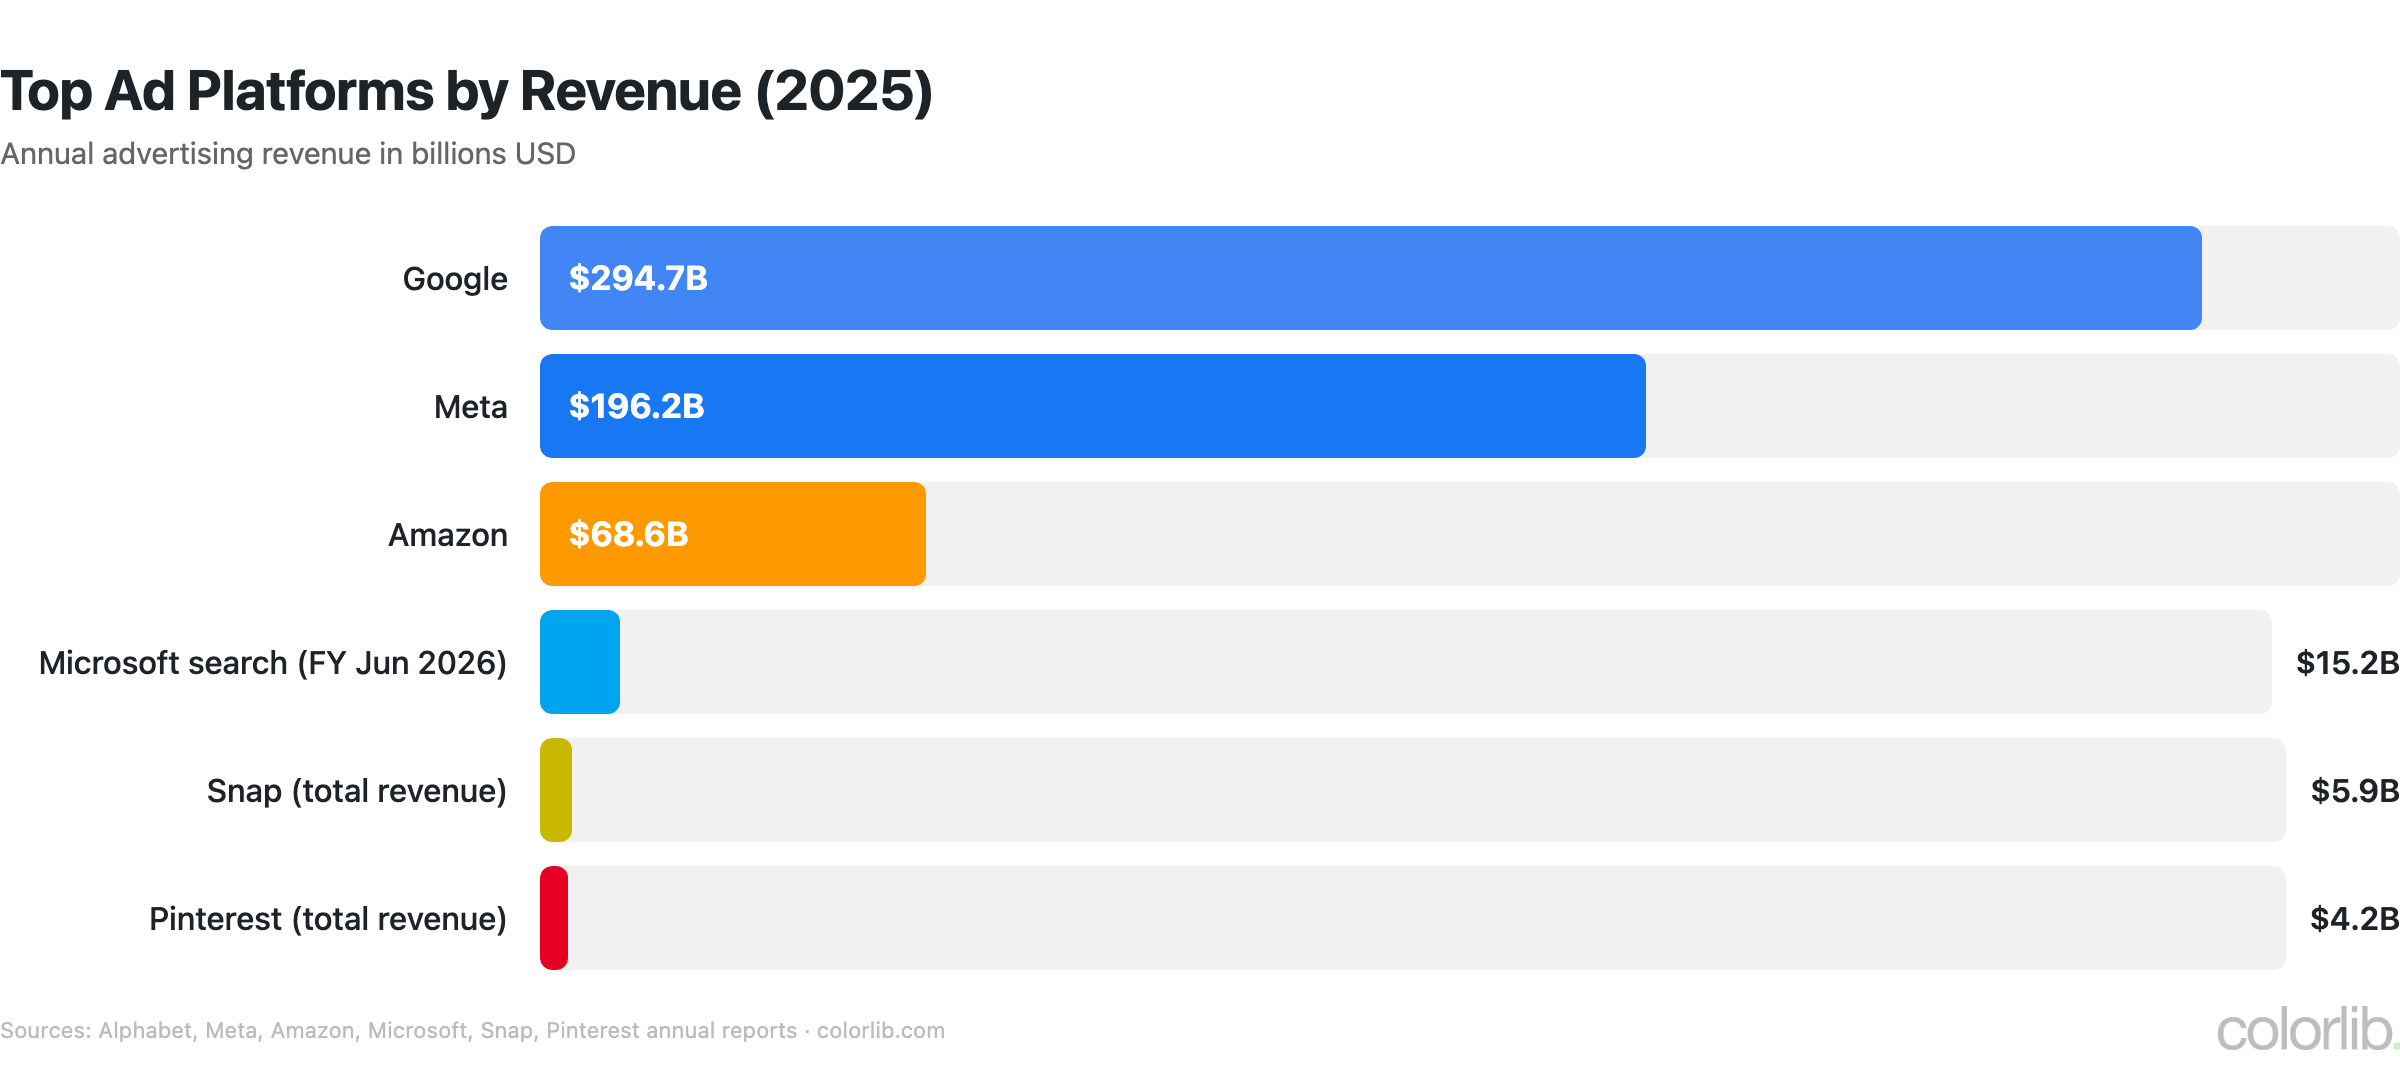
| Google (Search + YouTube + Network) | $294.7 billion | YouTube ads: $40.4B |
| Meta (Facebook + Instagram + WhatsApp) | $196.2 billion | 3.6B daily active people (June 2026) |
| Amazon Ads | $68.6 billion | Up 22%; $19.8B in Q2 2026 |
| Microsoft search ads (Bing, Copilot) | $15.2 billion | Fiscal year to June 2026 |
| Snap (total revenue) | $5.9 billion | 493M daily active users (Q2 2026) |
| Pinterest (total revenue) | $4.2 billion | 640M monthly active users (Q2 2026) |
- Google and Meta together took in more than $490 billion in ad revenue in 2025
- Amazon is the 3rd largest ad platform, with ad revenue up 22% in 2025 and up 26% year over year in Q2 2026
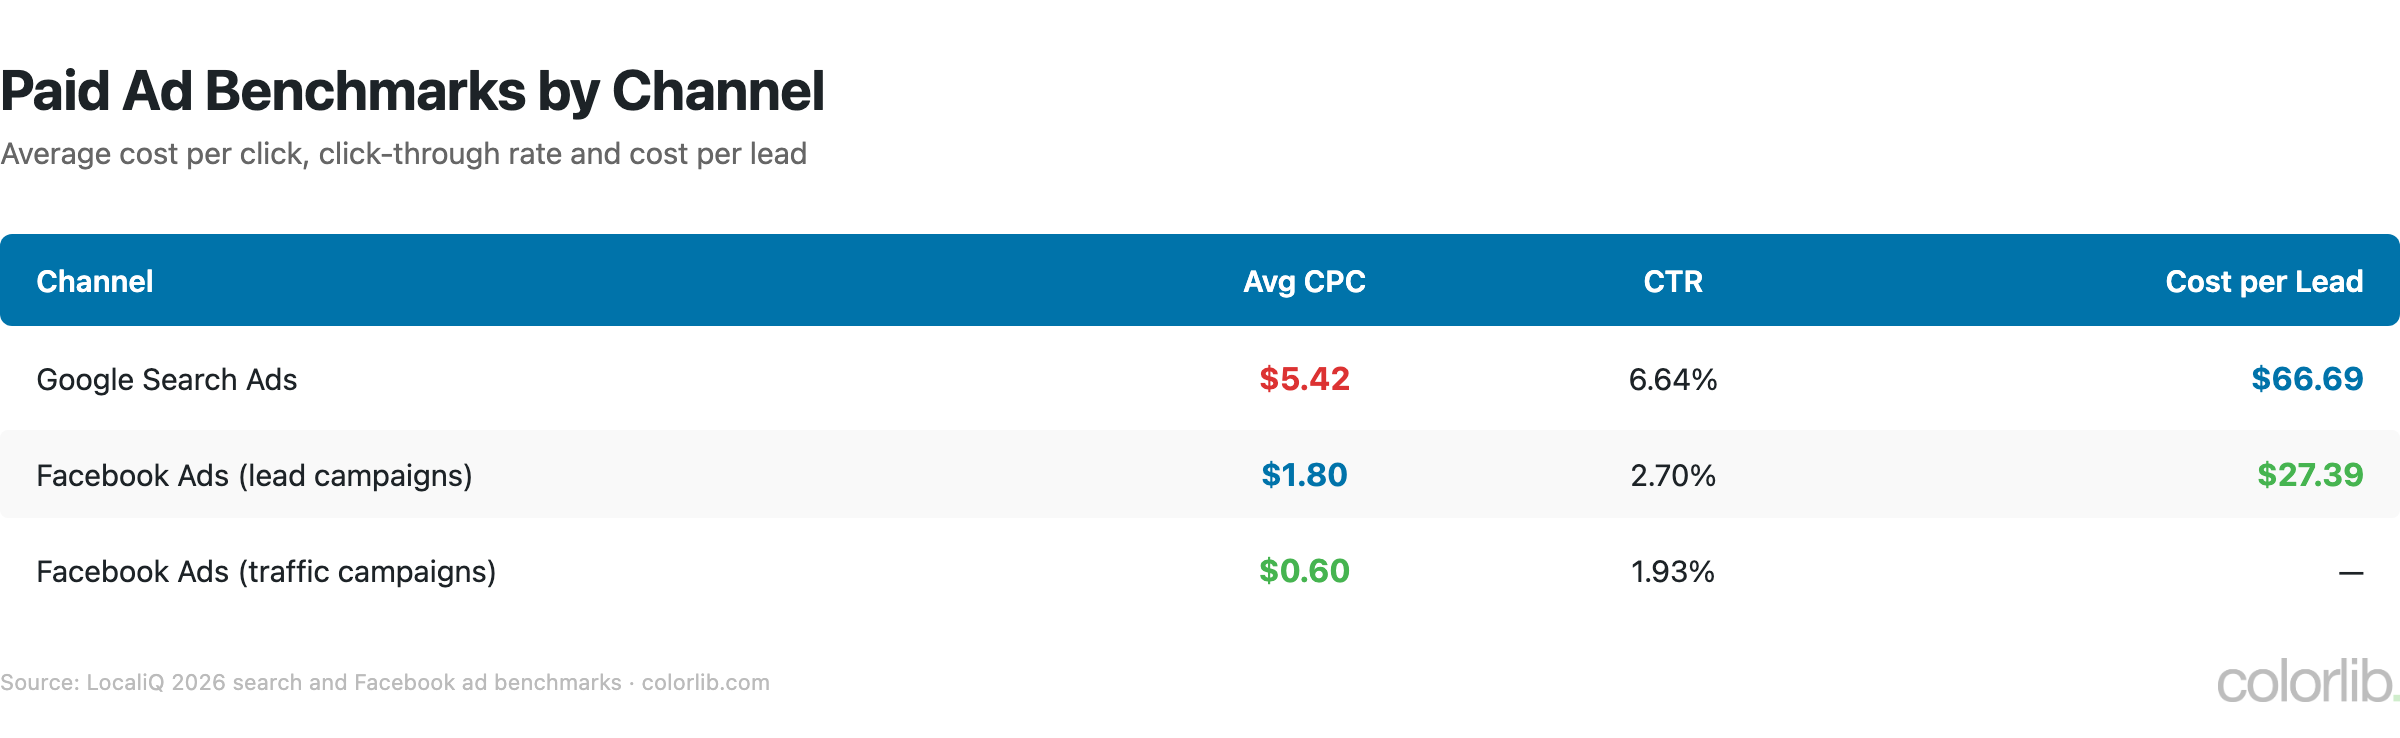
- Average Google Ads search CPC is $5.42 across industries, while average cost per lead fell to $66.69, the first decrease in five years (LocaliQ)
- YouTube ads brought in $40.4 billion in 2025, up from $36.1 billion in 2024
- Meta’s average price per ad rose 12% year over year in Q2 2026, while ad impressions grew 14%
Ad Blocking Statistics
| Metric | Value | Source |
|---|---|---|
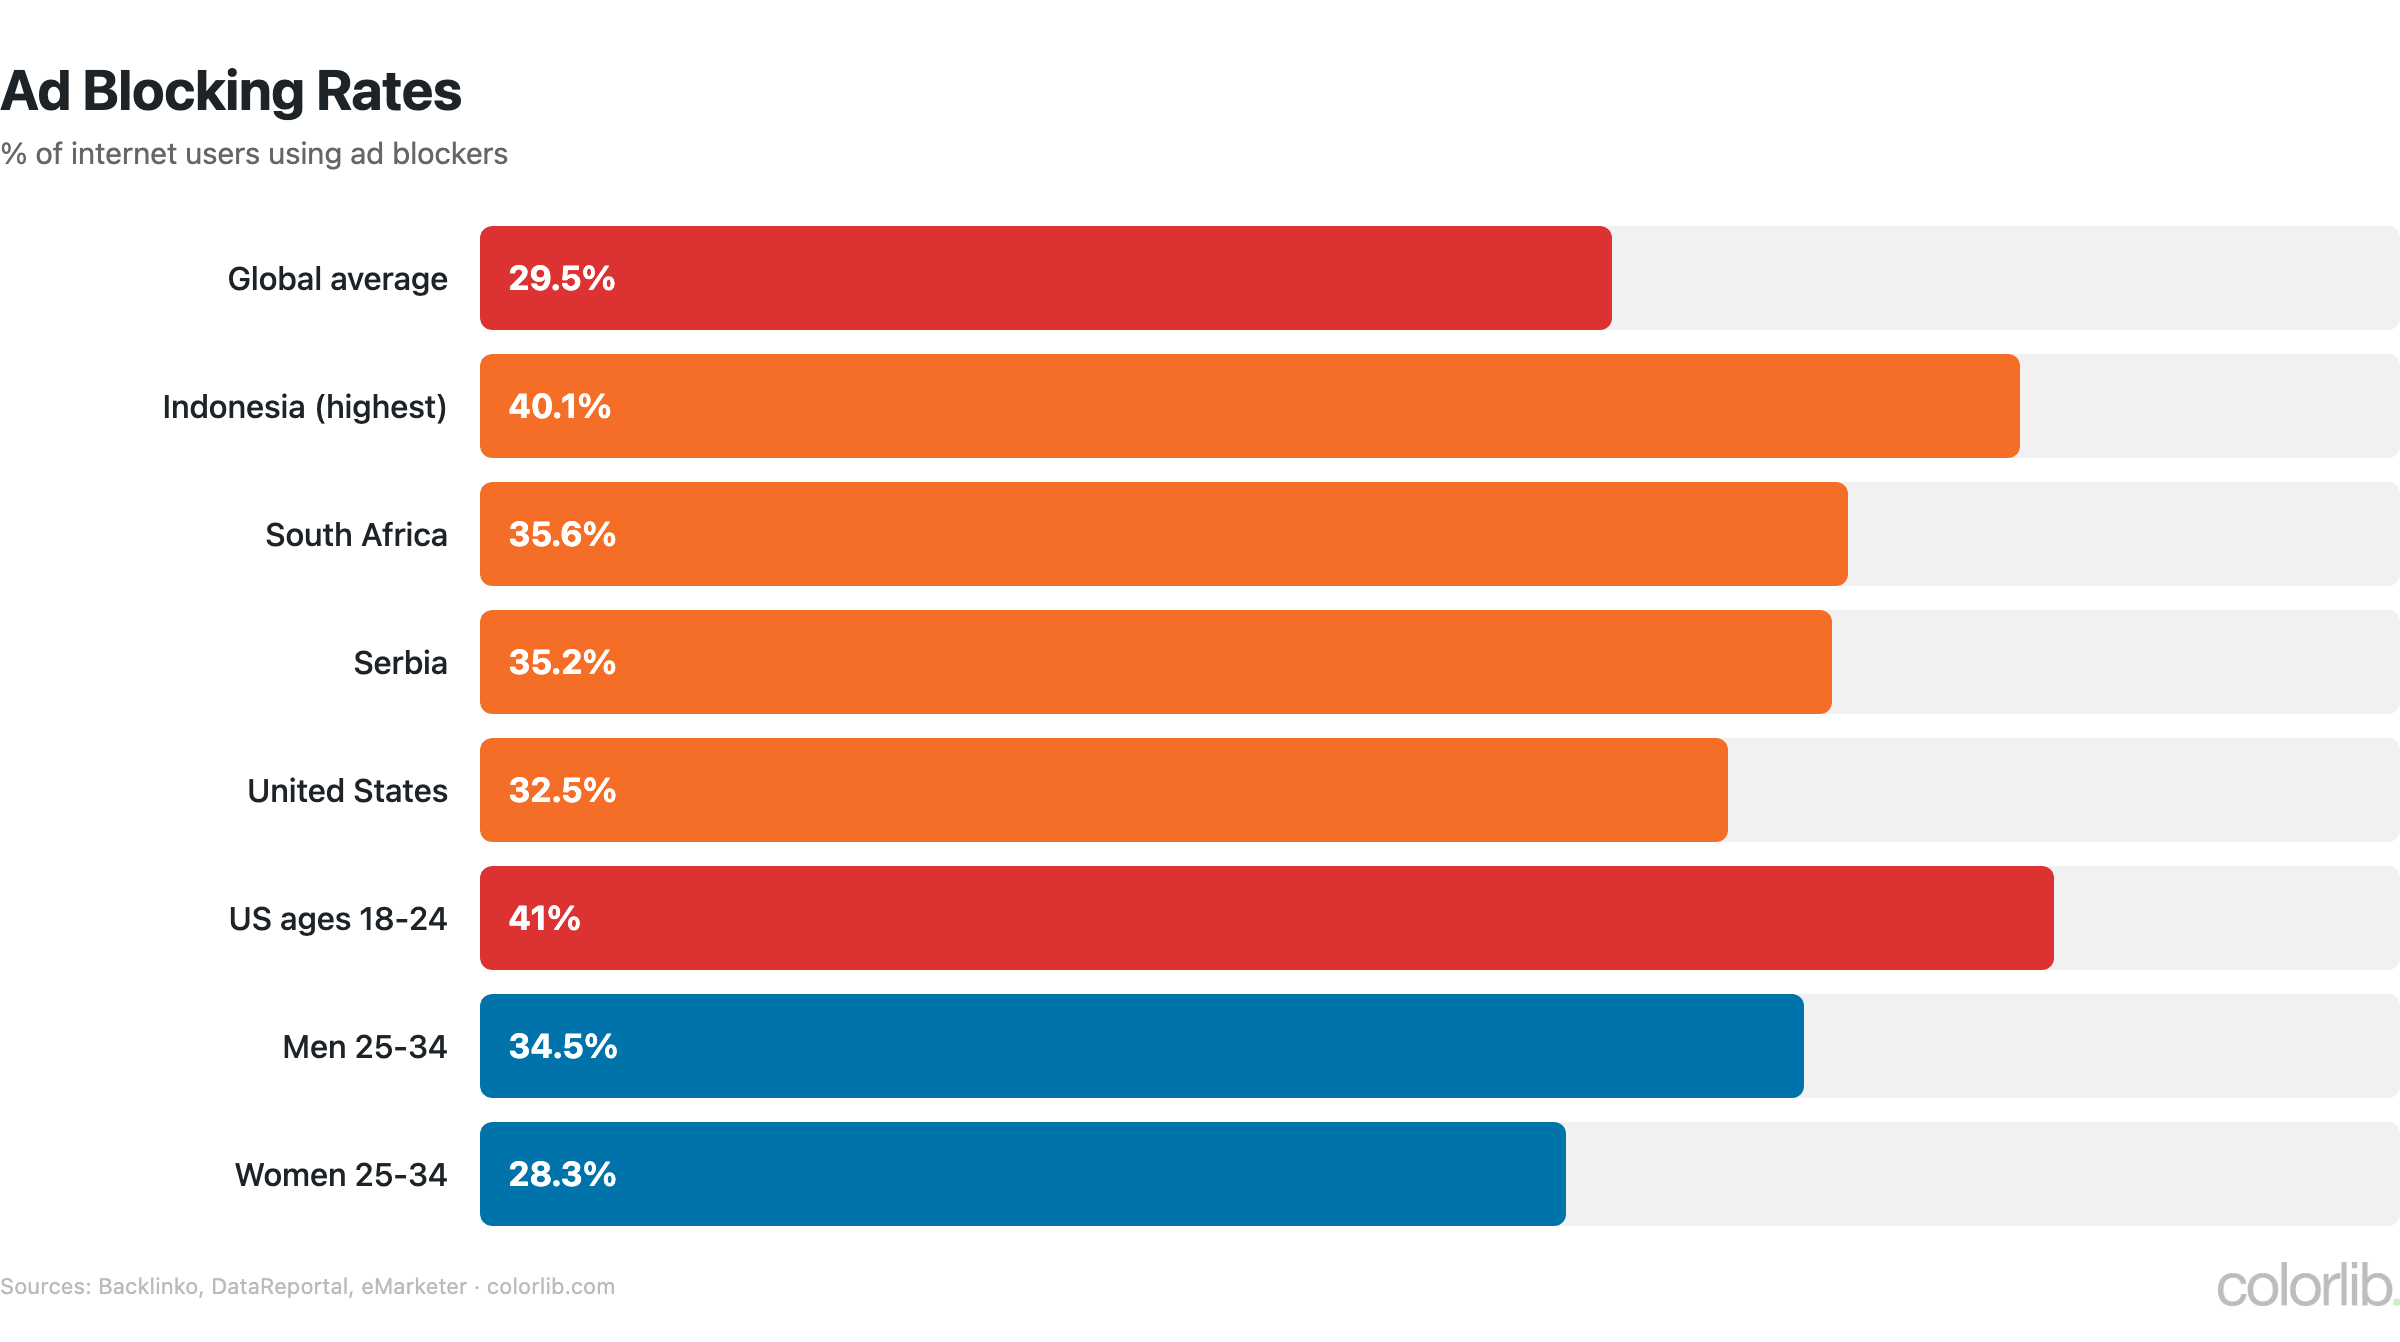
| Global ad blocker usage | 29.5% of internet users | Backlinko / DataReportal |
| Highest ad blocking country | Indonesia (40.1%) | Backlinko / DataReportal |
| US ad blocking rate | 32.5% | Backlinko / DataReportal |
| Top reason for ad blocking | Too many ads (63.5%) | Backlinko |
| Ads are obstructive | 53.5% | Backlinko |
| Privacy concerns | 42.4% | Backlinko |
| US 18-24 ad blocker usage | 41% | Backlinko / eMarketer |
- About 29.5% of internet users worldwide block ads, with Indonesia (40.1%), South Africa (35.6%) and Serbia (35.2%) highest
- Men block ads more than women: 34.5% of men aged 25-34 use an ad blocker versus 28.3% of women the same age
- Ad volume is the main trigger: 63.5% of ad-block users say there are too many ads
- CTV and in-app ads are largely immune to blocking, contributing to their rapid ad spend growth
Programmatic & CTV Advertising
| Metric | Value | Source |
|---|---|---|
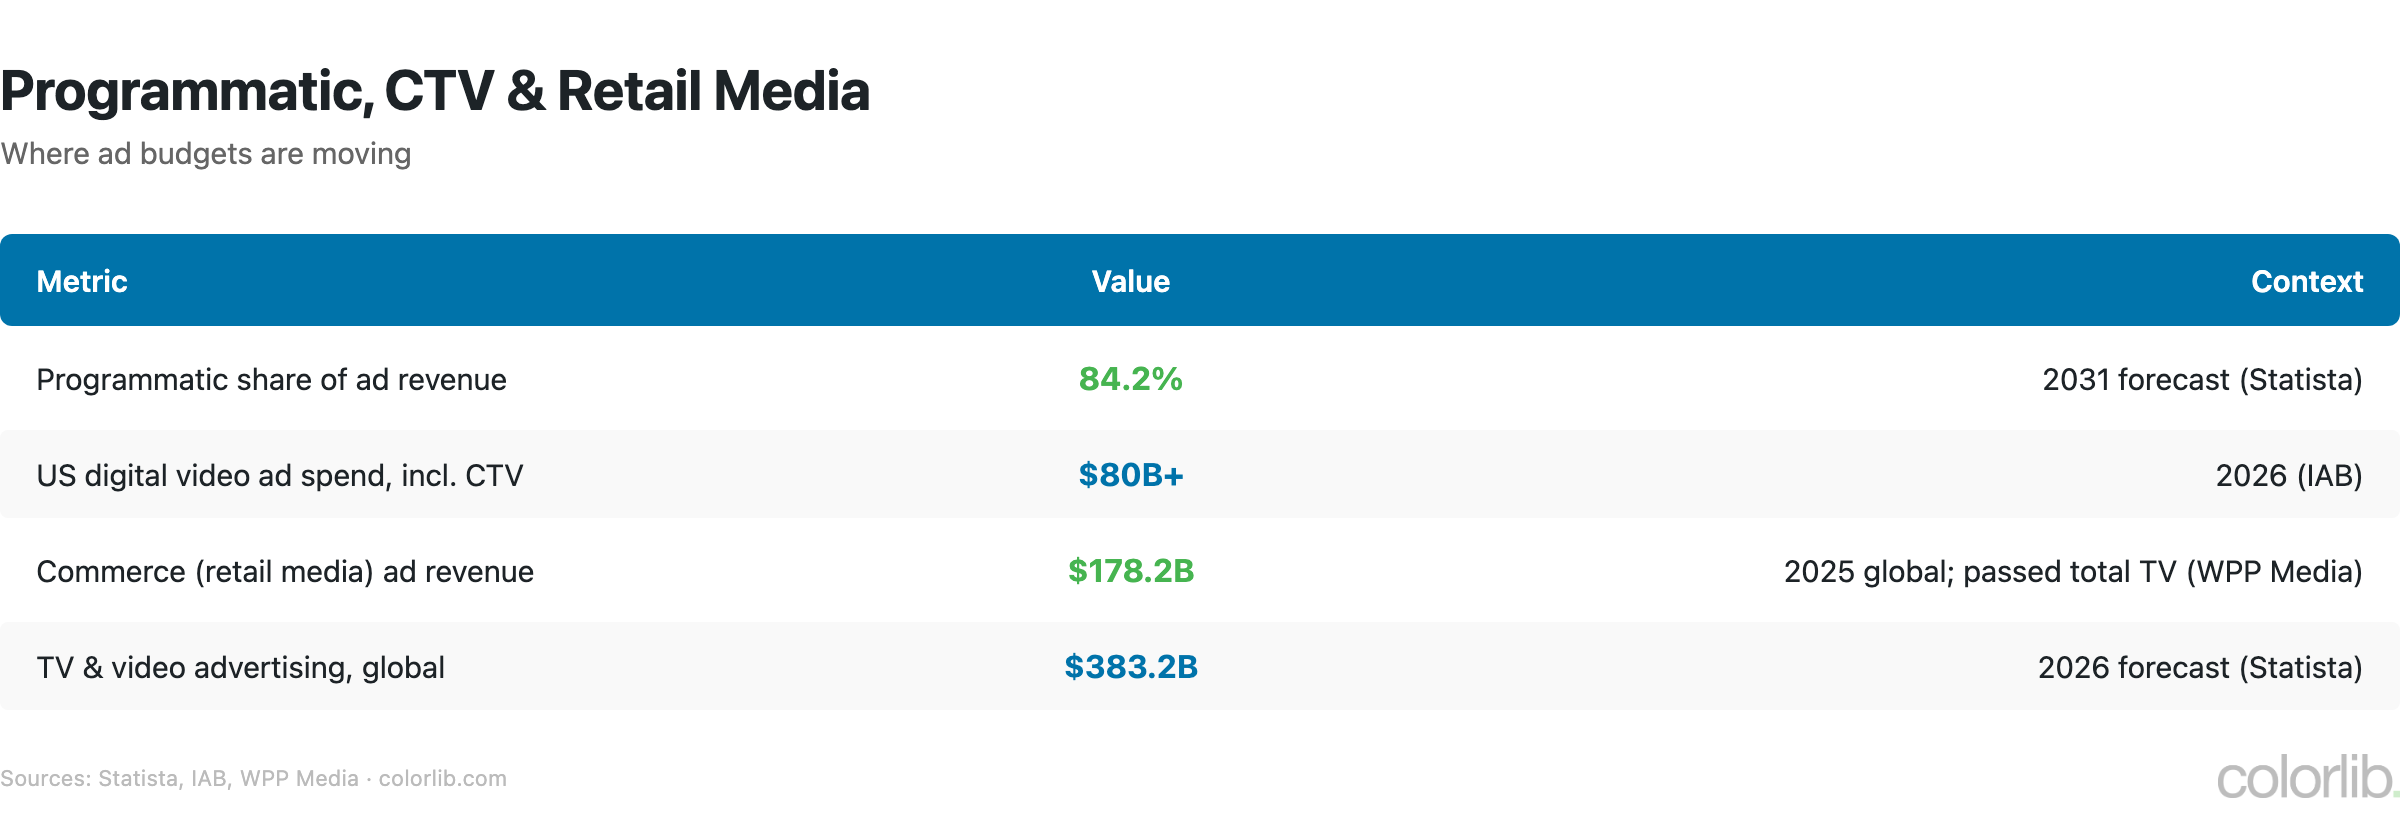
| US digital video ad spend (2026, incl. CTV) | $80+ billion | IAB |
| US internet ad revenue (2025) | ~$300 billion | IAB/PwC |
| Programmatic share of ad revenue (2031 forecast) | 84.2% | Statista |
| Digital share of ad spend (2031 forecast) | 84.1% | Statista |
| TV & video advertising, global (2026 forecast) | $383.2 billion | Statista |
- US digital video ad spend is set to pass $80 billion in 2026, outpacing the broader ad market (IAB)
- Statista forecasts that 84.2% of ad revenue will be traded programmatically by 2031
- Amazon made ads the default on Prime Video in 2024, joining Netflix and Disney+ in selling ad-supported streaming tiers
- Google dropped its plan to phase out third-party cookies in Chrome, but privacy laws and app-tracking limits keep first-party data central to targeting and measurement
ROI Benchmarks by Channel
| Channel | Average CPC / CTR | Conversion / Return |
|---|---|---|
| Google Search Ads | CPC $5.42, CTR 6.64% | Conversion rate 8.18%, CPL $66.69 |
| Facebook Ads (lead campaigns) | CPC $1.80, CTR 2.70% | Conversion rate 8.54%, CPL $27.39 |
| Facebook Ads (traffic campaigns) | CPC $0.60, CTR 1.93% | — |
| Email Marketing | — | 35% of marketing leaders see $10-$36 per $1; 35% see $36+ |
- Google Search CPCs keep rising (average $5.42), but cost per lead fell for the first time in five years to $66.69
- Facebook lead campaigns average $27.39 per lead, down from $27.66, with conversion rates up to 8.54%
- Facebook traffic campaigns average just $0.60 per click, down from $0.70
- Email remains the highest-return channel: 70% of marketing leaders report at least $10 back for every $1 spent (Litmus)
Key Takeaways
- Global ad revenue is past $1.1 trillion. It reached $1.14 trillion in 2025, and WPP Media expects 8.9% growth in 2026.
- The giants keep growing. Google ($294.7B) and Meta ($196.2B) took in more than $490 billion in 2025, and Amazon ($68.6B) is growing faster than both.
- Ad blocking is a real cost. 29.5% of internet users block ads, mainly because there are too many. CTV, in-app, and native formats bypass blockers.
- Video and CTV are the growth story. US digital video ad spend is passing $80 billion in 2026.
- Retail media is no longer a dark horse. Commerce advertising reached $178.2 billion in 2025 and passed total TV ad revenue for the first time.
- Search is changing shape. Traditional and generative search will take 21.8% of global ad revenue in 2026, as AI changes how people find products.
Sources
- WPP Media — This Year Next Year, December 2025
- WPP Media — This Year Next Year, Midyear 2026
- IAB/PwC — Internet Advertising Revenue Report, Full Year 2025
- IAB — 2026 Digital Video Ad Spend & Strategy Report
- Alphabet — Investor Relations
- Meta — Investor Relations
- Amazon — Investor Relations
- Statista — Advertising Market Outlook
- Backlinko — Ad Blocker Usage Statistics
- LocaliQ — Search Advertising Benchmarks
- Litmus — State of Email
Frequently Asked Questions
How much is spent on advertising worldwide?
Global advertising revenue reached $1.14 trillion in 2025, up 8.8% excluding US political advertising, according to WPP Media. Its June 2026 forecast expects 8.9% growth in 2026, and Statista projects US ad spend of $513 billion in 2026. Content-driven advertising (social, TV, video, audio, print and out-of-home) makes up 58% of the total, and commerce (retail media) reached $178.2 billion.
Which company makes the most money from advertising?
Google (Alphabet) leads with $294.7 billion in 2025 ad revenue, followed by Meta at $196.2 billion and Amazon at $68.6 billion. Microsoft’s search ads (Bing and Copilot) brought in $15.2 billion in its fiscal year to June 2026. For broader marketing context, see our digital marketing statistics.
How effective is CTV advertising?
CTV is the fastest-moving part of the video market: IAB expects US digital video ad spend, including CTV, to pass $80 billion in 2026, outpacing the broader ad market. Netflix, Disney+ and Amazon Prime Video all sell ad-supported tiers, and Prime Video made ads the default in 2024. CTV ads are also largely immune to ad blockers, which helps explain the shift of budgets from linear TV.
What percentage of people use ad blockers?
About 29.5% of internet users worldwide use ad blockers, with Indonesia (40.1%) and the US (32.5%) among the highest. In the US, 41% of 18-24 year olds block ads. The top reasons are too many ads (63.5%), obstructive ads (53.5%) and privacy concerns (42.4%). Advertisers are responding by shifting to ad-blocker-resistant formats like native content, CTV, and in-app advertising.
For related data, explore our digital marketing statistics, online shopping statistics, and lead generation statistics.

Related Posts






Comments (0)