
40+ Web Design Statistics Every Designer Should Know (2026)
Visitors judge a site’s look in a fraction of a second, mobile phones now account for more than half of web traffic, and fewer than half of mobile sites pass Google’s Core Web Vitals. Here are 40+ web design statistics covering the industry, jobs and pay, UX, mobile, performance and accessibility, each linked to its source.
Key Web Design Statistics (2026)
- US web design services market: $18.9 billion in 2026 (IBISWorld)
- 220,100 web developer and digital designer jobs in the US in 2025, projected to grow 5% by 2035 (BLS)
- Users form a first impression of a web page’s visual appeal in about 50 milliseconds (Lindgaard et al., 2006)
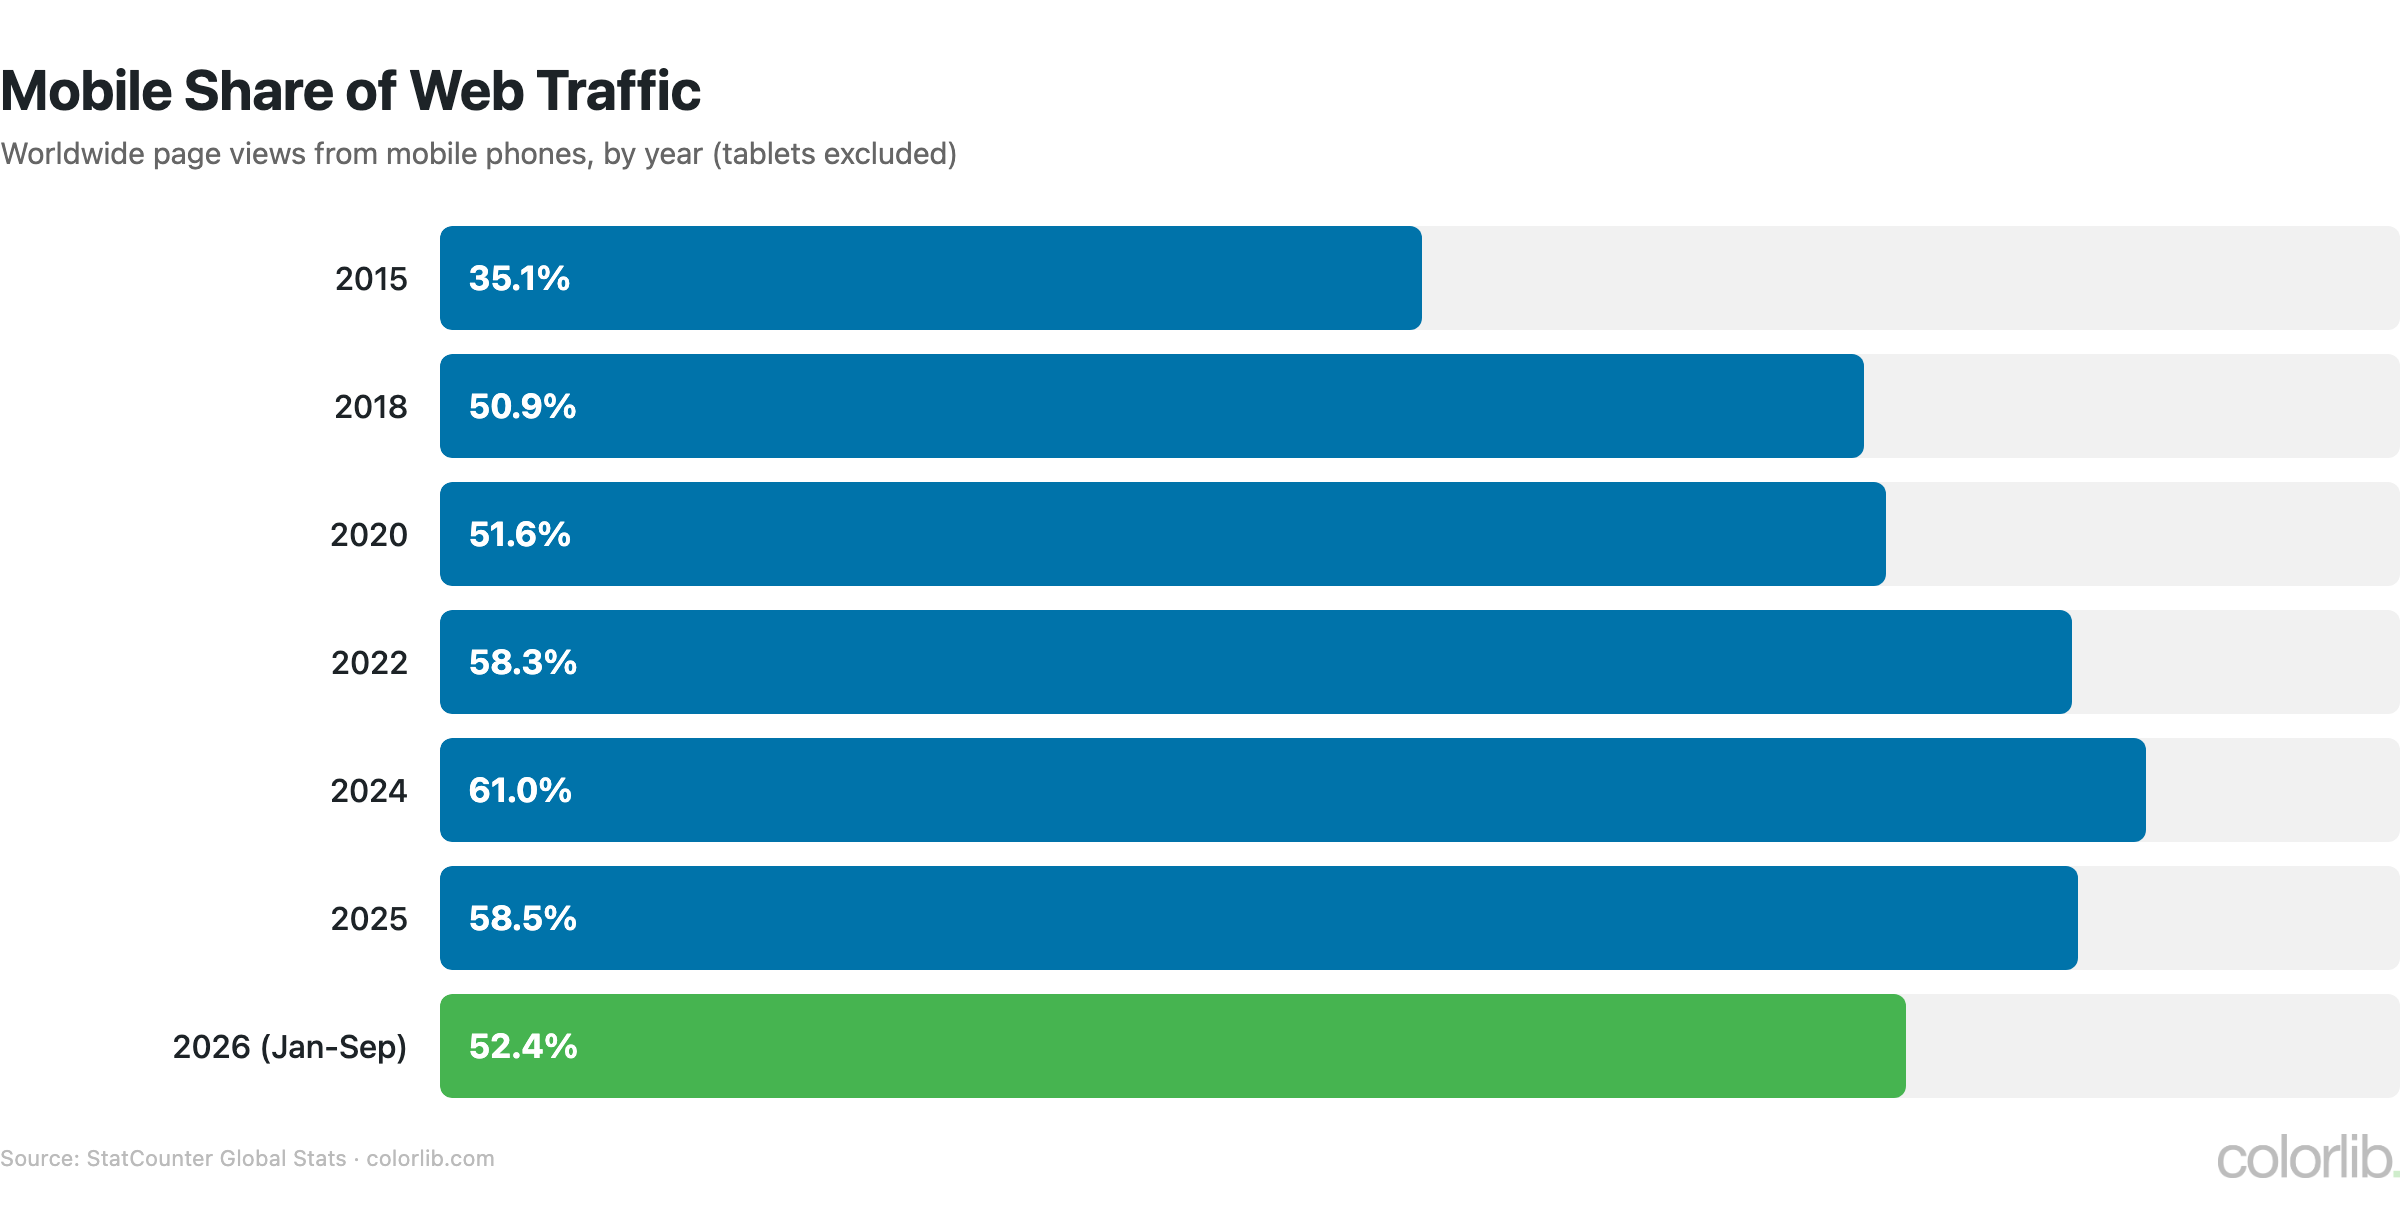
- Mobile phones generated 58.5% of web traffic in 2025 and 52.4% from January to September 2026 (StatCounter)
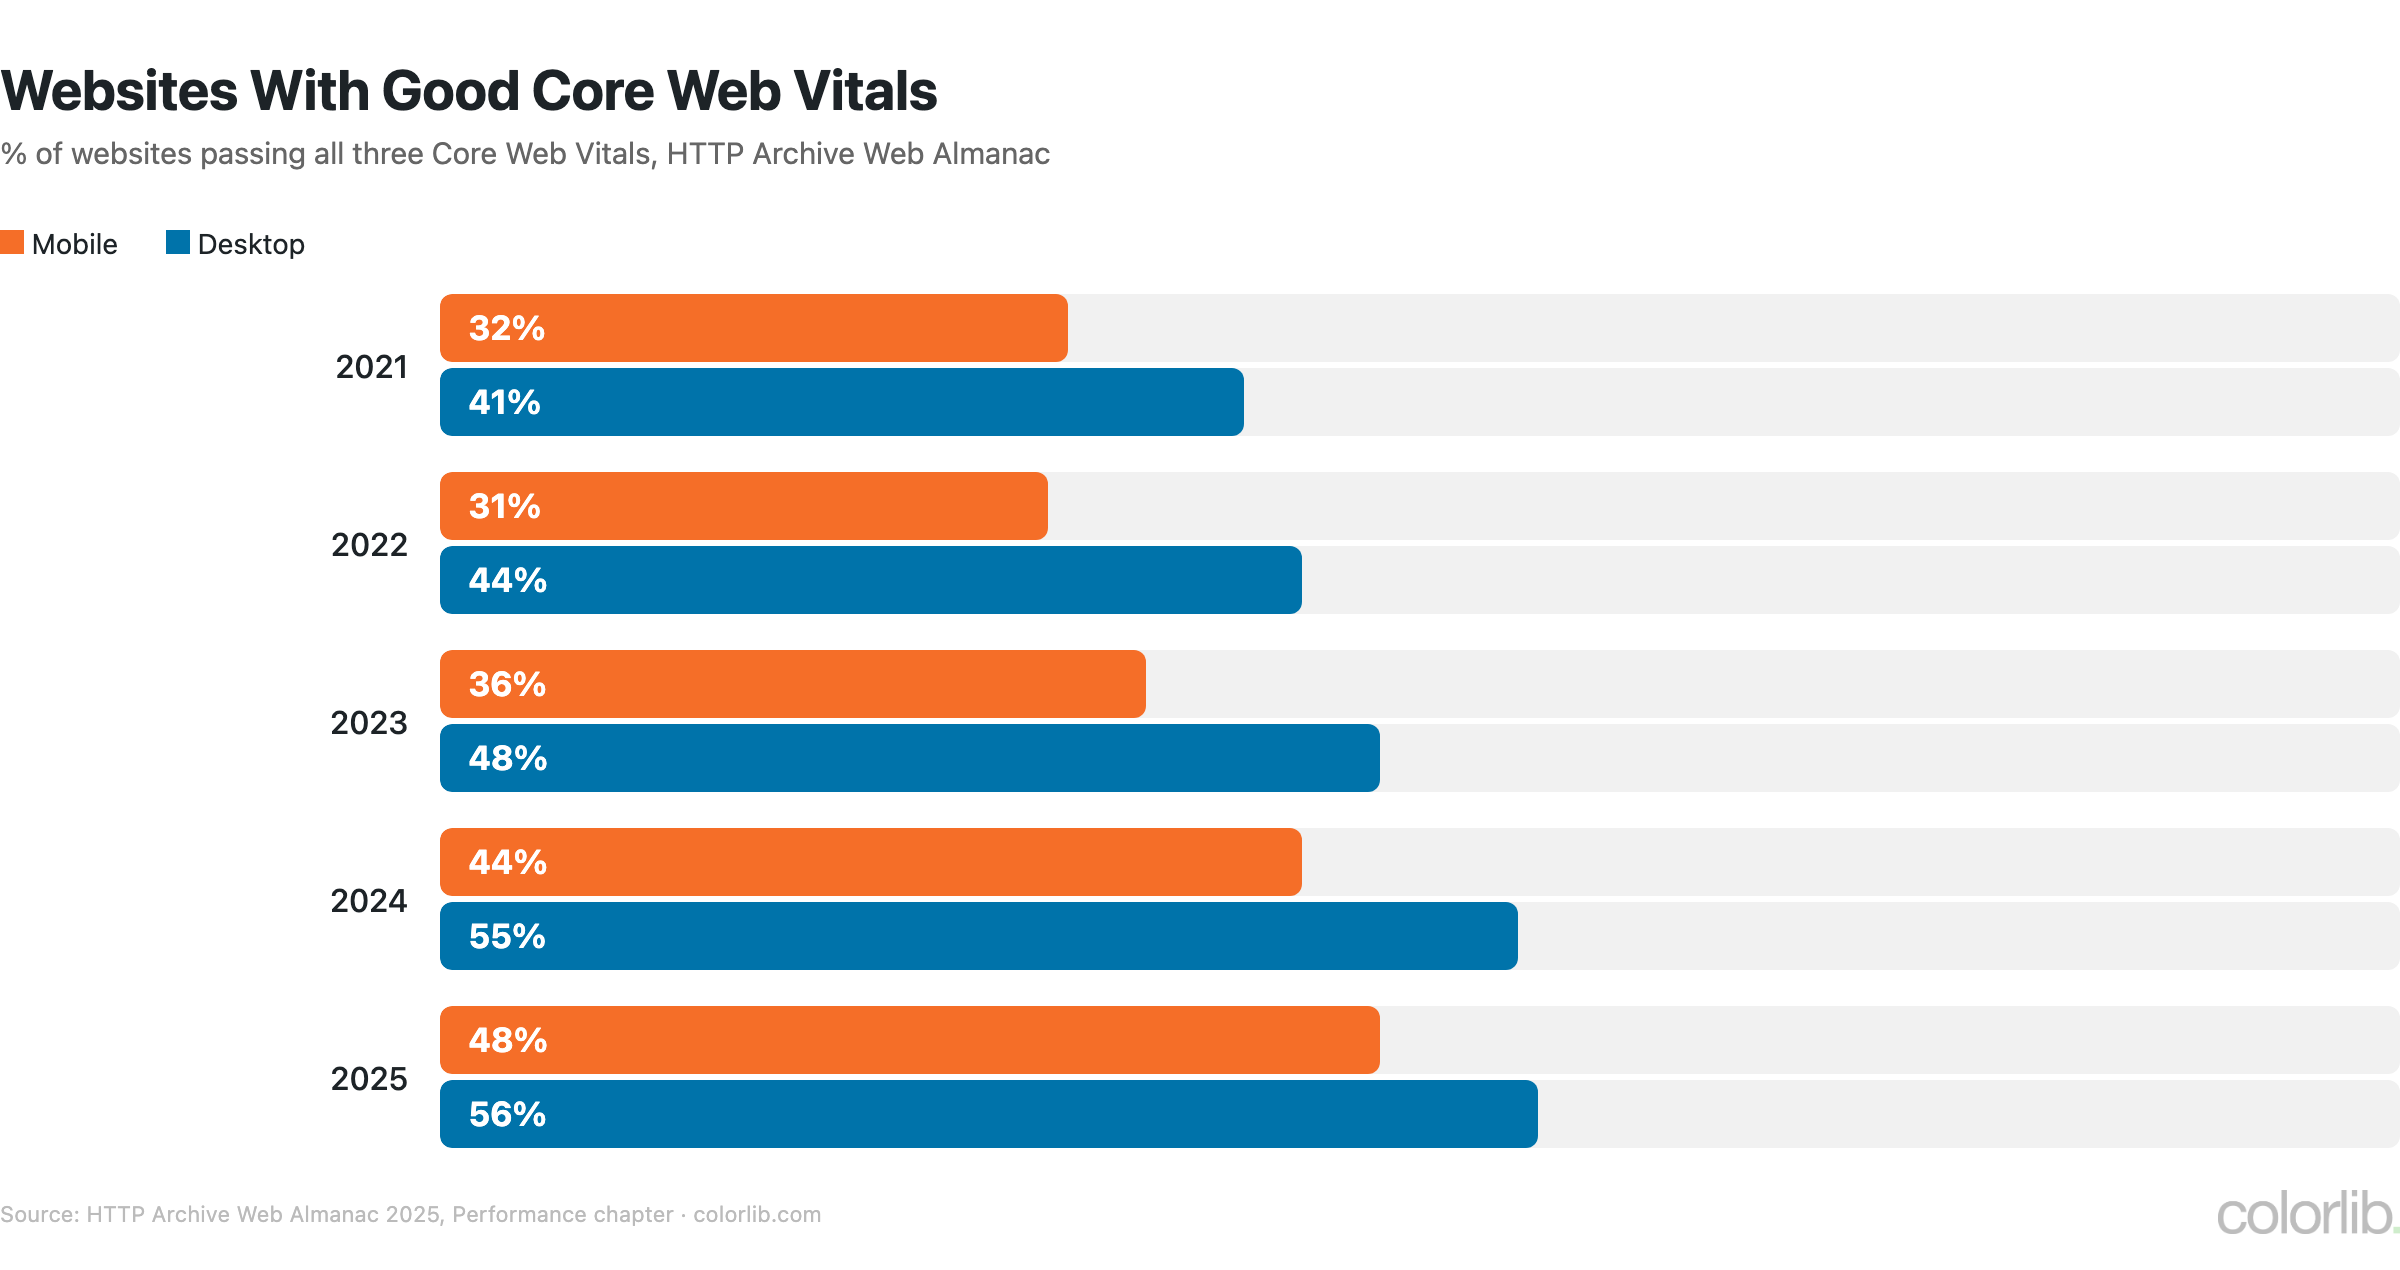
- Only 48% of mobile websites and 56% of desktop websites passed Core Web Vitals in 2025 (Web Almanac)
- 95.9% of the top million home pages have detectable WCAG 2 failures (WebAIM Million 2026)
Web Design Industry Size & Workforce
| Metric | Value | Source |
|---|---|---|
| US web design services market (2026) | $18.9 billion | IBISWorld |
| US market growth, 2021-2026 | 0.6% a year | IBISWorld |
| US web developer and digital designer jobs (2025) | 220,100 | BLS |
| Of which web and digital interface designers | 132,700 | BLS |
| Projected job growth, 2025-2035 | +5% (11,300 jobs), faster than average | BLS |
| Openings per year | ~13,600 | BLS |
| Median pay, web and digital interface designers (May 2025) | $104,000 | BLS |
| Median pay, web developers (May 2025) | $92,650 | BLS |
| US skilled knowledge workers who freelance (2025) | 28% | Upwork |
| Websites on the internet (July 2026) | 1.49 billion sites across 305 million domains | Netcraft |
UX/UI Design Statistics
| Statistic | Value | Source |
|---|---|---|
| Time to form a first impression of visual appeal | 50 milliseconds | Lindgaard et al., Behaviour & IT (2006) |
| Reasons for mistrusting health websites that were design-related | 94% | Sillence et al. (2004) |
| Credibility comments that mentioned a site’s visual design | 46.1% | Stanford (Fogg et al., 2002) |
| Online consumers less likely to return after a bad experience | 88% | Gomez (now Dynatrace) survey, widely cited |
| ROI of UX investment (rule of thumb) | $1 = $100 return | Forrester, “The Six Steps For Justifying Better UX” (2016) |
- In a 2012 Missouri University of Science and Technology eye-tracking study, users spent about 5.94 seconds looking at a site’s main image, after the logo, navigation, search box and social links
- 38% of people will stop engaging with a website if the content or layout is unattractive (Adobe State of Content, 2015)
- Testing shades of blue for ad links earned Google an extra $200 million a year, according to Google UK’s managing director (The Guardian)
Mobile & Responsive Design Statistics
| Metric | Value | Source |
|---|---|---|
| Mobile share of web traffic (2025) | 58.5% | StatCounter |
| Mobile share of web traffic (Jan-Sep 2026) | 52.4% (desktop 46.1%) | StatCounter |
| Tablet share of web traffic (Jan-Sep 2026) | 1.5% | StatCounter |
| Google mobile-first indexing | Complete (announced October 2023) | Google Search Central |
| Median mobile home page weight (July 2025) | 2,559 KB | Web Almanac 2025 |
| Mobile websites passing Core Web Vitals (2025) | 48% (desktop 56%) | Web Almanac 2025 |
- 74% of users said they were more likely to return to a mobile-friendly site, and 61% said they were unlikely to return to a mobile site they had trouble accessing (Google, “What Users Want Most From Mobile Sites Today”, 2012)
- Mobile traffic share peaked at 61.0% in 2024 and has eased since, as desktop share recovered to 46.1% in 2026 so far (StatCounter)
Website Performance & Speed Impact
| Metric | Value | Source |
|---|---|---|
| Mobile visits abandoned if a page takes over 3 seconds to load | 53% | Google/DoubleClick research (2016) |
| Conversion impact of a 100ms delay | -7% conversions | Akamai Online Retail Performance Report (2017) |
| Websites with good Core Web Vitals (2025) | 48% mobile, 56% desktop | Web Almanac 2025 |
| Median desktop home page weight (July 2025) | 2,862 KB | Web Almanac 2025 |
| Images as share of median mobile home page weight | ~36% (911 KB) | Web Almanac 2025 |
| JavaScript on the median mobile home page | 632 KB | Web Almanac 2025 |
- Amazon found that every 100ms of added latency cost about 1% in sales, according to former Amazon engineer Greg Linden
- Pinterest cut perceived wait times by 40% and saw a 15% increase in search engine traffic and sign-ups (Pinterest Engineering)
- The BBC lost an additional 10% of users for every extra second its site took to load (web.dev)
- Vodafone improved Largest Contentful Paint by 31% and increased sales by 8% (web.dev)
- Core Web Vitals became a Google ranking signal through the page experience update, rolled out for mobile in 2021 and desktop in 2022
Web Design Trends & Tools (2025-2026)
| Trend / Tool | Adoption | Source |
|---|---|---|
| Figma | Revenue up 48% year over year in Q2 2026 | Figma |
| AI design tools | 69% of designers satisfied; 54% say AI improves quality | Figma 2025 AI Report |
| Dark mode | 81.9% of Android Authority readers use it on their phones (2020) | Android Authority |
| Dark mode support in CSS | prefers-color-scheme on 8% of pages (2022) | Web Almanac 2022 |
| Low-contrast text | On 83.9% of top home pages (2026) | WebAIM Million 2026 |
- 95.9% of the top million home pages have WCAG 2 failures, up from 94.8% in 2025; the most common is low-contrast text (WebAIM)
- Home pages average 34 low-contrast text instances each, up 15% from 2025 (WebAIM)
Key Takeaways
- Design is judged instantly. First impressions of visual appeal form in about 50 milliseconds, and 94% of reasons for mistrusting health sites in one study were design-related.
- Mobile is half the web. Phones generated 58.5% of traffic in 2025, though desktop has regained ground in 2026. Design for both.
- Speed is design. Fewer than half of mobile sites pass Core Web Vitals, and case studies from Vodafone, the BBC and Pinterest tie speed to revenue and retention.
- Digital design pays. Web and digital interface designers earn a median of $104,000 and the field is projected to grow 5% by 2035.
- Accessibility is getting worse, not better. 95.9% of top home pages fail WCAG checks, with low contrast the most common problem.
Sources
- Bureau of Labor Statistics — Web Developers and Digital Designers
- IBISWorld — Web Design Services in the US
- StatCounter — Desktop vs Mobile vs Tablet Market Share
- HTTP Archive — Web Almanac 2025: Performance
- HTTP Archive — Web Almanac 2025: Page Weight
- WebAIM — The WebAIM Million (2026)
- Netcraft — July 2026 Web Server Survey
- Lindgaard et al. — Attention web designers: You have 50 milliseconds to make a good first impression (2006)
- Stanford Web Credibility Research
- web.dev — Why speed matters
- Figma — 2025 AI Report
Frequently Asked Questions
How many web designers are there in the US?
The BLS counted 220,100 web developer and digital designer jobs in the US in 2025, including 132,700 web and digital interface designers. Many more people design websites under other titles, such as graphic designers (253,100 jobs) and UX designers.
What is the average web designer salary?
The BLS median for web and digital interface designers was $104,000 in May 2025, against $92,650 for web developers and $62,960 for graphic designers. Rates for freelancers vary widely by specialty and market. For more on design careers, see our graphic design statistics.
Why is mobile-first design important?
Mobile phones generated 58.5% of web traffic in 2025 (StatCounter), and Google completed its move to mobile-first indexing in 2023, so the mobile version of a site is the one Google ranks. Mobile is also where performance lags: only 48% of mobile websites passed Core Web Vitals in 2025, against 56% on desktop.
How often should you redesign a website?
There is no reliable industry-wide figure for how often sites are redesigned, so let signals drive the decision: failing Core Web Vitals, layouts that break on phones, accessibility failures such as low-contrast text, or declining conversion rates. Regular content and UX updates between full redesigns extend a site’s effectiveness. Check our website color statistics for design inspiration.
Looking for design inspiration? Browse our developer portfolio examples, explore graphic design statistics, or check our website color statistics.

Related Posts






Comments (0)