

50+ SEO Statistics Every Marketer Should Know (2026)
Organic search drove 53% of trackable website traffic in BrightEdge’s channel research, and Google handles more than 5 trillion searches a year. Yet 96.55% of pages get zero organic traffic from Google, the average #1 ranking page is 5 years old, and 68% of US Google searches ended without a click in early 2026, so the gap between SEO winners and losers continues to widen. Here are 50+ SEO statistics covering organic search, rankings, technical SEO, content strategy, and industry trends for 2026.
Key SEO Statistics (2026)
- 53% of trackable website traffic comes from organic search (BrightEdge)
- SEO costs $2,917 per month on average (Ahrefs)
- 68% of trackable website traffic comes from organic and paid search combined (BrightEdge)
- Google handles 5 trillion+ searches per year (Google)
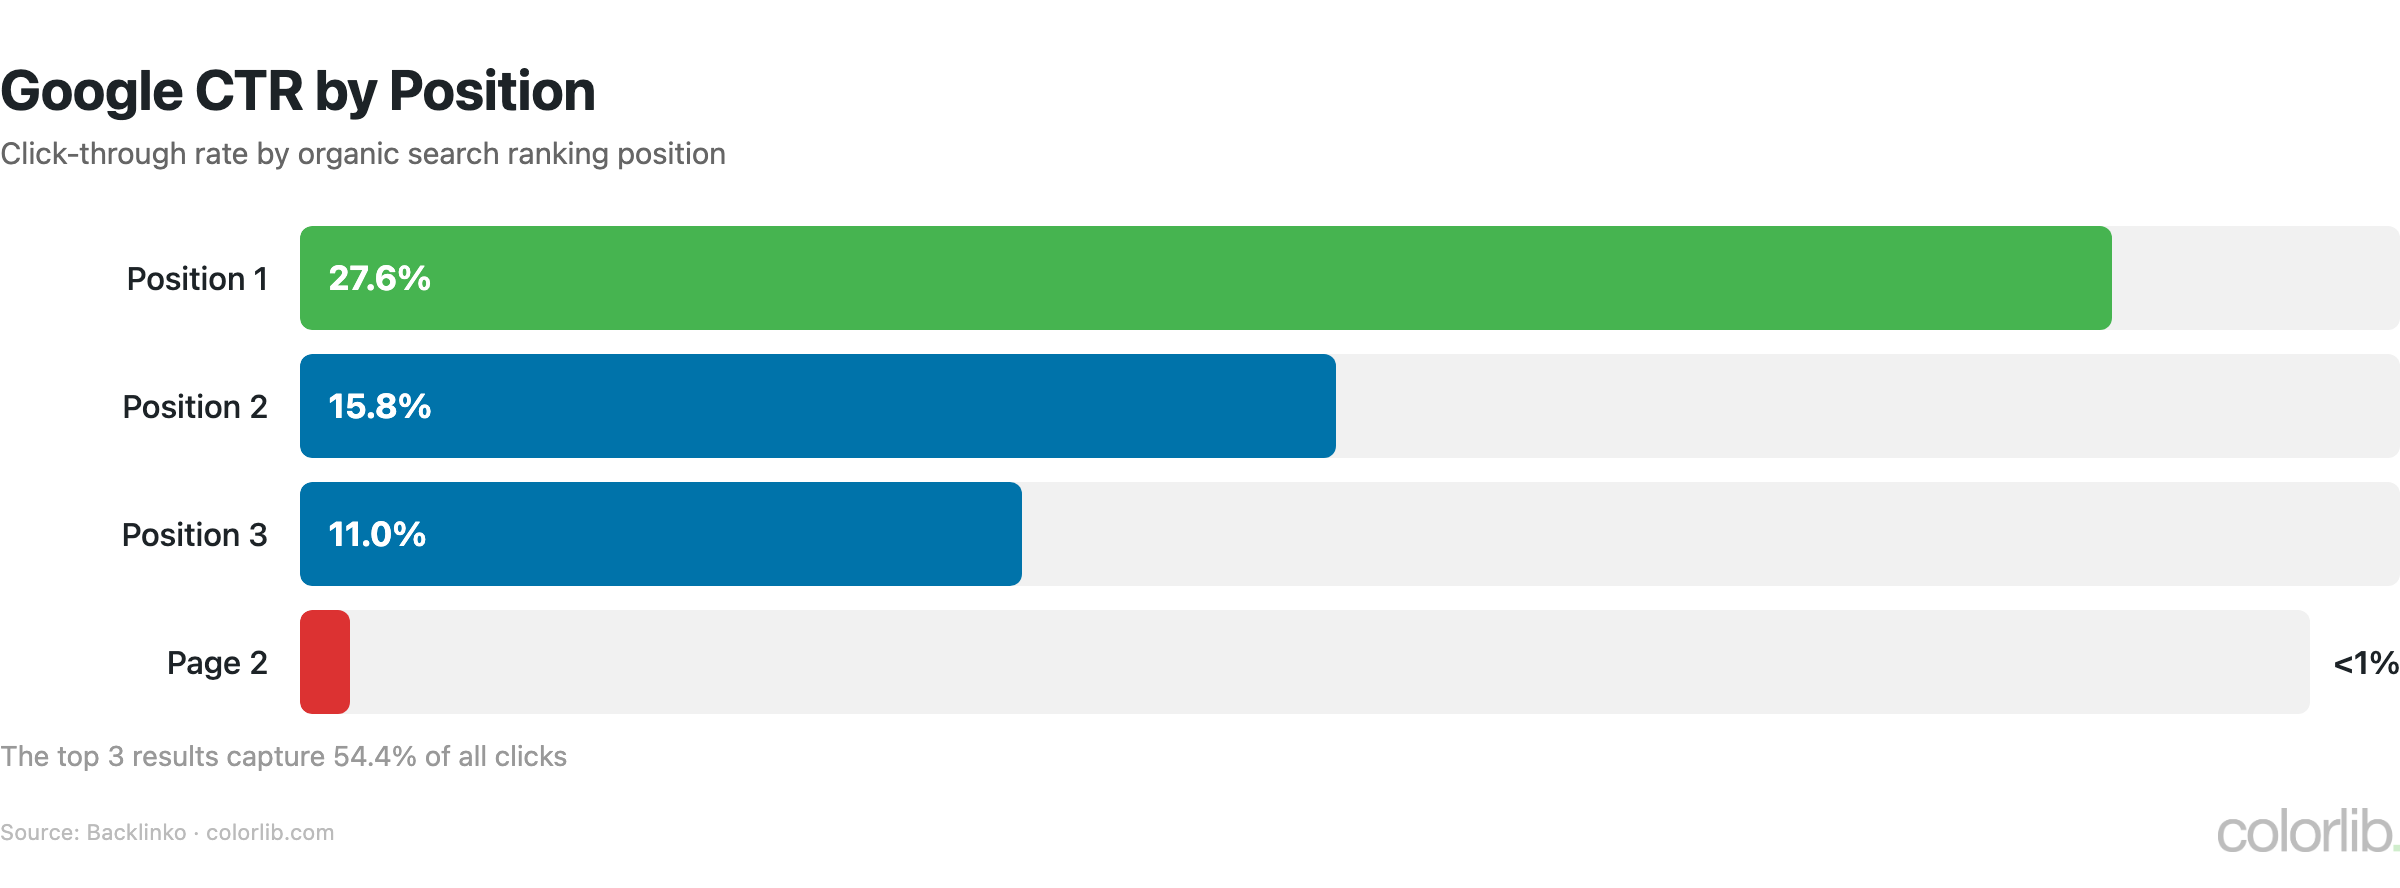
- The #1 organic result gets 27.6% of all clicks (Backlinko)
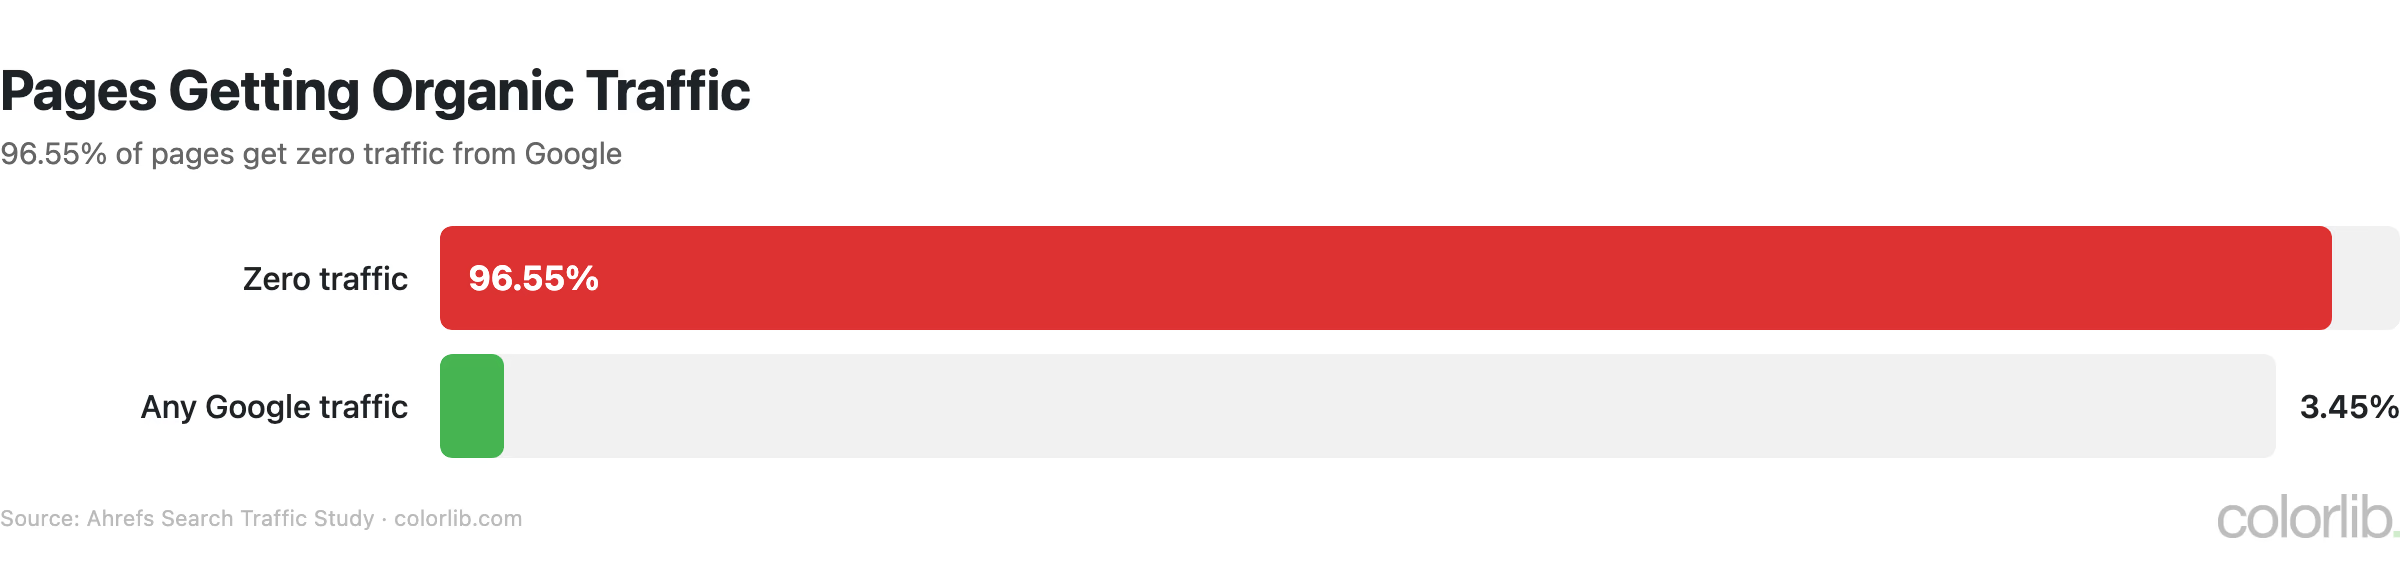
- 96.55% of all pages get zero traffic from Google (Ahrefs)
- The average #1 ranking page is 5 years old (Ahrefs)
SEO Industry & Pricing
| Metric | Value | Source |
|---|---|---|
| Average SEO cost | $2,917/month | Ahrefs |
| Average agency fee | $3,209/month | Ahrefs |
| Average freelancer fee | $1,348/month | Ahrefs |
| Average local SEO cost | $1,557/month | Ahrefs |
| Businesses spending $500-$5,000/month | 63% | Ahrefs |
| SEOs charging monthly retainers | 78.2% | Ahrefs |
| Marketers exploring SEO updates for search changes | 41% | HubSpot |
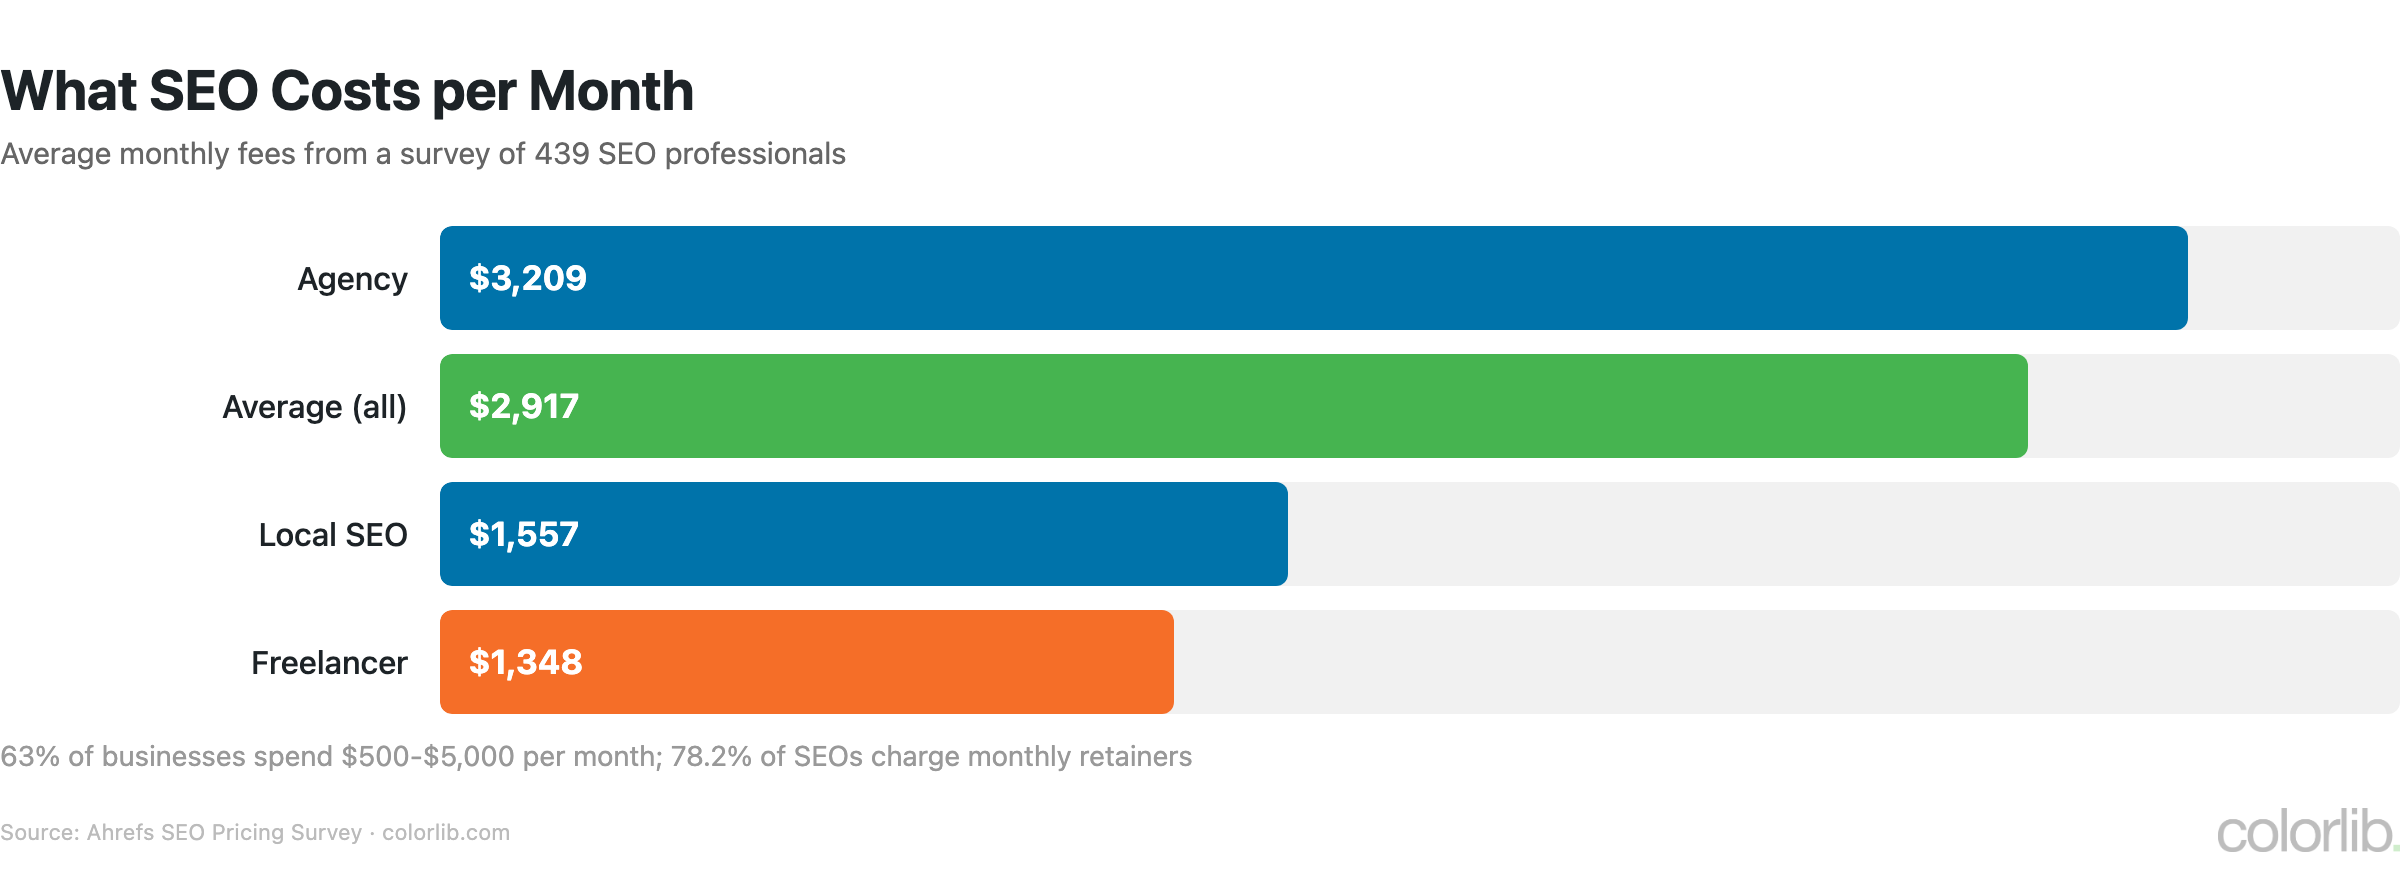
- SEO costs $2,917 per month on average, and most businesses (63%) spend between $500 and $5,000 per month, according to an Ahrefs survey of 439 SEO professionals
- Agencies charge $3,209 per month on average, versus $1,348 for freelancers
- 41% of marketers say the top trend they are exploring is updating their SEO strategy for changes in search (HubSpot)
- 78.2% of SEOs charge monthly retainers for some or all of their services, and local SEO averages $1,557 per month
- For how CMS platforms affect your SEO, see our CMS market share analysis
Search Engine Landscape
| Search Engine | Global Market Share | US Market Share |
|---|---|---|
| 89.9% | 85.2% | |
| Bing | 5.3% | 9.9% |
| Yahoo | 1.4% | 2.6% |
| Yandex | 1.3% | 0.3% |
| DuckDuckGo | 0.7% | 1.8% |
| Baidu | 0.4% | <0.1% |
- Google handles more than 5 trillion searches a year — roughly 158,000 queries every second (Google)
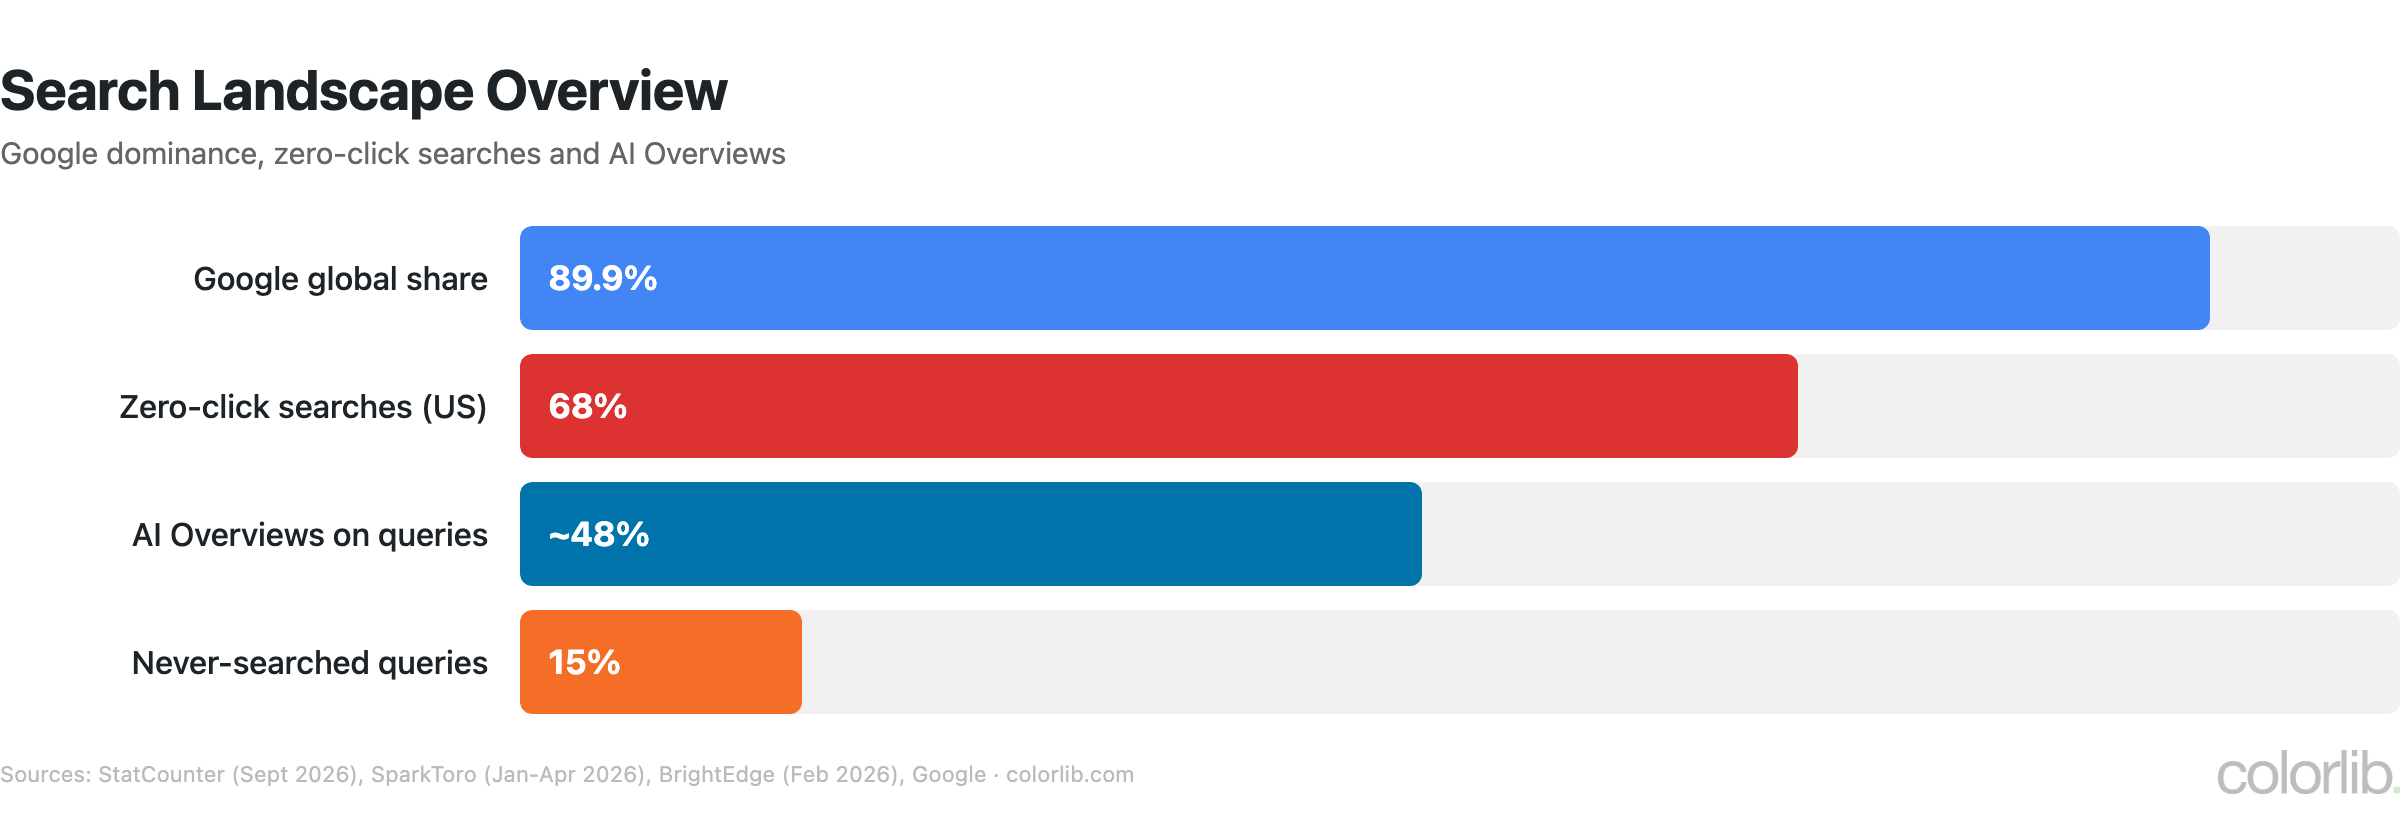
- 15% of daily Google searches have never been searched before, requiring continuous content creation for new queries
- AI Overviews appeared on about 48% of tracked Google queries in February 2026 (BrightEdge), fundamentally changing how users consume search results
- Zero-click searches accounted for 68% of US Google searches in January–April 2026 (SparkToro) — users find answers directly on the SERP
- Featured snippets appeared on 12.3% of search queries in Ahrefs’ 2017 study, providing instant answers above organic results
Organic Traffic Statistics
| Metric | Value | Source |
|---|---|---|
| Trackable traffic from organic search | 53% | BrightEdge |
| Pages with zero Google traffic | 96.55% | Ahrefs |
| #1 result CTR | 27.6% | Backlinko |
| #2 result CTR | 15.8% | Backlinko |
| #3 result CTR | 11.0% | Backlinko |
| Page 2 results CTR | <1% | Backlinko |
| Keywords with <10 monthly searches | ~93% of Ahrefs’ US keyword database | Ahrefs |
- The top 3 organic results capture 54.4% of all clicks, leaving less than half for positions 4-10
- Long-tail keywords dominate: keywords with fewer than 10 searches per month make up almost 93% of Ahrefs’ US keyword database
- Pages ranking in position 1 get 10x more clicks than pages in position 10
- Only 3.45% of all indexed pages receive any traffic from Google at all — content quality and authority are the primary gatekeepers
On-Page SEO Statistics
| Factor | Impact | Source |
|---|---|---|
| Title tags of 40-60 characters | 8.9% higher CTR | Backlinko |
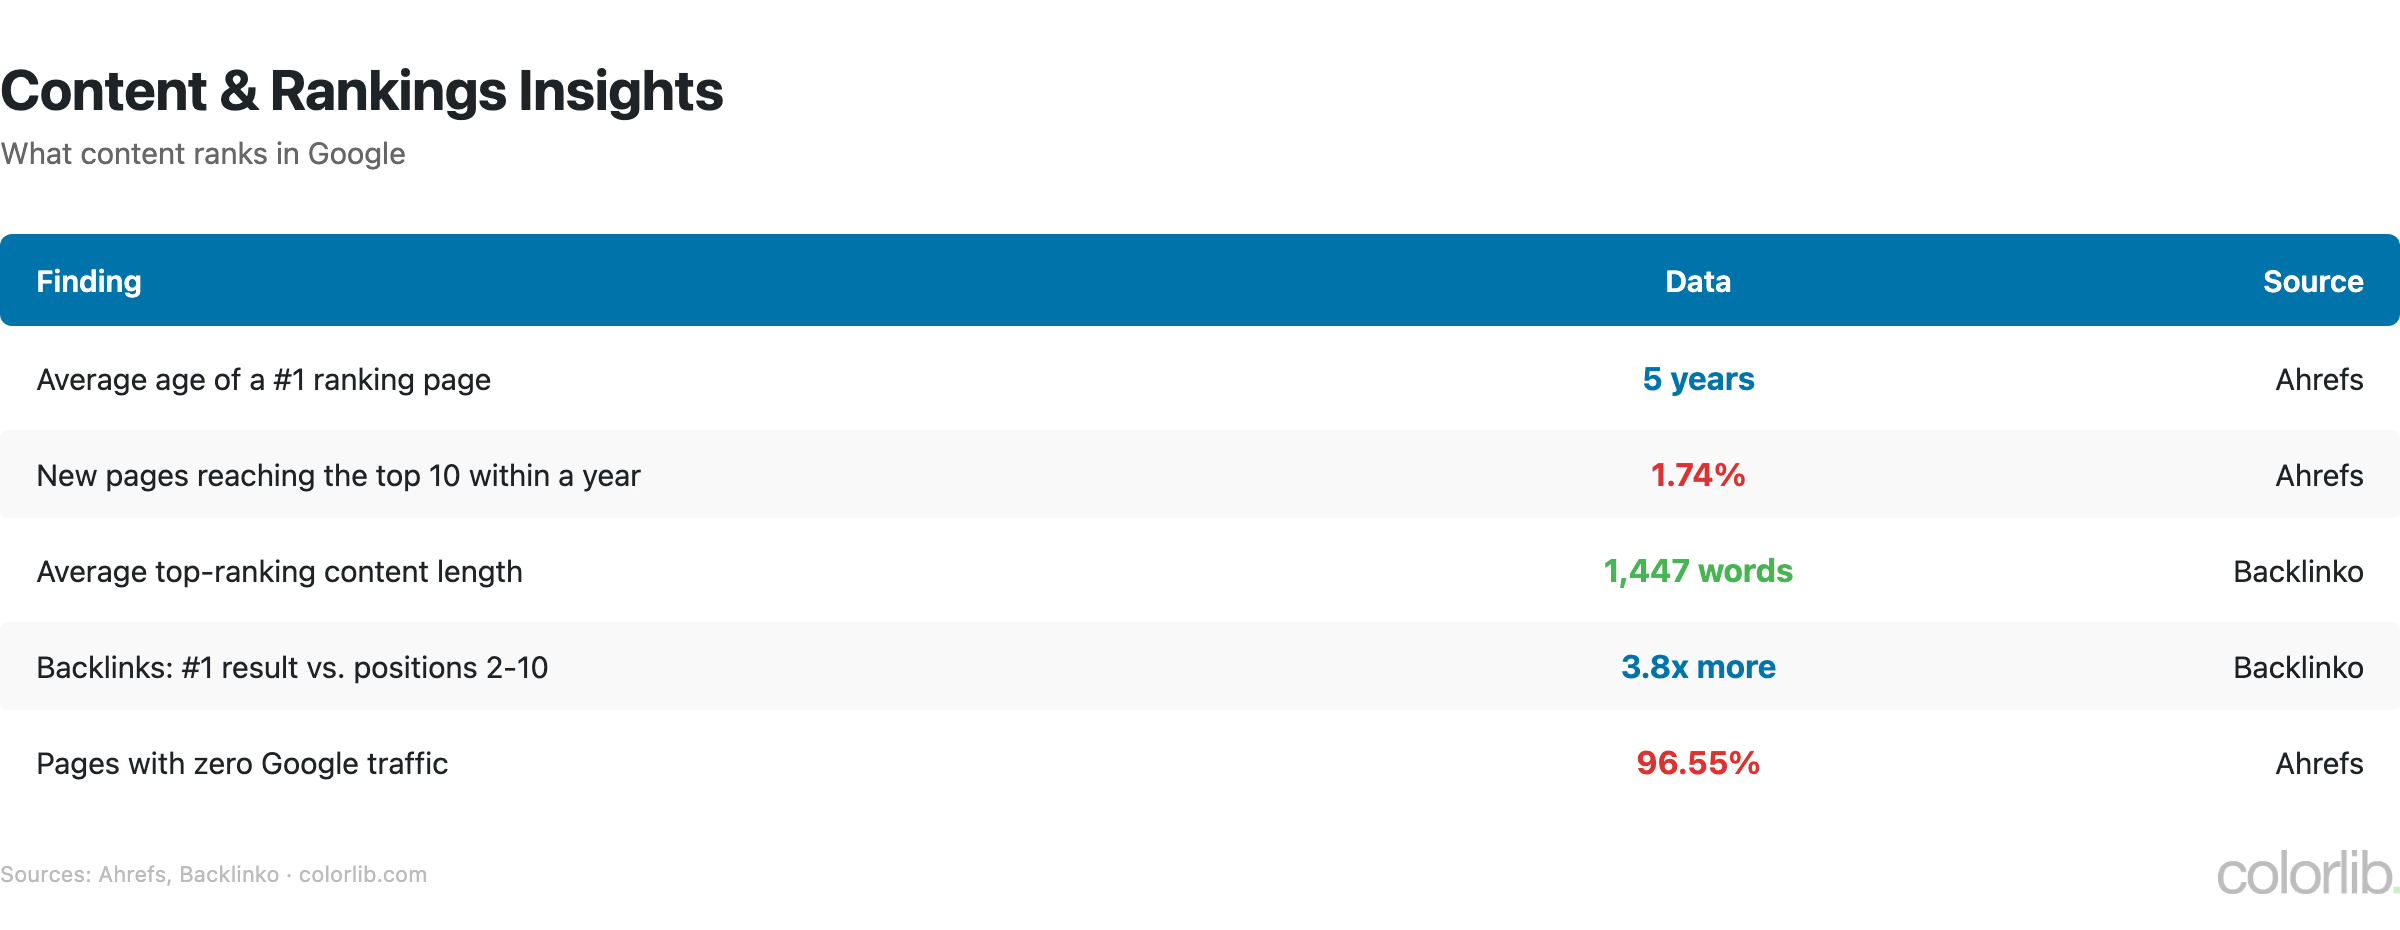
| Average top-ranking content length | 1,447 words | Backlinko |
| Keyword-rich URLs | 45% higher CTR | Backlinko |
| Average #1 ranking page age | 5 years | Ahrefs |
| Internal links correlation | Positive with rankings | Ahrefs |
| JSON-LD structured data adoption | 55.8% of websites | W3Techs |
- The average #1 ranking page is 5 years old — only 1.74% of newly published pages reach the top 10 within a year, down from 5.7% in 2017
- Google’s structured data case studies report a 25% higher CTR for Rotten Tomatoes pages with structured data and an 82% higher CTR for Nestlé pages shown as rich results (Google)
- Title tags between 40 and 60 characters have an 8.9% higher average CTR than titles outside that range
Technical SEO Statistics
| Metric | Value | Source |
|---|---|---|
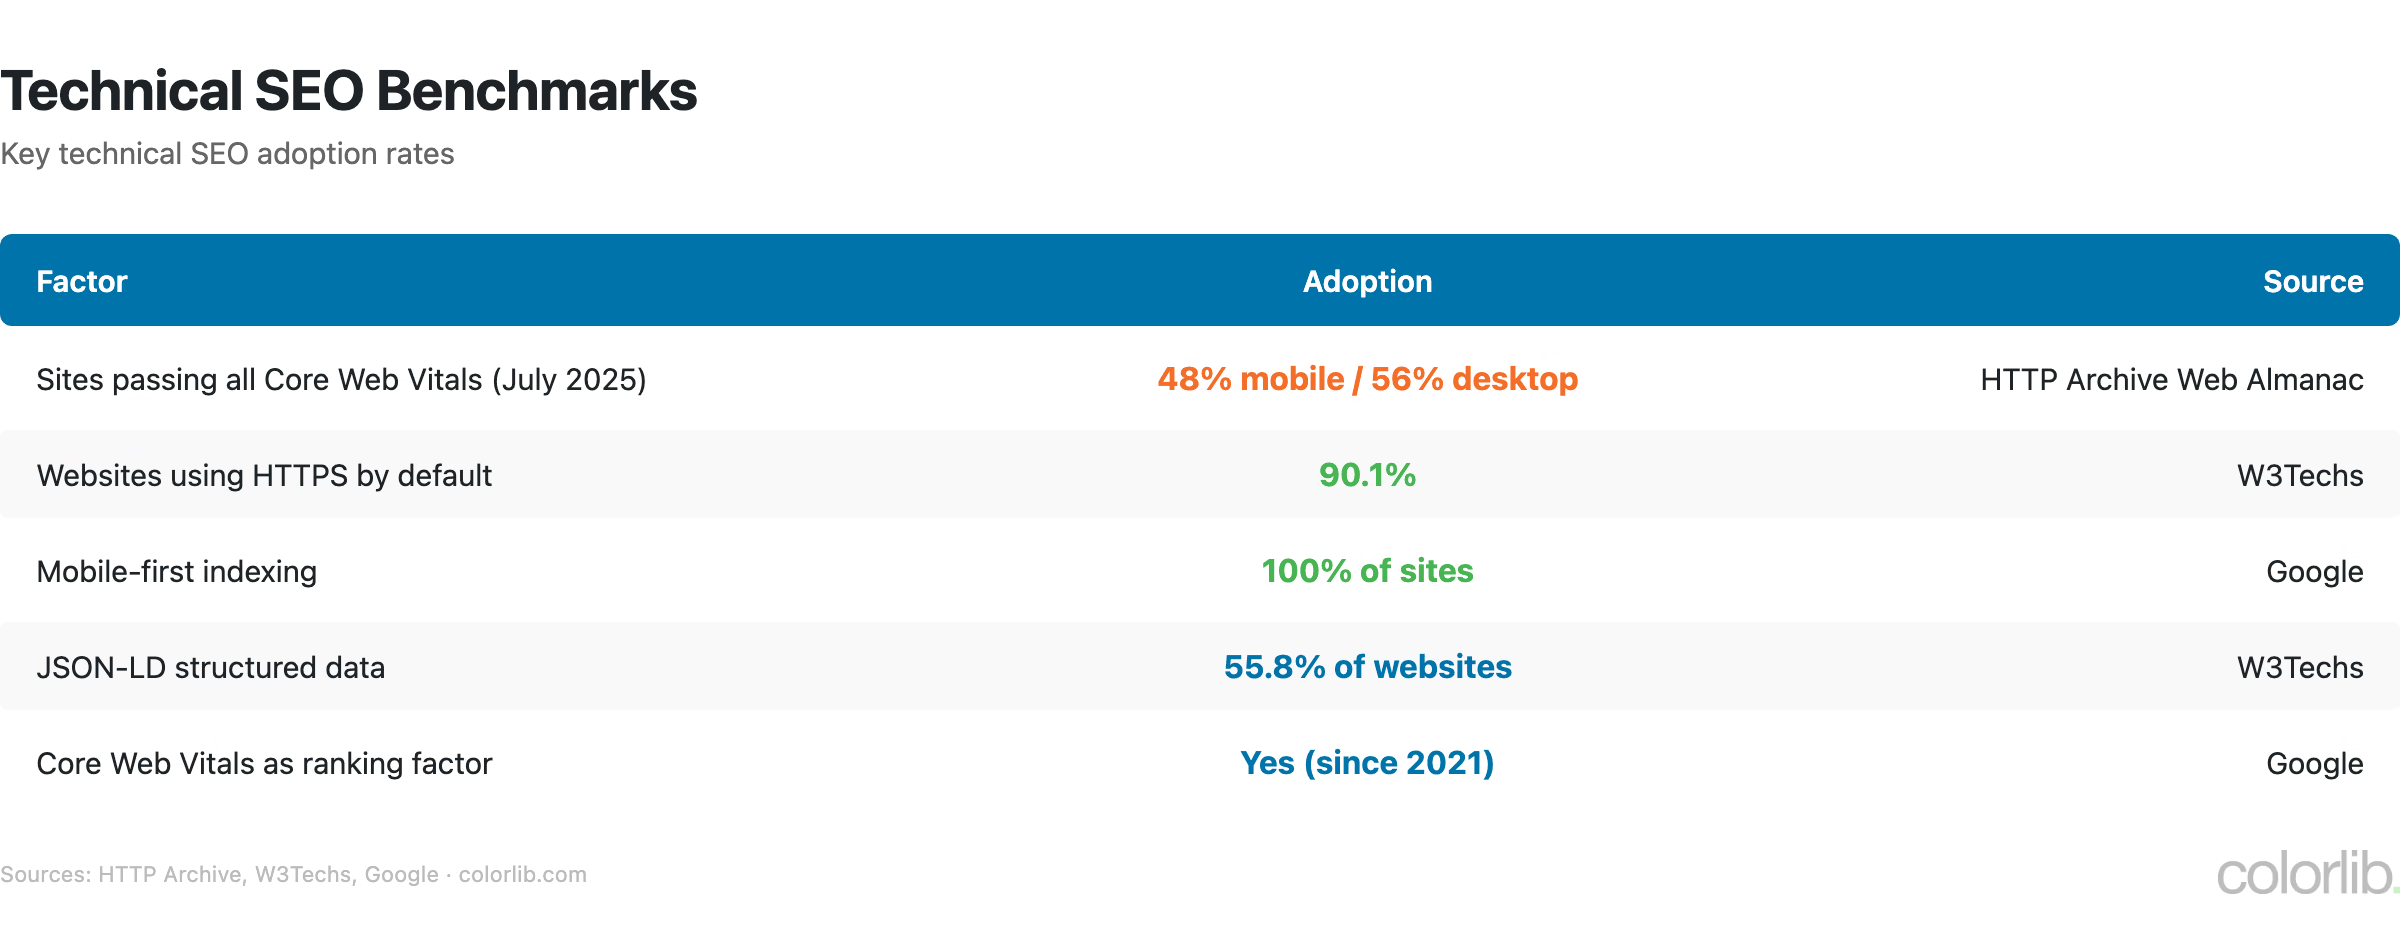
| Core Web Vitals as ranking factor | Yes (since 2021) | |
| Sites passing all CWV (July 2025) | 48% mobile / 56% desktop | HTTP Archive Web Almanac |
| Sites using HTTPS by default | 90.1% | W3Techs |
| Mobile-first indexing | 100% of sites |
- Google now uses mobile-first indexing for 100% of websites — desktop-only sites are indexed based on their mobile version
- 48% of mobile websites and 56% of desktop websites passed all three Core Web Vitals metrics (LCP, INP, CLS) in July 2025
- HTTPS is the default protocol on 90.1% of websites — Google treats HTTPS as a ranking signal
Content & Rankings Statistics
| Metric | Value | Source |
|---|---|---|
| Blog posts published daily (estimate) | 7.5 million | Internet Live Stats |
| Average referring domains for #1 | 3.8x more than positions 2-10 | Backlinko |
| AI-generated content detection | Improving but not penalized | |
| Backlinks remain top ranking factor | Yes | Backlinko |
- The #1 ranking result has 3.8x more backlinks than positions 2 through 10 on average
- Google’s stance on AI content: quality matters, not production method — but thin AI content is still penalized
- For content strategy insights that affect web design, see our web design statistics roundup
Key Takeaways
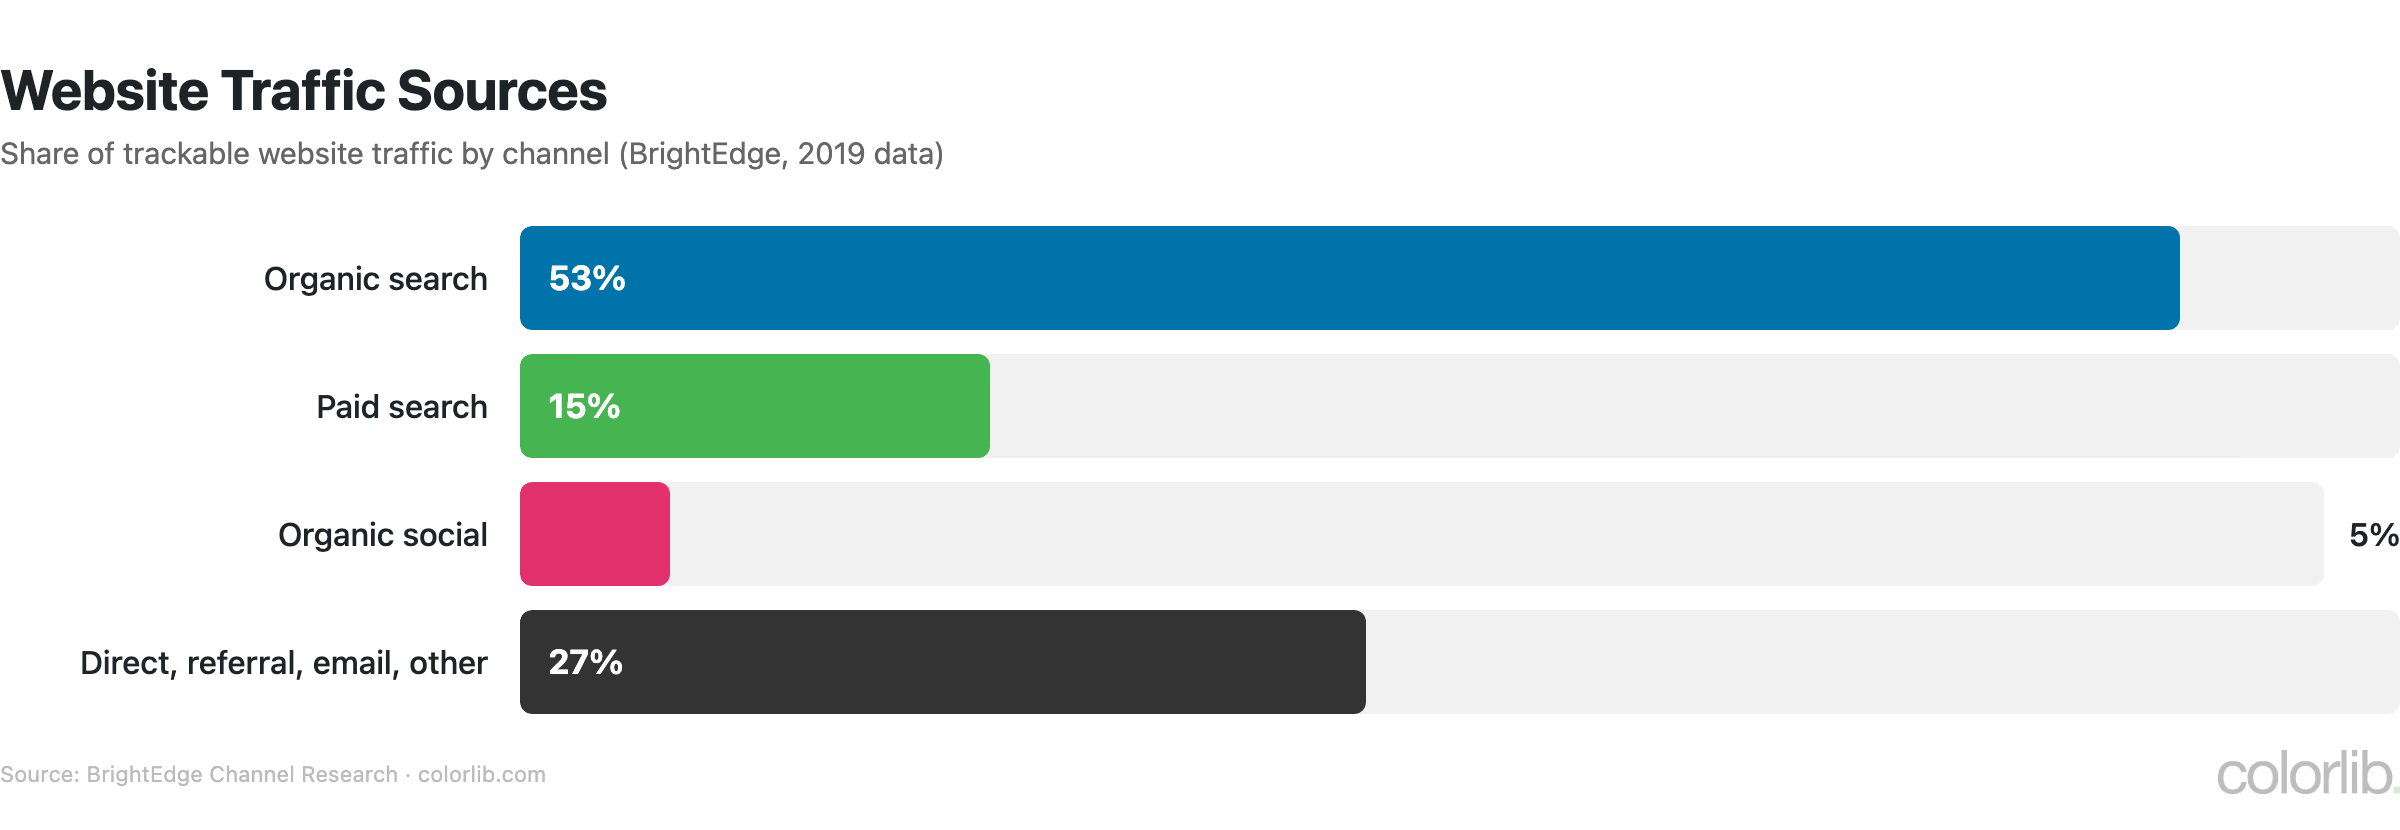
- Organic search dominates web traffic. Organic search drove 53% of trackable website traffic in BrightEdge’s research — more than paid search (15%) and organic social (5%) combined.
- The SEO gap is extreme. The #1 result gets 27.6% of clicks while 96.55% of pages get zero traffic. Ranking on page 1 is essentially a winner-takes-all competition.
- Technical SEO is table stakes. With Core Web Vitals as a ranking factor and mobile-first indexing at 100%, site speed and mobile experience are non-negotiable.
- AI is reshaping search behavior. AI Overviews on about half of tracked queries and zero-click searches at 68% of US Google searches mean SEO must optimize for visibility, not just clicks.
- Content quality beats content volume. Long-form, regularly updated content with strong backlink profiles outperforms high-frequency publishing of thin content.
- SEO rewards patience. The average #1 ranking page is 5 years old and only 1.74% of new pages reach the top 10 within a year, so SEO is a long-term investment rather than a quick win.
Sources
- BrightEdge — Organic Share of Traffic Increases to 53%
- Ahrefs — Search Traffic Study
- Backlinko — Google CTR Statistics
- StatCounter — Search Engine Market Share
- HTTP Archive — Web Almanac 2025: Performance
- Ahrefs — SEO Pricing Survey
- Ahrefs — How Long Does It Take to Rank in Google?
- HubSpot — Marketing Statistics
- Google — Core Web Vitals Documentation
Frequently Asked Questions
How much traffic comes from organic search?
In BrightEdge’s channel research (2019 data), organic search drove 53% of trackable website traffic, making it the largest single traffic channel. For B2B companies, the share was even higher at 64%. Paid search accounted for about 15%, organic social 5%, and the rest came from direct, referral, email and other sources.
What percentage of Google searches result in a click?
Fewer than one in three US Google searches result in a click. SparkToro’s 2026 study, based on Similarweb data, found that 68% of US Google searches in January–April 2026 were zero-click searches where users find their answer directly on the search results page through featured snippets, knowledge panels, AI Overviews, or People Also Ask boxes. This trend is accelerating as Google integrates more AI-generated answers directly into SERPs.
How long does it take to rank on Google?
The average #1 ranking page is 5 years old, and only 1.74% of newly published pages reach the top 10 within one year, according to Ahrefs. 72.9% of pages in Google’s top 10 are more than 3 years old. Pages that do break in often do so quickly, though: 40.82% of pages that reached the top 10 got there within a month. Consistent content creation, quality backlinks, and technical optimization are the primary factors that accelerate ranking. For the full picture, see our WordPress statistics on how CMS choice impacts SEO performance.
Is SEO still worth it in 2026?
Absolutely. Despite AI Overviews and zero-click searches, organic search drove 53% of trackable web traffic in BrightEdge’s research, and Google says its query volume reached an all-time high in early 2026. While the landscape is shifting — with AI changing how results are displayed — businesses that invest in high-quality content, technical SEO, and authority building continue to see strong returns. The key shift is optimizing for visibility and brand awareness, not just clicks.
How big is the SEO industry?
There is no single authoritative figure for the size of the global SEO industry, and published market estimates vary widely. Pricing data is clearer: an Ahrefs survey of 439 SEO professionals found that SEO costs $2,917 per month on average, agencies charge $3,209 per month versus $1,348 for freelancers, and most businesses (63%) spend between $500 and $5,000 per month. For related digital marketing data, see our web design statistics roundup.

Related Posts



Comments (0)