
WooCommerce Statistics 2026: Stores, Revenue & Market Share
Last updated: March 2026
WooCommerce powers 4.17 million live stores, processes $30-35 billion in annual GMV, and commands a 20-39% share of the global ecommerce market depending on the measurement. With 344 million downloads and deep WordPress integration, WooCommerce remains the most flexible open-source ecommerce platform available. Here are 100+ WooCommerce statistics covering market share, revenue, store data, extensions, and performance for 2026.
Key WooCommerce Statistics (2026)
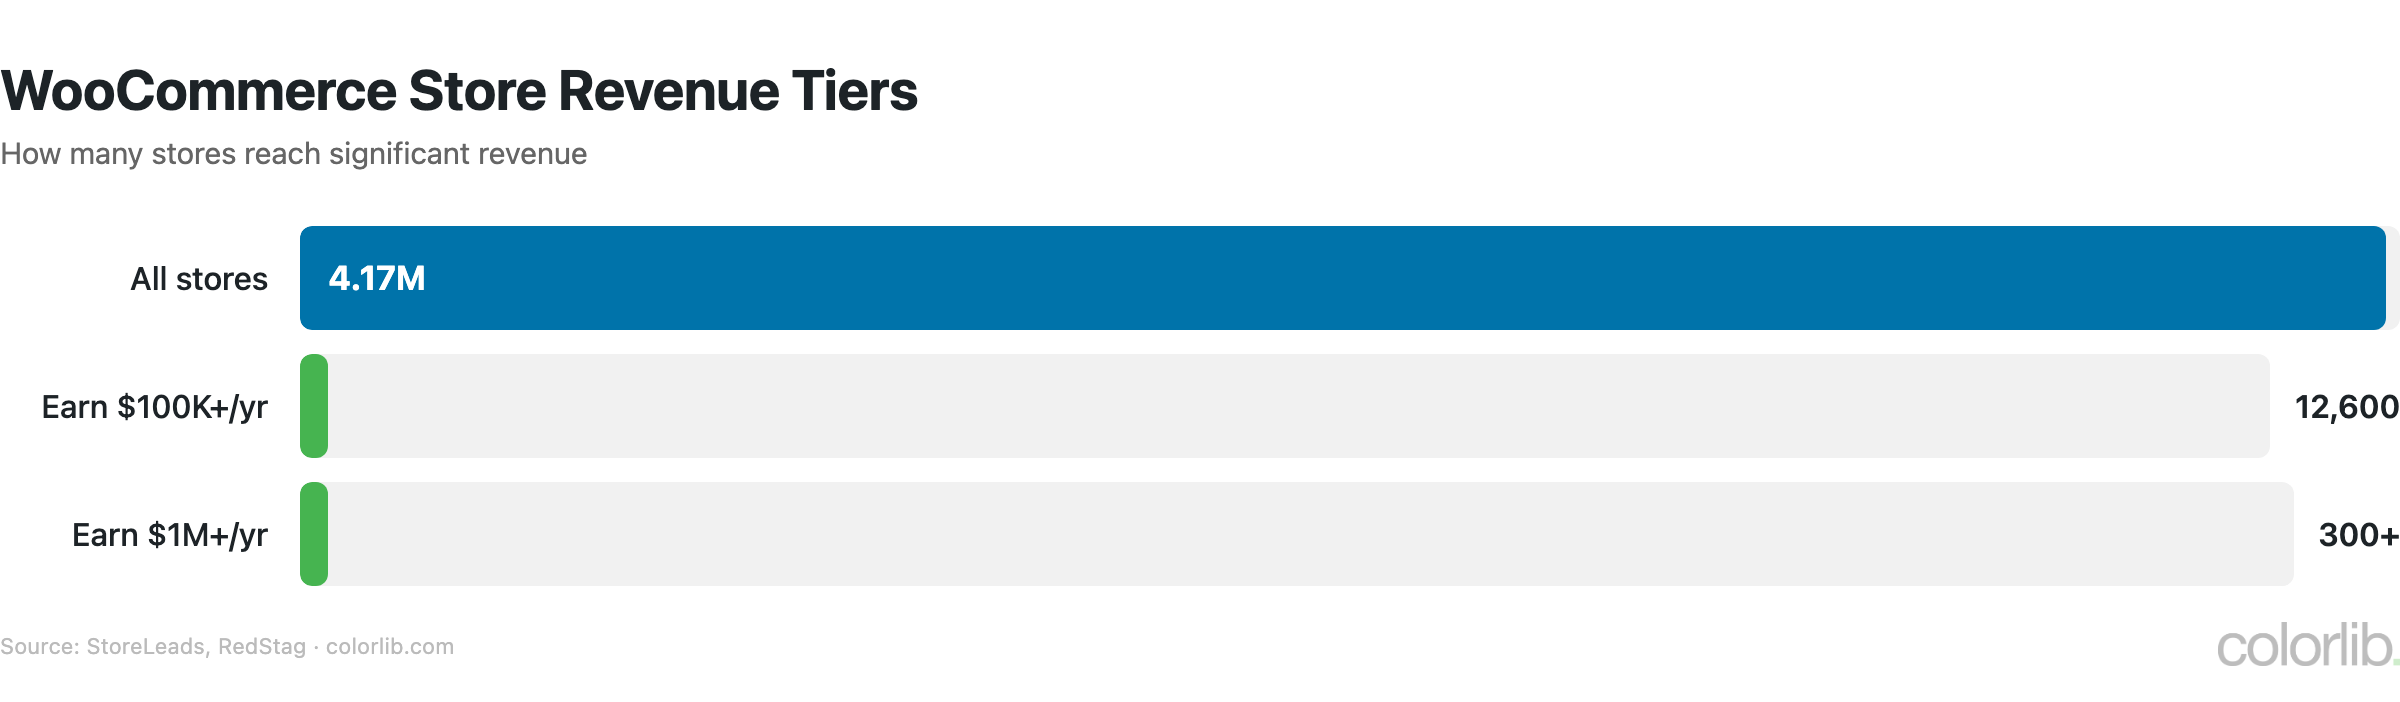
- 4.17 million live WooCommerce stores worldwide (BuiltWith)
- 20-39% of all ecommerce sites use WooCommerce (BuiltWith)
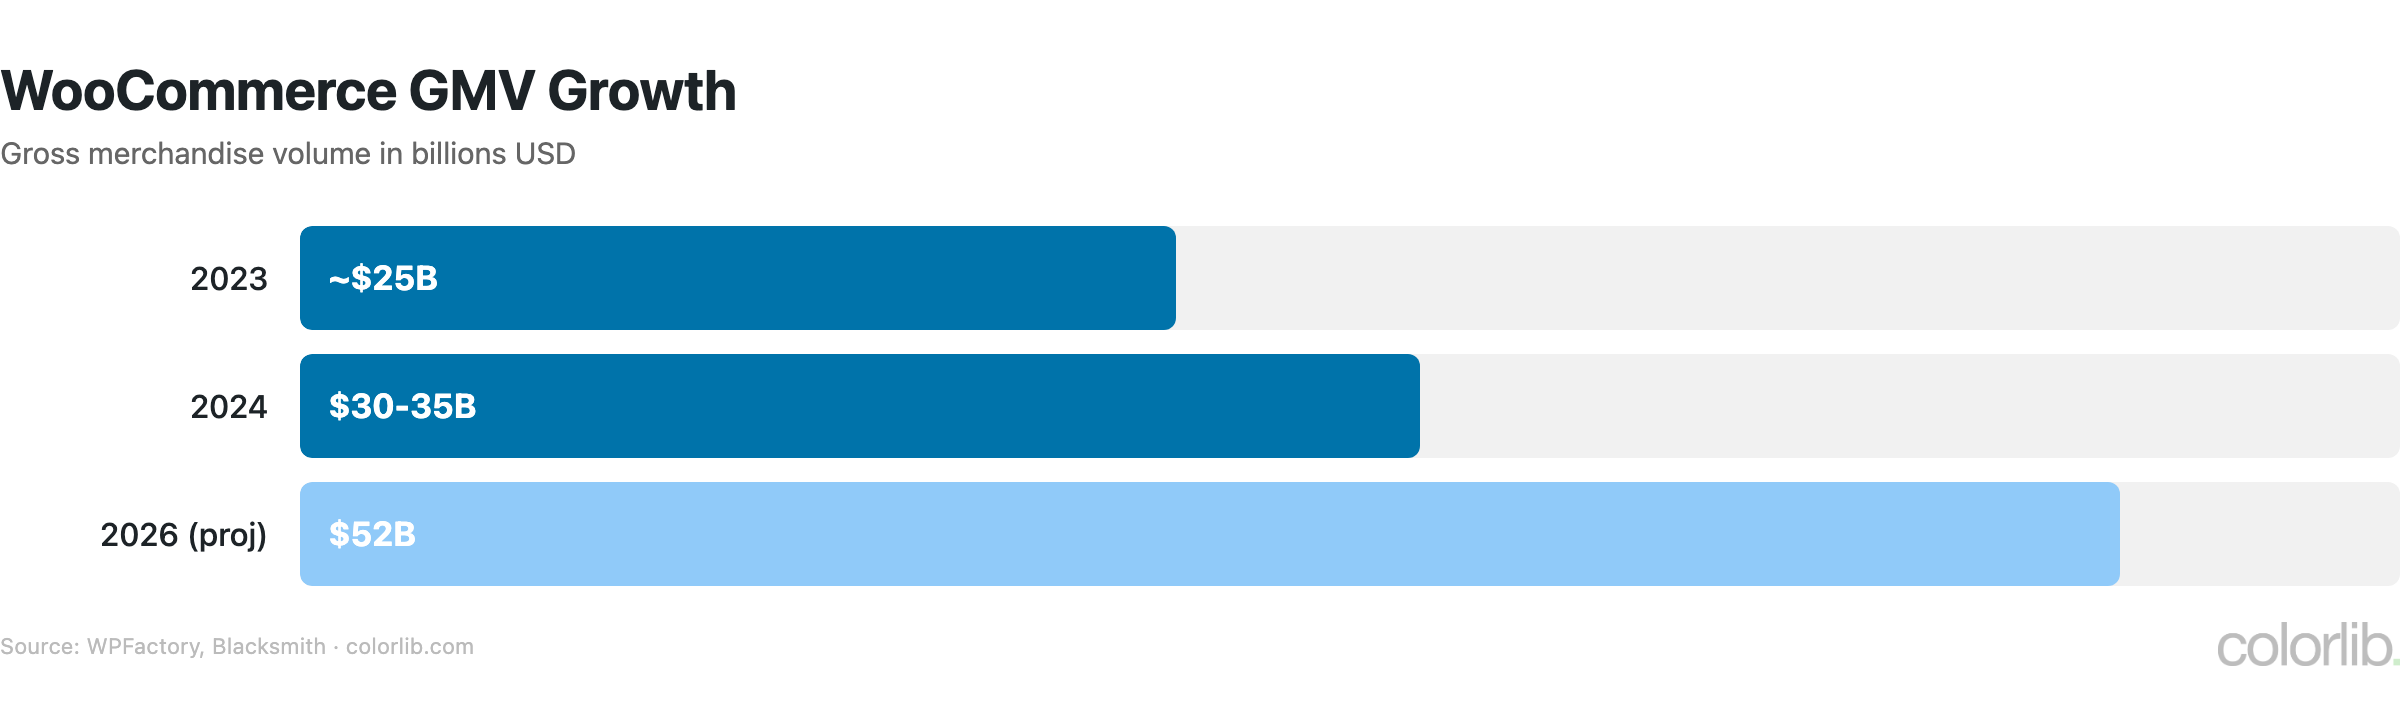
- Annual GMV: $30-35 billion (WooCommerce)
- 344 million+ total downloads (WordPress.org)
- 6.3 million active WordPress installs (WordPress.org)
- 12,600+ stores earn $100K+ annually (BuiltWith)
- 800+ official extensions in the marketplace (WooCommerce)
WooCommerce Market Share
| Metric | Value | Source |
|---|---|---|
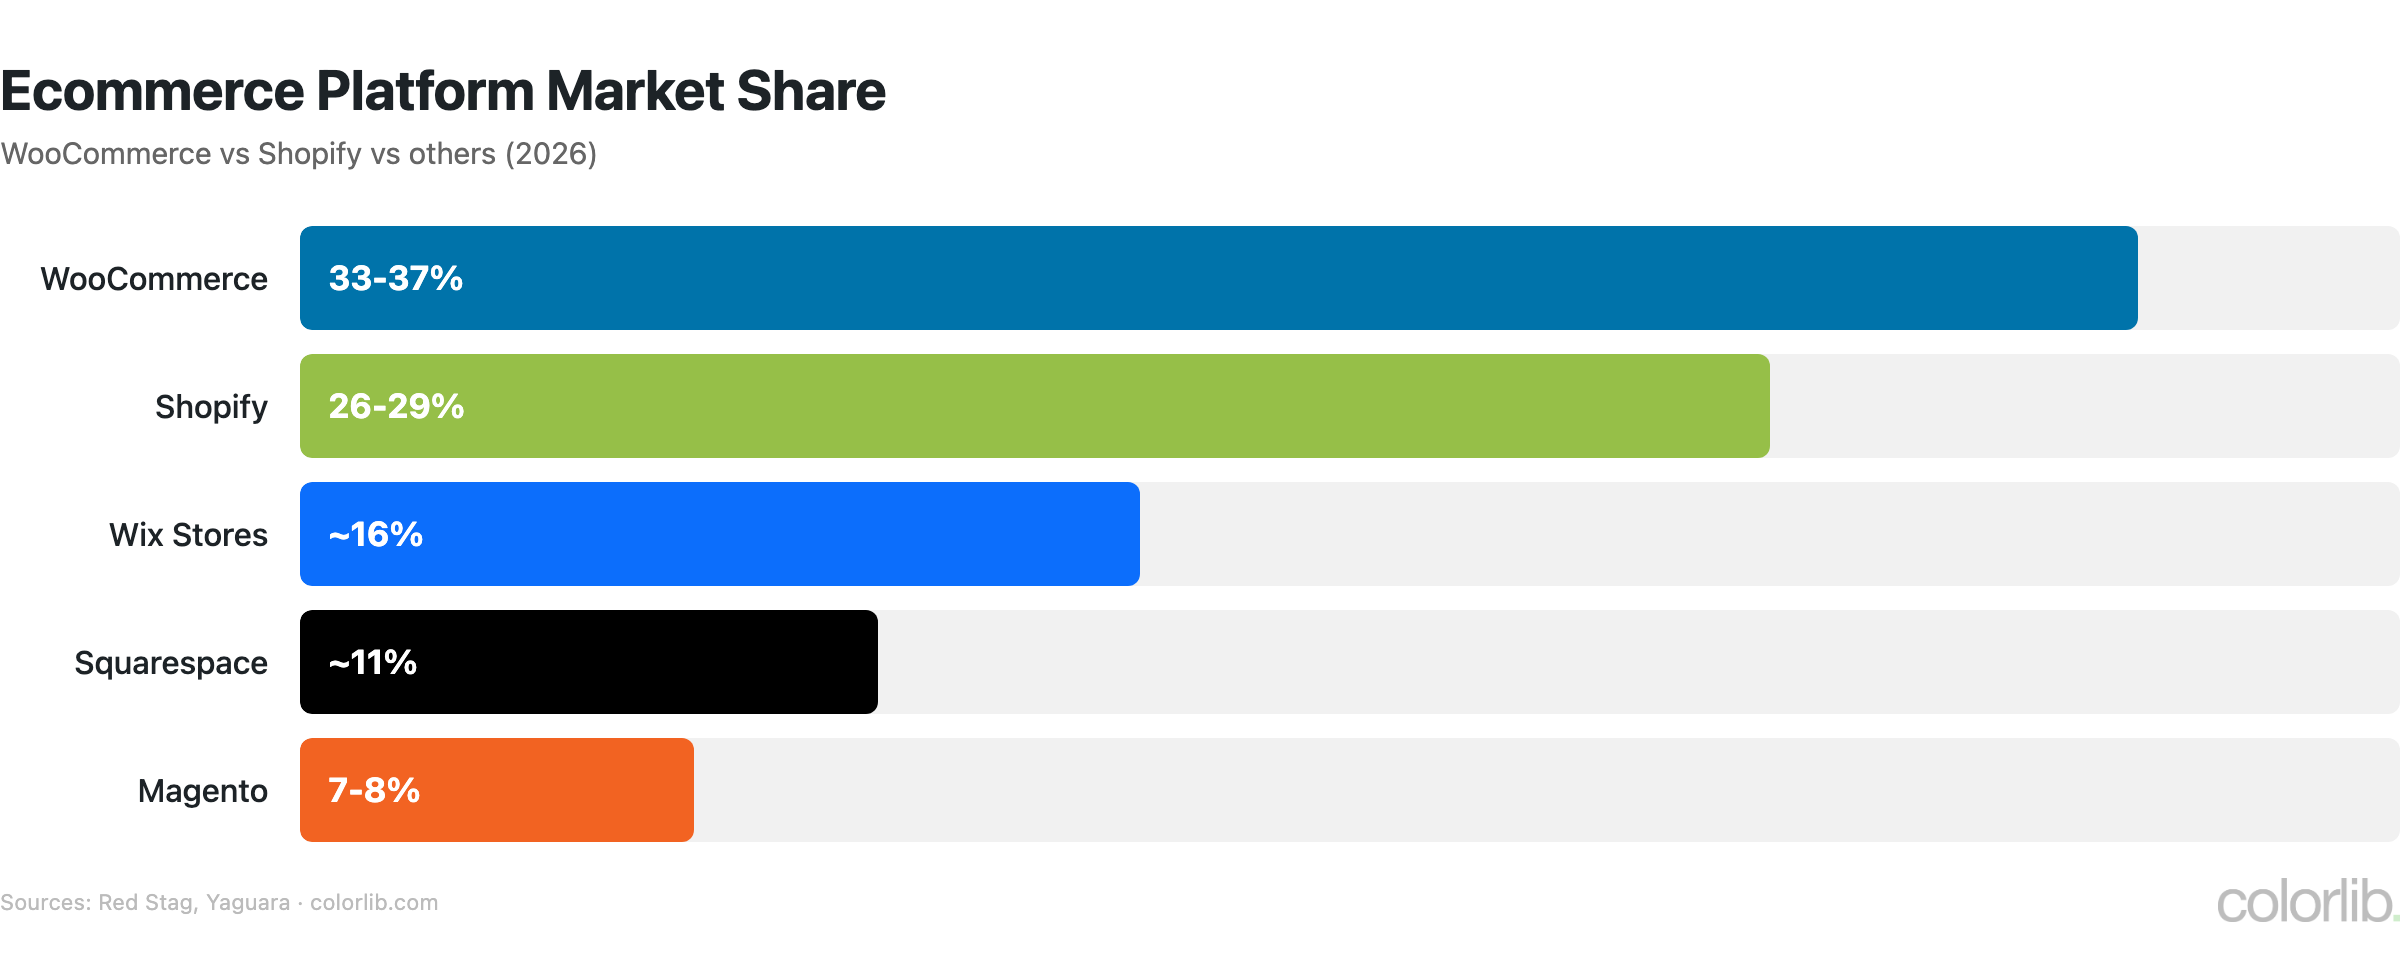
| Share of all ecommerce sites | 20-39% | BuiltWith |
| Share of top 1M ecommerce sites | 23% | BuiltWith |
| WordPress plugin market share | #1 ecommerce plugin | WordPress.org |
| Live WooCommerce stores | 4.17 million | BuiltWith |
| Total downloads | 344 million+ | WordPress.org |
| Active installs | 6.3 million | WordPress.org |
| Countries with WooCommerce stores | 150+ | WooCommerce |
| YoY growth rate | +8-12% | BuiltWith |
- WooCommerce’s market share varies by measurement: 39% of all online stores (BuiltWith, entire internet) vs. 23% of the top 1 million ecommerce sites
- WooCommerce remains the #1 ecommerce platform globally by store count, though Shopify leads in GMV and enterprise adoption
- Top countries for WooCommerce: US (28%), UK (6%), India (5%), Germany (4%), Brazil (3%)
- WooCommerce’s open-source nature means $0 licensing cost, but stores typically spend $500-$5,000/year on hosting, extensions, and maintenance
- For the full ecommerce platform landscape, see our CMS market share analysis
WooCommerce Revenue & GMV
| Metric | Value | Source |
|---|---|---|
| Estimated annual GMV | $30-35 billion | WooCommerce / Industry estimates |
| Average store revenue | $7,200-$8,500/year | Calculated from GMV / live stores |
| Stores earning $100K+/year | 12,600+ | BuiltWith |
| Stores earning $1M+/year | 2,100+ | BuiltWith |
| Average order value | $75-$95 | Littledata |
| WooCommerce Payments adoption | 15-20% of stores | WooCommerce |
| Automattic revenue from Woo | $250-300 million (est.) | Industry estimates |
- While WooCommerce leads in store count, Shopify’s $270B+ GMV dwarfs WooCommerce’s $30-35B — reflecting Shopify’s stronger enterprise presence
- The majority of WooCommerce stores are small to mid-size businesses, with average revenue of $7,200-$8,500/year
- WooCommerce Payments (powered by Stripe) is growing but only serves 15-20% of stores — most use third-party gateways like PayPal and Stripe directly
- WooCommerce generates an estimated $250-300 million annually for Automattic through extensions, WooCommerce Payments, and hosting referrals
- The average WooCommerce store processes 120-150 orders/month, compared to Shopify’s 200+ average
WooCommerce Store Statistics
| Metric | Value | Source |
|---|---|---|
| Average products per store | 50-200 | Metorik |
| Stores using variable products | 68% | Metorik |
| Average cart abandonment rate | 69.82% | Baymard Institute |
| Mobile share of WooCommerce sales | 60%+ | Metorik |
| Digital-only product stores | 22% | BuiltWith |
| Stores with subscriptions | 18% | WooCommerce |
| Average conversion rate | 1.5-3% | Littledata |
- Mobile traffic accounts for 60%+ of WooCommerce store visits, making responsive themes and mobile optimization critical
- Cart abandonment averages 69.82% across WooCommerce stores — recovery emails can recapture 5-15% of abandoned carts
- 22% of WooCommerce stores sell only digital products (downloads, courses, memberships), leveraging WordPress’s content management strengths
- Subscription-based stores (18%) represent a growing segment, driven by the WooCommerce Subscriptions extension
- The average WooCommerce conversion rate of 1.5-3% is slightly below Shopify’s 1.8-3.5%, largely due to more varied store quality
WooCommerce Extensions & Themes
| Metric | Value | Source |
|---|---|---|
| Official extensions | 800+ | WooCommerce Marketplace |
| Third-party extensions | 6,000+ | WordPress.org |
| Average extensions per store | 7-12 | Metorik |
| Annual extension spend (avg) | $500-$5,000 | Industry estimates |
| WooCommerce-compatible themes | 1,500+ | WordPress.org |
| Most popular payment gateway | PayPal (48%) | BuiltWith |
| Second most popular gateway | Stripe (35%) | BuiltWith |
- The WooCommerce ecosystem includes 800+ official extensions and over 6,000 third-party plugins on WordPress.org
- Average store runs 7-12 WooCommerce-specific extensions covering payments, shipping, marketing, and analytics
- PayPal remains the most popular gateway (48%), followed by Stripe (35%) and WooCommerce Payments (15-20%)
- Annual extension spending averages $500-$5,000 — significantly less than Shopify’s app costs due to open-source alternatives
- Top free extensions: WooCommerce Stripe Gateway, Jetpack, WooCommerce PayPal Payments, YITH WooCommerce Wishlist
WooCommerce Performance Statistics
| Metric | WooCommerce | Shopify |
|---|---|---|
| Core Web Vitals pass rate | 33-40% | 75-78% |
| Average page load (desktop) | 3.2s | 1.8s |
| Average page load (mobile) | 5.5s | 3.2s |
| Average page weight | 2.8 MB | 2.1 MB |
| Uptime (managed hosting) | 99.9% | 99.99% |
| Checkout conversion rate | 45-55% | 55-65% |
- WooCommerce’s Core Web Vitals pass rate (33-40%) lags behind Shopify (75-78%) due to varied hosting quality and plugin bloat
- Managed WooCommerce hosting (WP Engine, Cloudways, Kinsta) improves pass rates to 55-65%, narrowing the gap
- WooCommerce checkout conversion (45-55%) trails Shopify’s Shop Pay-boosted rates — one-click checkout plugins can close this gap
- Average WooCommerce page weight of 2.8 MB is higher than Shopify, often due to unoptimized images and excessive plugins
- For a deeper dive into WordPress performance, see our WordPress statistics report
WooCommerce vs. Shopify
| Metric | WooCommerce | Shopify |
|---|---|---|
| Live stores | 4.17 million | 4.7 million |
| Annual GMV | $30-35 billion | $270+ billion |
| Pricing | Free (+ hosting) | $39-$399/month |
| Transaction fees | 0% (gateway fees only) | 0.5-2% (+ gateway) |
| Customization | Unlimited (open source) | Limited (Liquid templates) |
| Hosting | Self-hosted | Fully hosted |
| Best for | Content-heavy stores | Pure ecommerce |
- WooCommerce and Shopify are nearly tied on store count (4.17M vs 4.7M), but Shopify dominates in GMV ($270B+ vs $30-35B)
- WooCommerce’s $0 licensing cost makes it the choice for budget-conscious merchants, though total cost of ownership averages $2,000-$10,000/year
- WooCommerce’s strength is content + commerce integration — stores that rely heavily on blogging, SEO, and content marketing benefit from WordPress’s publishing tools
- Shopify wins on ease of use, checkout conversion, and performance out of the box — no hosting or plugin management needed
- For the full comparison, see our Shopify statistics report
Key Takeaways
- WooCommerce leads in store count. With 4.17 million live stores and 39% of all ecommerce sites, WooCommerce is the most widely used ecommerce platform globally.
- Open source is the key differentiator. Zero licensing fees, unlimited customization, and no transaction fees make WooCommerce the most flexible and cost-effective platform for merchants.
- Performance is WooCommerce’s weakness. A 33-40% Core Web Vitals pass rate and slower load times compared to Shopify reflect the challenges of self-hosted, plugin-dependent architecture.
- Small business is the sweet spot. Most WooCommerce stores earn $7,200-$8,500/year — the platform excels for content-heavy small businesses rather than high-volume enterprise commerce.
- The extension ecosystem is massive. 800+ official and 6,000+ third-party extensions provide unmatched flexibility, though plugin quality varies significantly.
- WordPress integration is the moat. For businesses that combine content marketing with ecommerce, WooCommerce + WordPress remains unbeatable — no other platform matches WordPress’s publishing capabilities.
Sources
- BuiltWith — WooCommerce Usage Statistics
- WordPress.org — WooCommerce Plugin Page
- WooCommerce — About / Company Info
- Metorik — WooCommerce Statistics
- Littledata — WooCommerce Benchmarks
- HTTP Archive — Core Web Vitals Report
- Baymard Institute — Cart Abandonment Statistics
Frequently Asked Questions
How many stores use WooCommerce?
WooCommerce powers 4.17 million live stores worldwide, with 6.3 million active WordPress installs and 344 million+ total downloads. It holds 20-39% of the global ecommerce market share depending on how measurement is scoped. The largest markets are the US (28%), UK, India, and Germany.
Is WooCommerce really free?
The WooCommerce plugin itself is 100% free and open source. However, running a WooCommerce store requires WordPress hosting ($5-$50/month), a domain ($10-15/year), SSL certificate (often free), and typically $500-$5,000/year in premium extensions for payments, shipping, and marketing. Total cost of ownership averages $2,000-$10,000/year for a serious store, compared to Shopify’s $39-399/month subscription.
How does WooCommerce compare to Shopify?
WooCommerce leads in store count (4.17M vs 4.7M) and flexibility (open source, unlimited customization), while Shopify dominates in GMV ($270B+ vs $30-35B), performance (75-78% vs 33-40% CWV pass rates), and ease of use. WooCommerce is best for content-heavy businesses and developers who want full control. Shopify is better for merchants who want a turnkey solution. See our Shopify statistics for the full comparison.
What percentage of ecommerce runs on WooCommerce?
WooCommerce powers 20-39% of all ecommerce websites globally, making it the most widely used platform by store count. The range depends on measurement methodology — BuiltWith shows 39% of all detected ecommerce sites, while W3Techs shows a smaller share when measuring top sites only. For context, see our CMS market share analysis for the broader platform landscape.
Related Posts


Comments (0)