21 Best Web Application Monitoring Tools for Developers 2023
With any of these powerful monitoring tools for web developers, you can be safe and sound that your application or website operates flawlessly at all times – which it must.
What is happening with your apps? How about your server? When was the last time you analyzed your logs? Probably never! We don’t blame you, the manual process of analyzing and monitoring a server can feel like a ton of work, and it is.
But monitoring has some intense benefits to take advantage of, especially in application/server security. Moreover, it also helps understand how your users use your app and what you can do to improve the user experience.
Use monitoring tools for performance improvements
Believe it or not — there’s a lot of room for improvements, even if you think you have done everything in your power. There’s always something more, and these apps/tools will tell you exactly what it is.
Monitoring is all about understanding the connection between the app and the server, the app, the user, and all the other wonderful variations you can imagine.
When this post was first proposed as an idea, we didn’t seem to think much of it, yet that was also when it struck us, during our research, that there is huge demand for monitoring tools. Especially for uptime monitoring, general server health monitoring, and user accessibility monitoring.
All these categories have tens of startups working hard on producing the best possible tool to solve the given issue. We had some fun and learned that out of the 100+ tools on the market right now, about 30 of them are worth a mention of their own. Not because they have great communities behind them, but because they achieve the result of smooth monitoring functionality without much interference to your workflow.
Best Web App Monitoring Tools for Developers
1. Uptime Robot
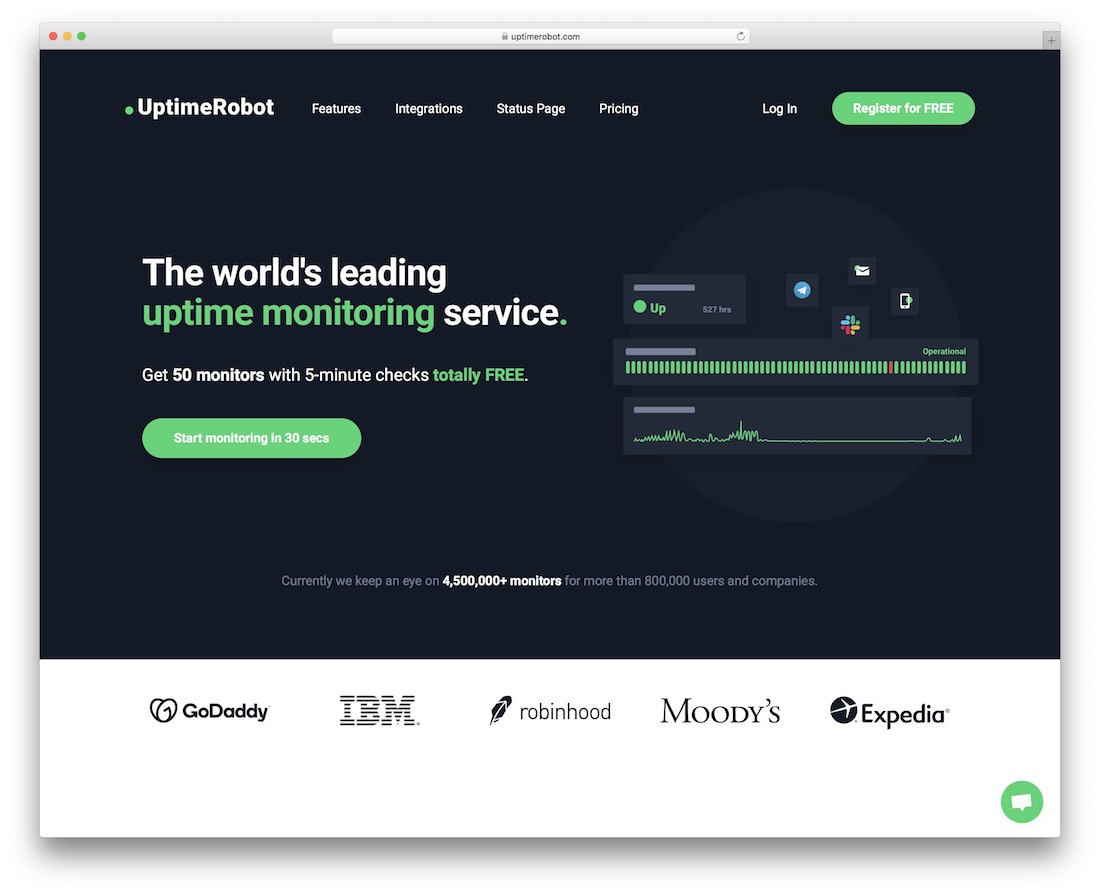
Welcome to Uptime Robot! You can monitor up to 50 websites you can check once every few minutes for free. You can configure multiple uptime monitoring sources for websites, ports, and even keywords. Your notification methods include SMS, social media (Twitter), Slack chat rooms, and API hooks that you can directly hook into your existing apps. You can look up the uptime rates, the downtime rates, and amount of times it takes for your websites/apps to respond. All notifications are verified before confirmed, by checking the uptime ration from multiple locations around the globe. You can also publish your status page using Uptime Robot, a feature that has been highly utilized by its clients already.
2. New Relic (Our Favorite)
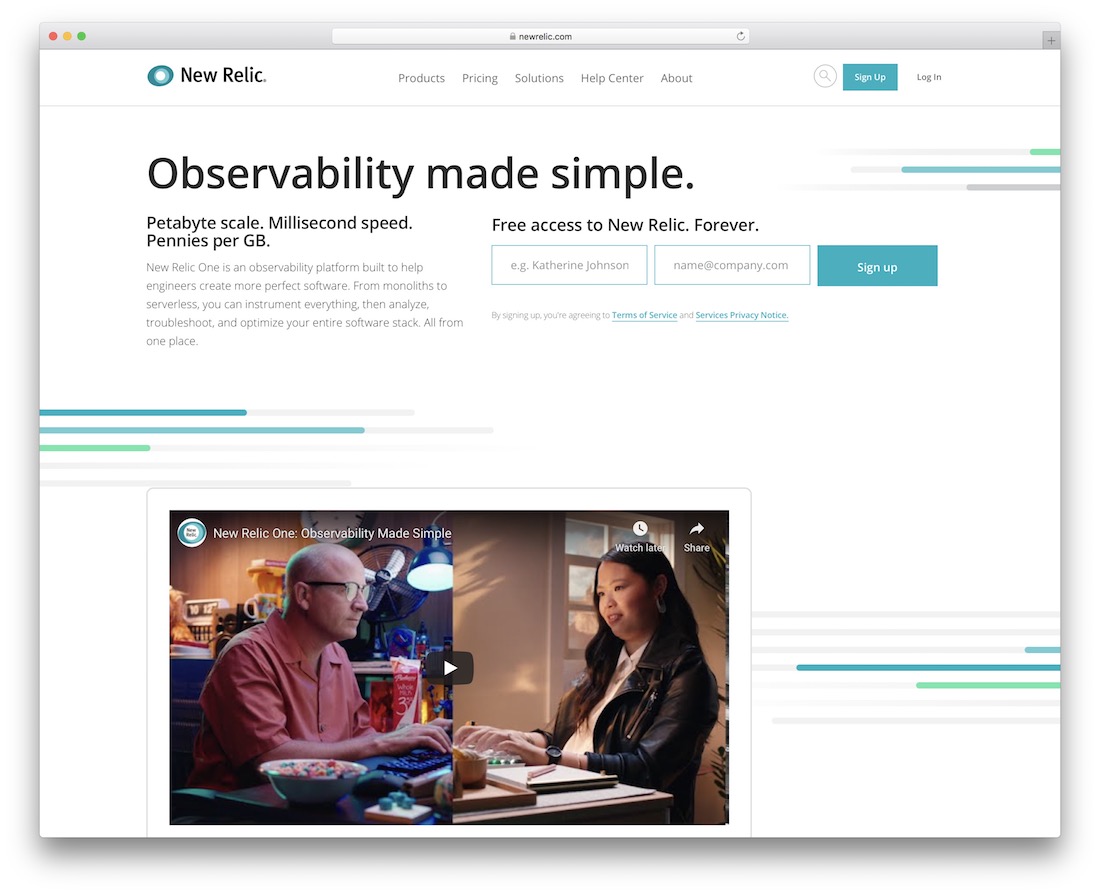
New Relic grew immensely over the last two years, thanks to their dedication to developing a real-time monitoring and analysis application that gives you all the necessary insight to understand your application performance. Whether you want to monitor the page load times or see what eats up most of your server memory, New Relic is the monitoring tool that can carefully detail all these aspects through visual analysis methods.
Built for modern applications to support the way DevOps teams work, New Relic APM is designed with the flexibility to monitor apps in any language, on any hosting configuration, and across any configuration of backend or 3rd party services. New Relic doesn’t stop at app monitoring either, their services extend to the browser, mobile, and your system. So you can easily monitor all your infrastructure’s important and sensitive parts from one place. Integrate in minutes, and get access to your application performance data immediately.
3. Dotcom-Monitor
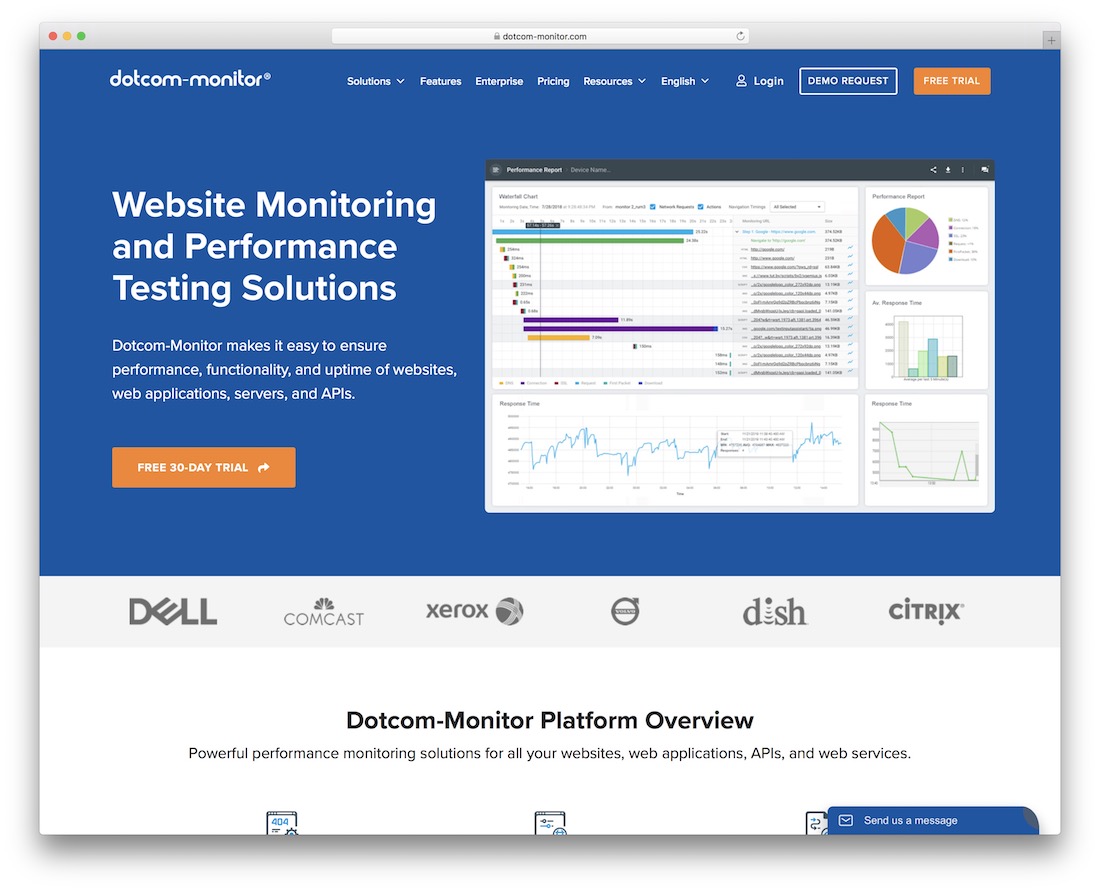
Dotcom-Monitor is a powerful and flexible monitoring tool for web developers that offers many features and functions. It helps take care of everything, from website performance and uptime to load and stress testing, app and server monitoring, you name it. With this, you can track how well your website or application is doing and where it needs to be improved. With multiple global locations, you will have no trouble discovering where’s the issue.
Always aim for the best user experience.
Some of the great features of Dotcom-Monitor are reporting, alerts, filters, 3rd-party integrations, scheduling and more. Of course, you can also take things to the next level and use custom scripts, as Dotcom-Monitor integrates with them easily. Moreover, you can also select from four different pricing plans, starting at $19.95 per month. Every package comes with a 30-day free trial (no credit card necessary), which means enough time to test things out and see how powerful Dotcom-Monitor is first-hand.
4. Pulseway

Monitoring a project and its performance is essential for optimizing and making it bigger and better. With Pulseway, a handy tool for remote monitoring, you can handle all sorts of technicalities that will help small businesses take things to the next level. Whatever IT needs and regulations you want to control, you can do it handily with Pulseway.
Even though Pulseway offers several products, monitoring and management are at the top. It fully supports Windows, Linux, Mac systems, and various applications with the monitoring API. You can put Pulseway into the application from anywhere, using any device, as the tool is fully functional on mobile devices. You can also enjoy a Starter plan, free of charge, and move from there.
5. AlertBot

AlertBot is a monitoring tool for web developers hunting for a way to optimize their or clients’ projects for scale. Even though AlertBot does advanced work for you, the usability is very user-friendly. In other words, whether you are a beginner or a professional, with AlertBot, everyone gets what they are after.
You can monitor websites, mobile performance, servers, multi-page processes, and more. It does the trick with real web browsers, so you know the results and data are as accurate as possible. Real-time alerts, performance tracking, script clicks, smartphone and tablet browser testing, you name it, AlertBot rocks tons of goodies for your convenience. Start the free trial now and see how well your project does to top it all up.
6. Site24x7
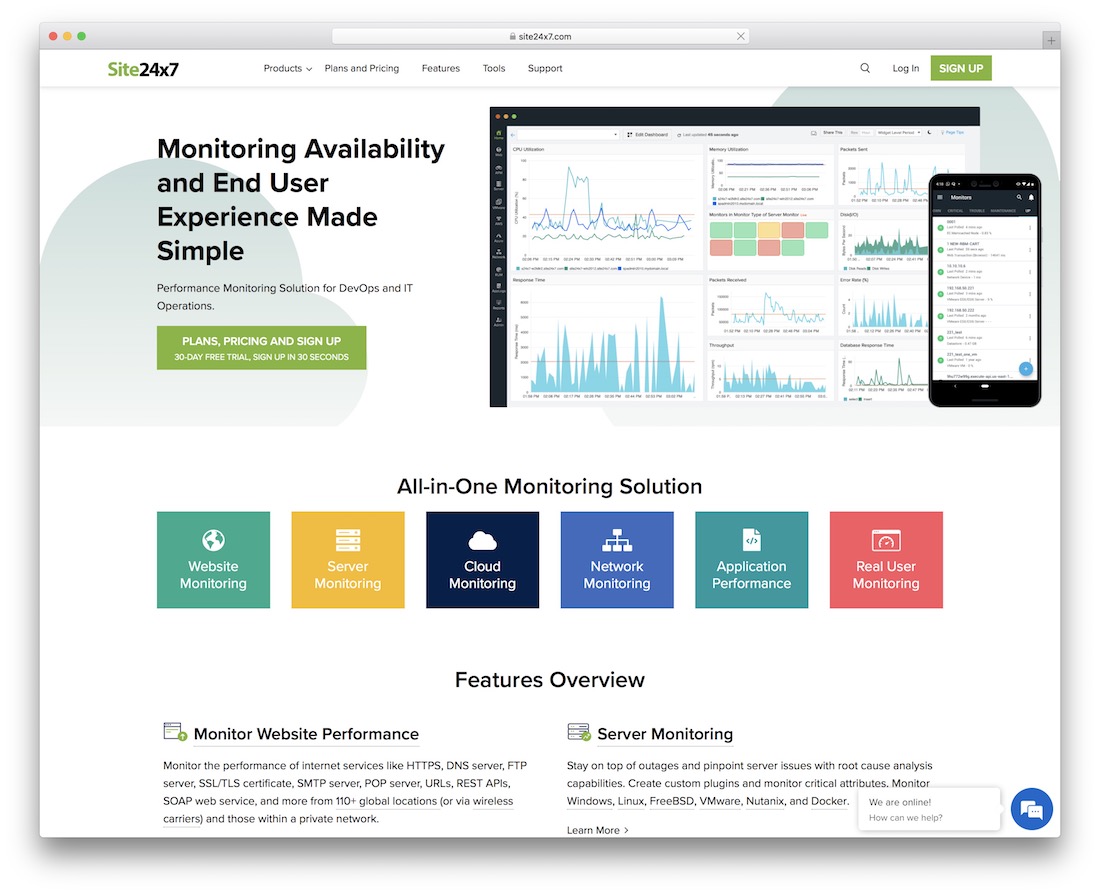
Do monitor website performance and user experience the right way with Site24x7. That is the super short way of starting the conversation about Site24x7. It is a powerful, flexible and sophisticated alternative for viewing how your application or project does in the real world. Slow websites and bad performance can lead to loss of sales and even affect rankings. Avoid the inconvenience by tracking everything with the use of Site24x7 now.
The list of features is vast, ensuring Site24x7 covers all the necessary and then some. You can monitor anything from website and synthetic web transactions to server, application performance, end-user experience, etc. In short, the options are pretty much endless regarding Site24x7. Moreover, there are four different premium packages, but you can also kick things off with the free-forever plan.
7. Circonus

Circonus works with DevOp’s to help them understand their systems better. Its main selling points are your system’s concise real-time metrics analysis that can be quickly turned into visualizations, ready for instant delivery and fixing. Circonus can help you analyze metrics such as: network, cloud, machine data, devices, servers, web, rss feeds, internet of things, databases, business data, virtual data, ecommerce, and software. All these metrics can be combined into real-time analysis such as reports, graphs, thresholds, and even root cause analysis of where the problems originate from. A truly invaluable monitoring tool for any developer who wants to stay on top of his system, and never let it run into the hole.
8. StatusCake
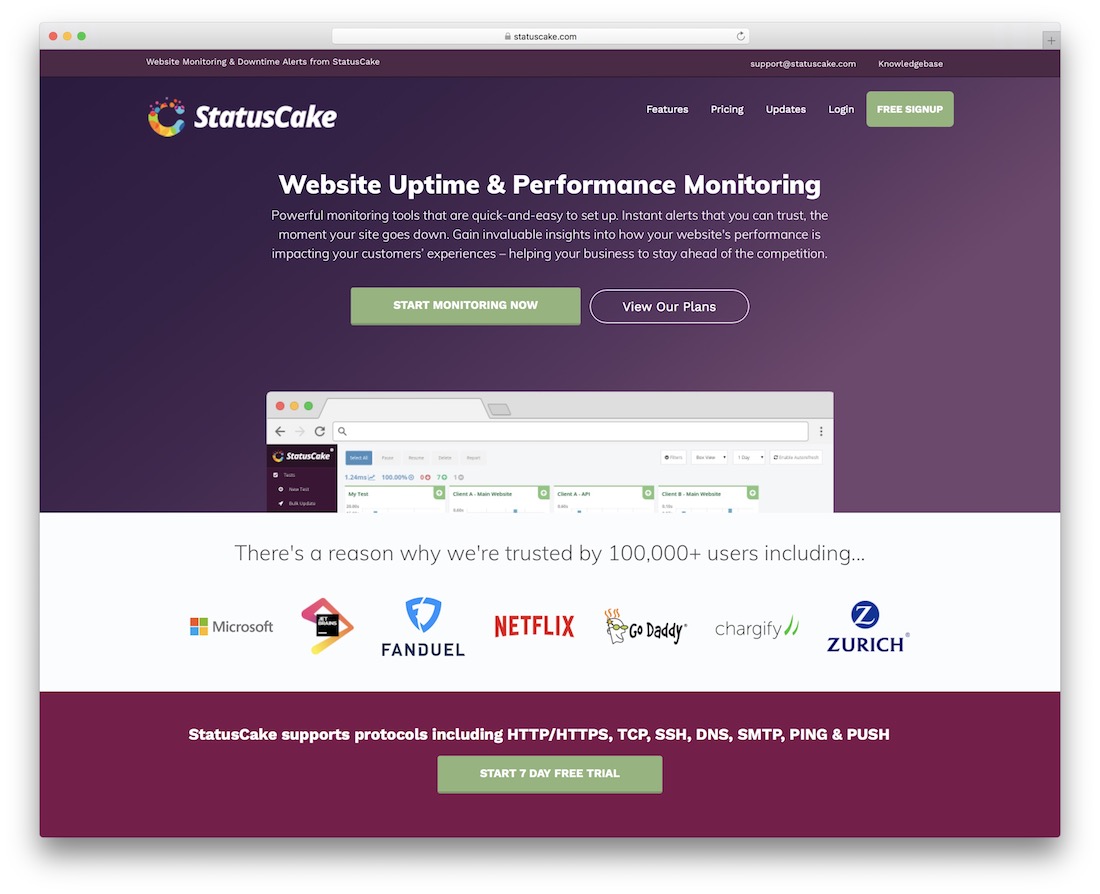
Tens of thousands of users love StatusCake. It’s the quintessential website monitoring and downtime monitoring platform to keep your insight about your website performance fresh, and real. Their list of clients include Google, Netflix, GoDaddy, Disney, and many other prominent names in the business field. Don’t risk having your websites go down unnoticed. StatusCake will do everything to instantly alert you about any potential issues with your website.
9. Ghost Inspector

Testing and monitoring goes beyond the real-time server analysis, the structure of an application or a server involves many unique aspects, one of which is UI; User Interface. Just like your server needs stress testing, so does your UI. Ghost Inspector is a Chrome extension that you add to your browser. Once you add this monitoring tool, you can test websites for their UI performance. Whether errors are encountered at any point, the Ghost Inspector widget will record all that data for instant availability.
You can also avoid the recording part altogether, and instead, use the visual editor to create your manual tests and only test the things that are important to you. Once a test has been recorded or built, you can continue monitoring the results and see what parts of your UI are not functioning as you’d expect them to.
10. AppNeta

AppNeta provides four different products: Trace, App, Flow, and Path — all ending with View. The combined power of all these four tools is irreplaceable. You can monitor code performance, monitor how different data interacts with your codebase, preview the impact external traffic has on your apps, and set up a fully supported network analysis platform to gain insight into your network performance. It is being marketed to both DevOp’s and IT specialists.
11. ThousandEyes

ThousandEyes focuses on both the external and internal performance of your network. Such analysis helps improve your application’s performance and delivery rates and reduce the number of times your server crashes. What’s most intriguing about ThousandEyes, their algorithm can intuitively detect if any upcoming crashes or server errors are coming up, so you can fix them before they even happen. That’s a truly unique way of approaching problems.
A key to understanding network performance is knowing how it changes over time, and that’s when this monitoring tool comes into play. The visual analysis tools really capture the essence of how ThousandEyes work and how it can be used as an internal tool for all things testing and performance. Get as much insight about your page load times, as you can for your server load. Navigate seamlessly across a month of detailed performance data using the Interactive Timeline. Baseline performance across locations and metrics. See where path changes increase latency or introduce packet loss.
12. Sematext
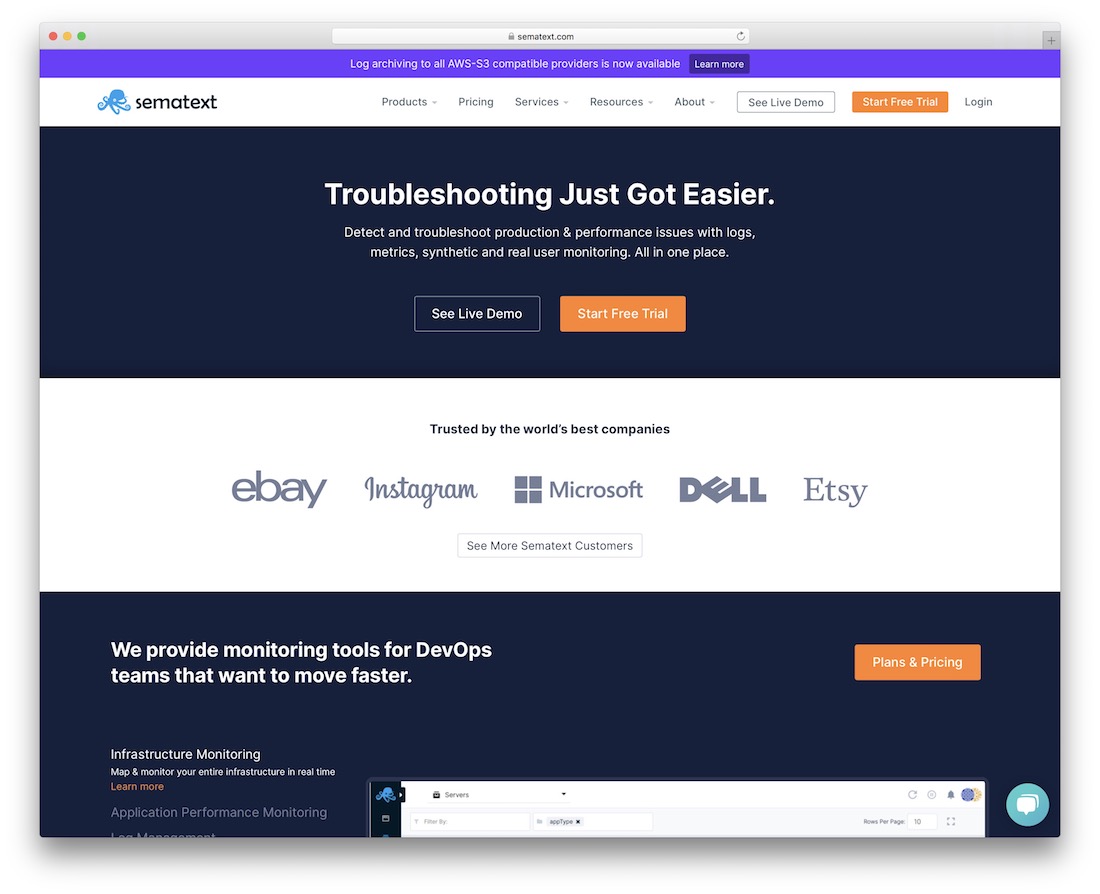
Elasticsearch, Solr & Lucene are the three names you’ll frequently hear about if you plan to explore the world of big data. Monitoring big data can be tough because of how complex the data usually is and how complex the system is running that software. Sematext is a business model that works around the idea of helping you to monitor your big data and in turn, understand its content and uses.
13. Datadog

We had barely any cloud monitoring platforms throughout the list, so it’s time to add some, starting with Datadog. IT experts and DevOp teams who want to better understand their network and app performance in the cloud use Datadog. Gain clear metrics and insights about your application, network and server performance within a single dashboard. The key component of Datadog is the easy integration between cloud apps and services. With the integration of Datadog you’ll have access to automation tools, monitoring tools, database management tools, all these wonderful tools for the platforms you’re running the cloud. Here are a few services that Datadog supports: Amazon, Apache, Bitbucket, Cassandra, Docker, Go, Java, Slack, Redis, MySQL… do we need to go on?
14. Runscope
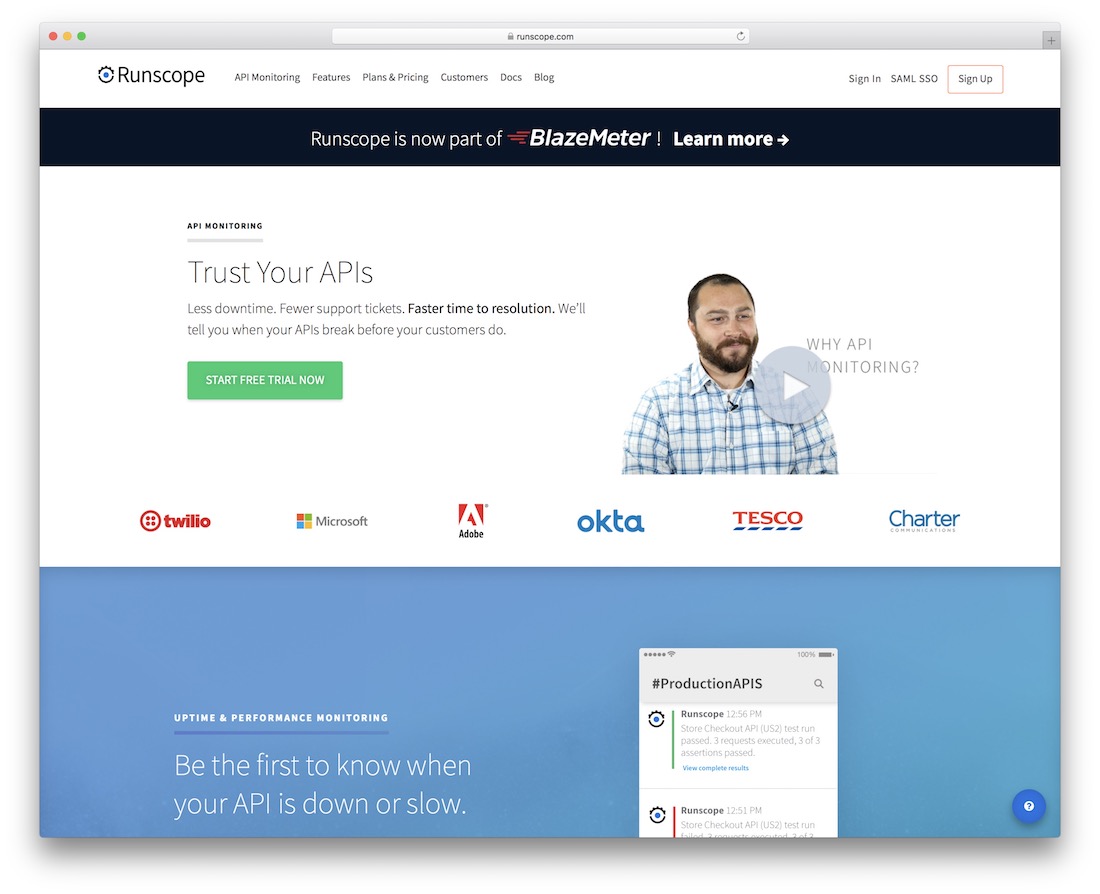
APIs have evolved as some of the essential parts of web development. Many developers produce apps that rely on pure API services to exist in the first place. A good example is all those social media monitoring apps on the market, the only reason they can do what they do (report and monitor) is because of complex API functions and calls. And if you’re relying on external APIs for your service, or even internal, you should have the right tools to monitor their health during any day. Something that Runscope specializes in. The product monitors API performance and verifies any data sent through the API, so you don’t end up delivering garbage where there’s no need to.
15. Blackfire

Performance is the public enemy number one where developers are concerned. Learning the process of building highly reliable apps and networks is crucial, but this will be a tough task to fulfill if you’re not using platforms like Blackfire, these guys are specialists in performance testing, test automation, and the process of understanding how your apps work in the real world. Blackfire can also analyze data like CPU load, I/I load, memory loads, network interaction, database and web server requests.
All that juicy data that helps you hop back into the driver’s seat of performance optimization. Moreover, profiling is done on demand. The only request showing overhead is the one being profiled, only for the profiling session. No other session or request is impacted. You can safely use Blackfire as a monitoring tool on production servers.
16. APImetrics
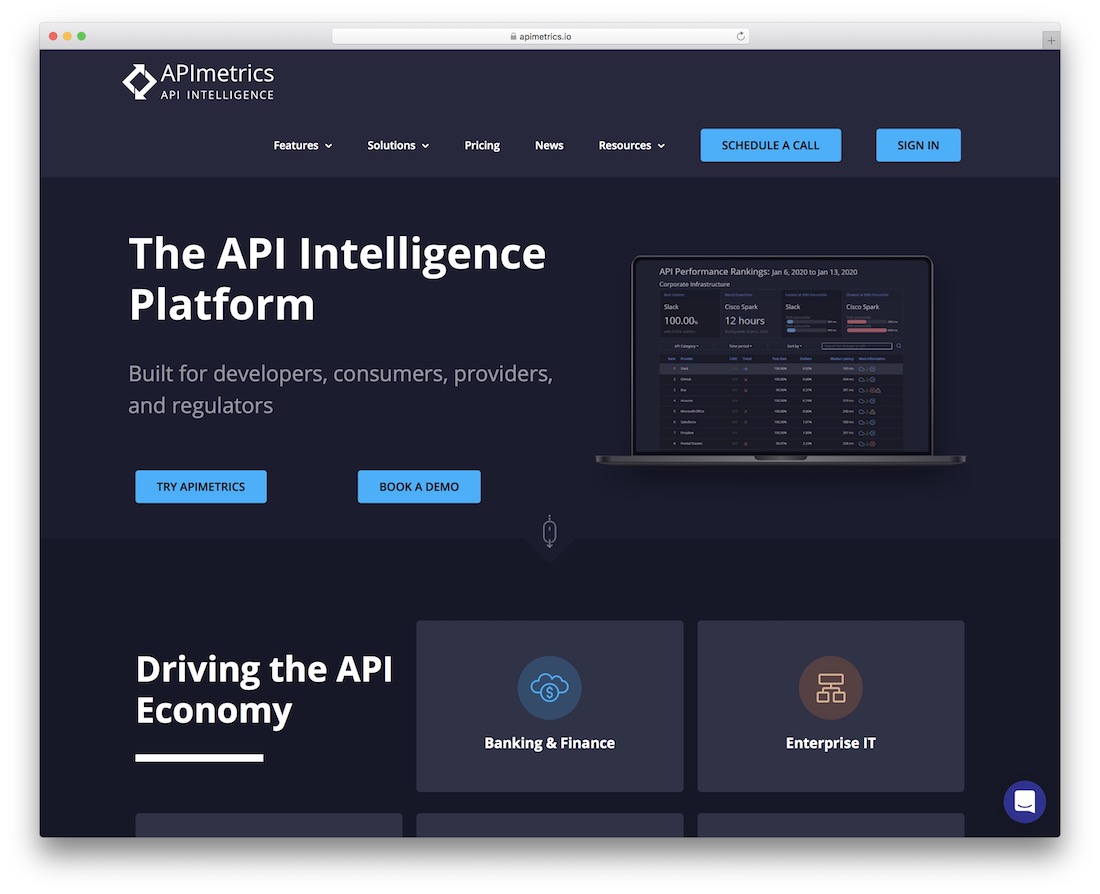
Want to start working APIs, but don’t have a clue as to where to start? Start with APImetrics, a full fledged API solution for businesses and enterprises alike. Use a visual editor to create and deploy complex APIs globally. Access the API analytics platform to present all the data in a single dashboard. Create custom workflow to make continuous sequences of calls. You can configure your API to run it anywhere, be it cloud, or your server infrastructure.
17. StatHat
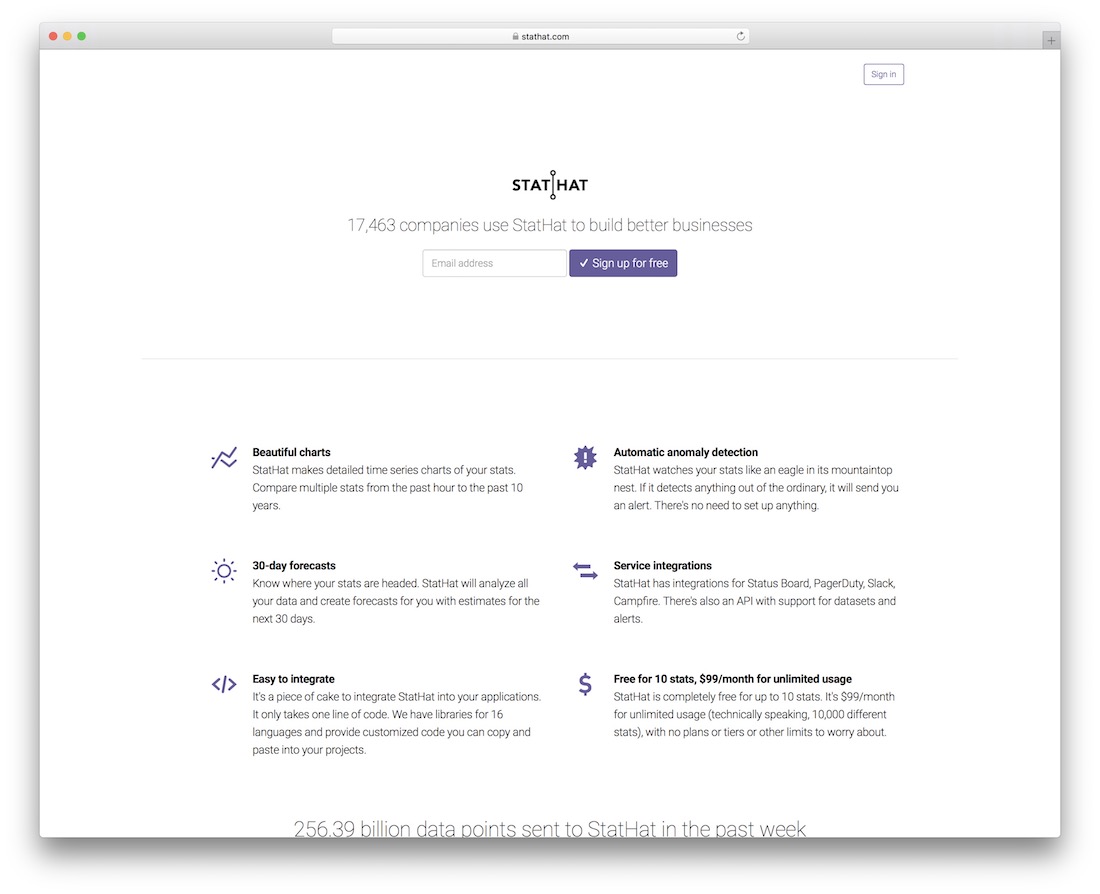
StatHat puts all your important server and web statistics into a single dashboard. Built over a decade ago by the same people who brought us OkCupid.
18. Skylight

Wasting time trying to understand why an error or performance issue is occurring without using an external application to analyze you is another waste of time. Skylight gives you the necessary features to understand why your apps are slow, and what you can do about that slowness to fix it. Skylight although an appealing platform, is only available for Ruby on Rails developers.
19. AppDynamics
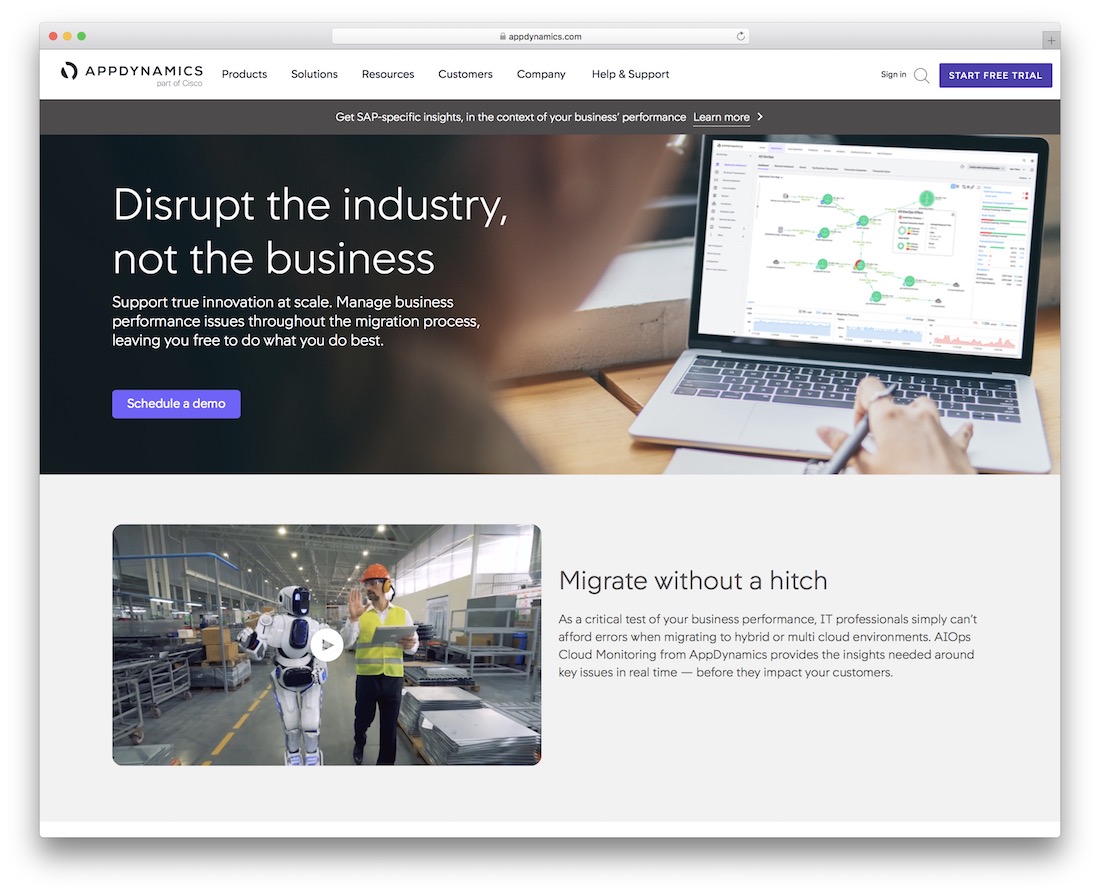
Performance is a crucial element when talking about UX. Application performance doesn’t just stop at improved load times or network interaction. The way that performance affects the browsing experience for the users of your apps also plays a crucial role. That’s why AppDynamics came into the market and other great monitoring tools. The developers can now utilize a single platform that could give the perfect insight into why something doesn’t work as it should. Now, they also know what to do to fix it.
20. Librato
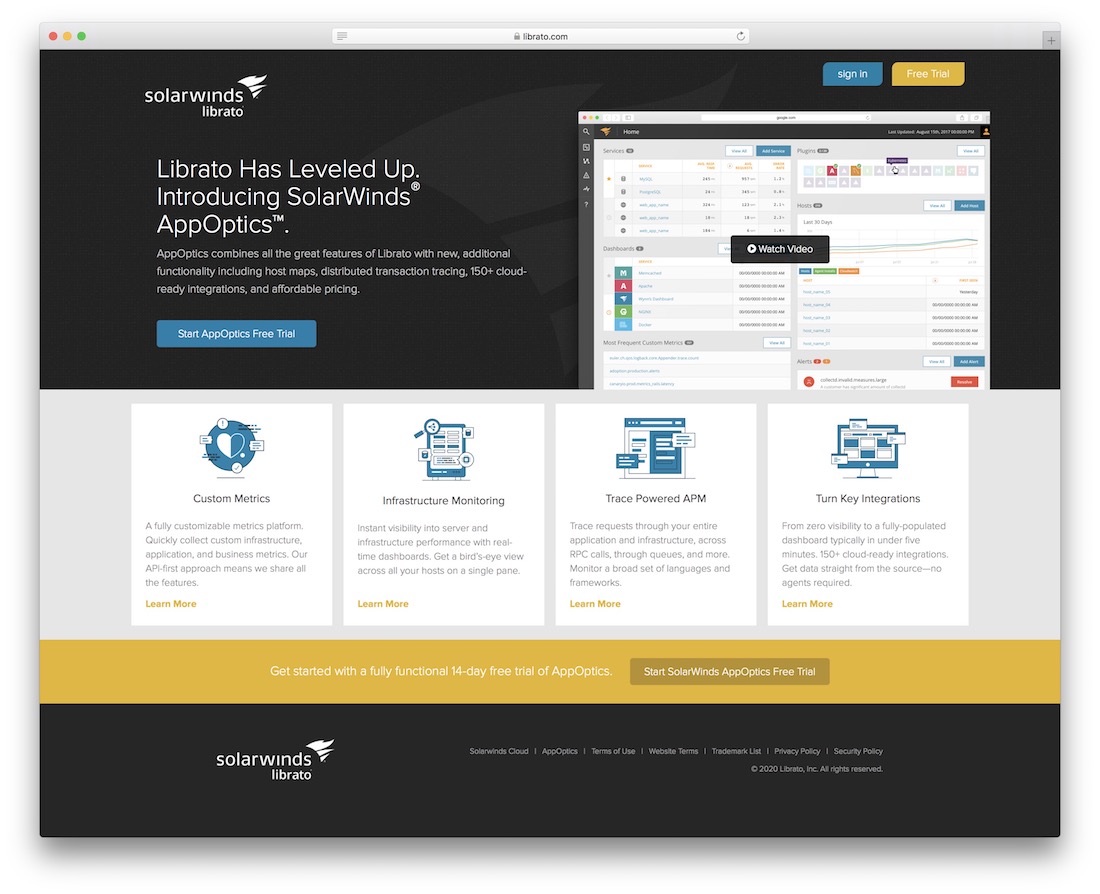
Cloud is everywhere, and so is cloud software. Librato explores the possibilities of real-time monitoring for your cloud application. It also provides a consistent technological approach towards visualizing the important data of your cloud platforms. Furthermore, Librato can do this so that the data becomes useful for making your platform grow. This growth is based on what Librato learns from the data transferred through its algorithms.
21. LoaderIO
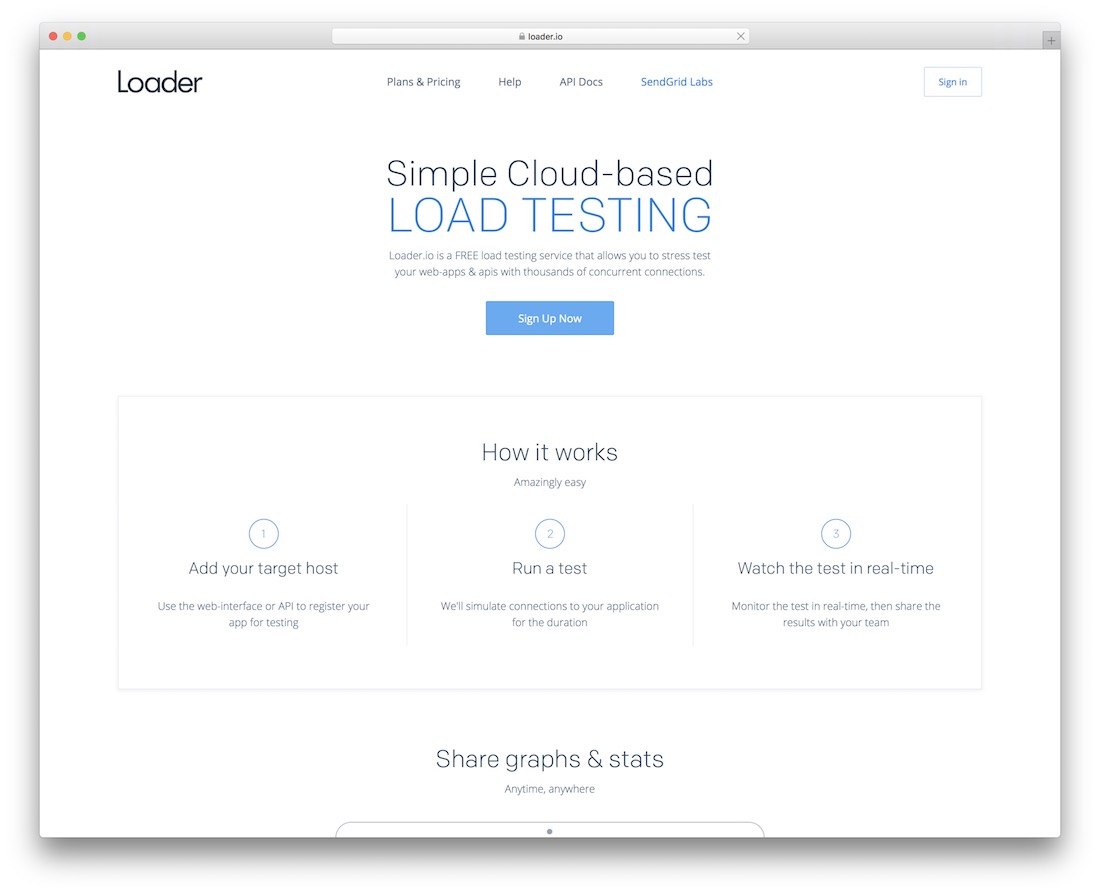
It was quite obvious throughout the list of these amazing monitoring tools that many are premium. These tools require an investment of financial proportions. But, there’s nothing stopping companies from employing these financial challenges. That is because these monitoring tools can give back. Now that we’ve reached the end of the list, we wanted to end it by mentioning Loader. The developers also built this free load testing platform inside of the cloud. Moreover, it can give you great performance results and insights into the maximum load your websites can take.
Related Posts


we use CloudQA which is also a full feature packed tool to test your web application testing, and monitoring.
CULA.IO seems to be missing here. It was announced best option by Techradar when it comes to free solutions.